| Param | Original file | Final file |
|---|---|---|
| Filename | modeM0/AS1A12_029T01_9000005556_40646cztM0_level2.fits | modeM0/AS1A12_029T01_9000005556_40646cztM0_level2_quad_clean.evt |
| Size (bytes) | 534,605,760 | 70,997,760 |
| Size | 509.8 MB | 67.7 MB |
| Events in quadrant A | 2,709,077 | 590,413 |
| Events in quadrant B | 11,034,951 | 170,926 |
| Events in quadrant C | 2,532,699 | 581,118 |
| Events in quadrant D | 3,101,149 | 438,128 |
| Mode M0 | |||
|---|---|---|---|
| Quadrant | BADHDUFLAG | Total packets | Discarded packets |
| A | 0 | 11315 | 3 |
| B | 0 | 36323 | 2 |
| C | 0 | 10884 | 2 |
| D | 0 | 13020 | 2 |
| Mode M9 | |||
|---|---|---|---|
| Quadrant | BADHDUFLAG | Total packets | Discarded packets |
| A | 0 | 22 | 0 |
| B | 0 | 22 | 0 |
| C | 0 | 22 | 0 |
| D | 0 | 23 | 0 |
| Mode SS | |||
|---|---|---|---|
| Quadrant | BADHDUFLAG | Total packets | Discarded packets |
| A | 0 | 108 | 0 |
| B | 0 | 108 | 0 |
| C | 0 | 108 | 0 |
| D | 0 | 108 | 0 |
| Quadrant | Total seconds | Saturated seconds | Saturation percentage |
|---|---|---|---|
| A | 5267 | 10 | 0.189861% |
| B | 5267 | 4002 | 75.982533% |
| C | 5267 | 20 | 0.379723% |
| D | 5267 | 1050 | 19.935447% |
Noise dominated data is calculated using 1-second bins in cleaned event files. If a bin has >2000 counts, and if more than 50% of those come from <1% of pixels, then it is considered to be noise-dominated and hence unusable.
| Quadrant | # 1 sec bins | Bins with >0 counts | Bins with >2000 counts | High rate bins dominated by noise | Noise dominated (total time) | Noise dominated (detector-on time) | Marked lightcurve |
|---|---|---|---|---|---|---|---|
| A | 7060 | 5268 | 4 | 4 | 0.06% | 0.08% | 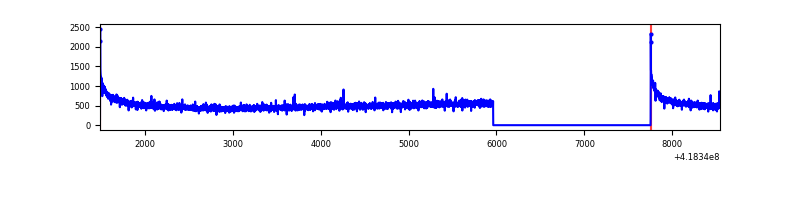 |
| B | 7060 | 5267 | 3801 | 3801 | 53.84% | 72.17% | 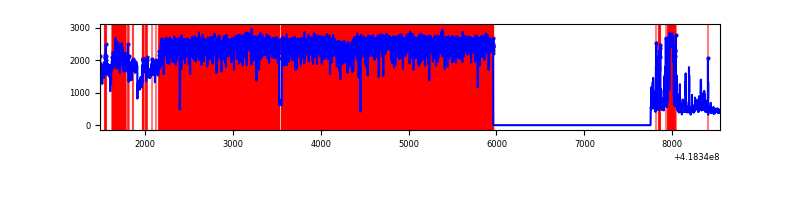 |
| C | 7060 | 5268 | 20 | 20 | 0.28% | 0.38% | 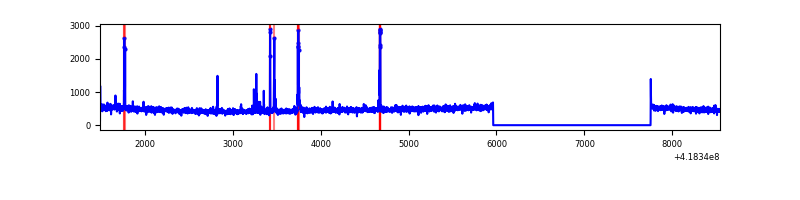 |
| D | 7060 | 5267 | 70 | 70 | 0.99% | 1.33% | 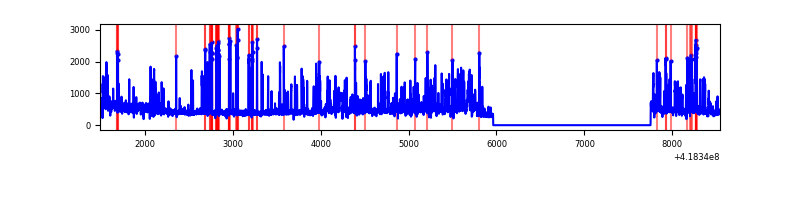 |
Top three noisy pixels from each quadrant. If the there are fewer than three noisy pixels in the level2.evt file, extra rows are filled as -1
| Pixel properties | Quadrant properties | ||||||
|---|---|---|---|---|---|---|---|
| Quadrant | DetID | PixID | Counts | Sigma | Mean | Median | Sigma |
| A | 10 | 83 | 470797 | 4024.37 | 575 | 563 | 116.8 |
| A | 13 | 252 | 8600 | 68.78 | 575 | 563 | 116.8 |
| A | 13 | 254 | 6625 | 51.88 | 575 | 563 | 116.8 |
| B | 7 | 202 | 8596095 | 111731.59 | 402 | 390 | 76.9 |
| B | 0 | 229 | 553848 | 7194.14 | 402 | 390 | 76.9 |
| B | 0 | 190 | 212323 | 2754.82 | 402 | 390 | 76.9 |
| C | 15 | 214 | 229949 | 1749.96 | 561 | 565 | 131.1 |
| C | 14 | 254 | 80925 | 613.06 | 561 | 565 | 131.1 |
| C | 12 | 249 | 25442 | 189.79 | 561 | 565 | 131.1 |
| D | 12 | 227 | 653656 | 5147.78 | 506 | 492 | 126.9 |
| D | 12 | 191 | 231123 | 1817.67 | 506 | 492 | 126.9 |
| D | 12 | 79 | 105661 | 828.87 | 506 | 492 | 126.9 |
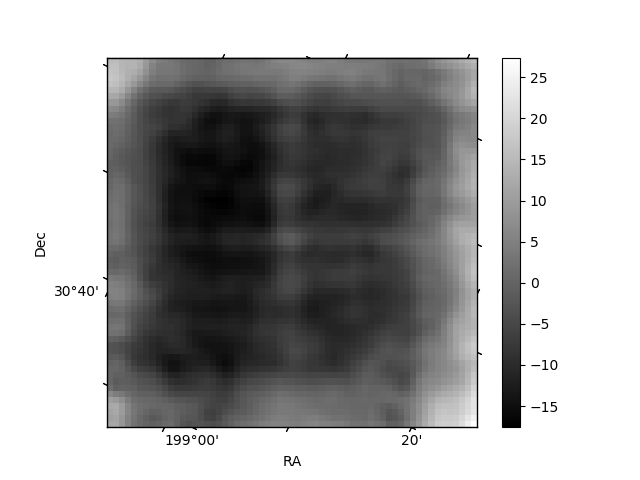
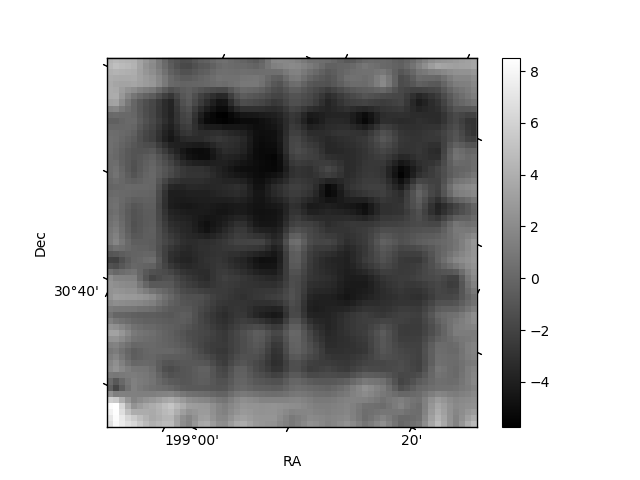
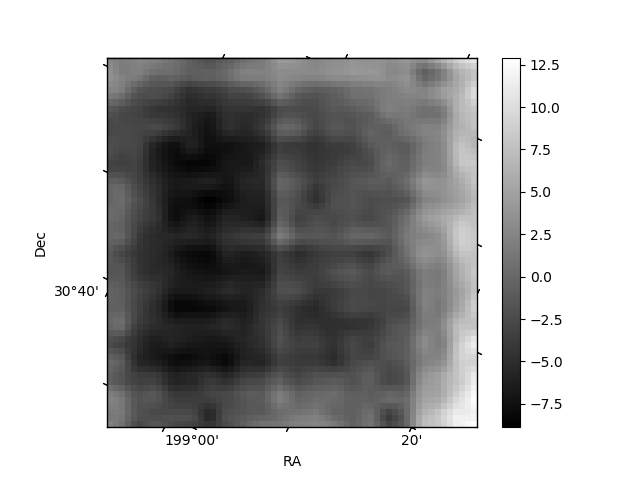
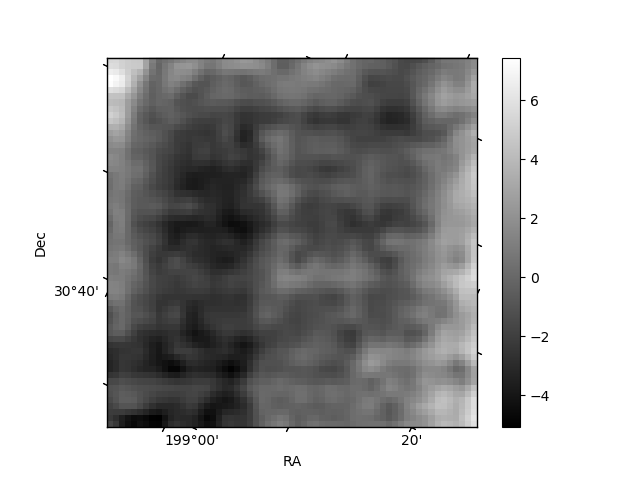
Histogram calculated using DETX and DETY for each event in the final _common_clean file
| Quadrant A | 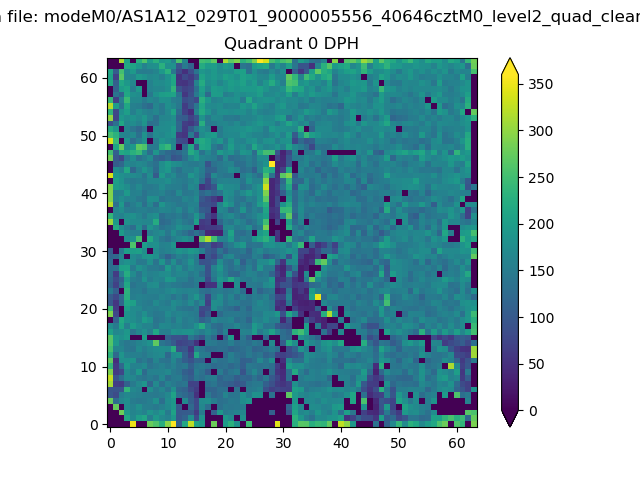 |
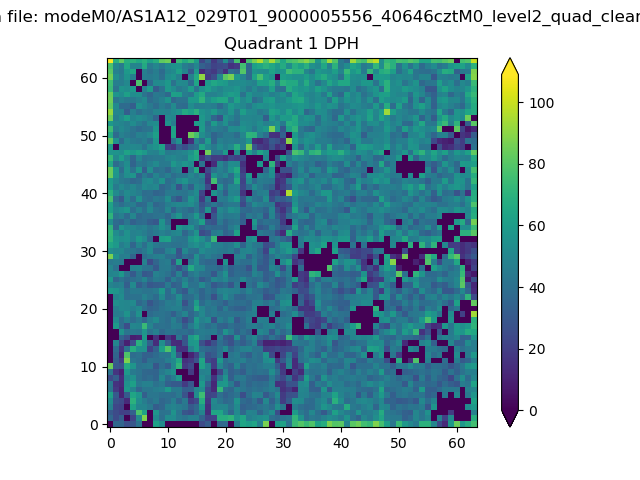 |
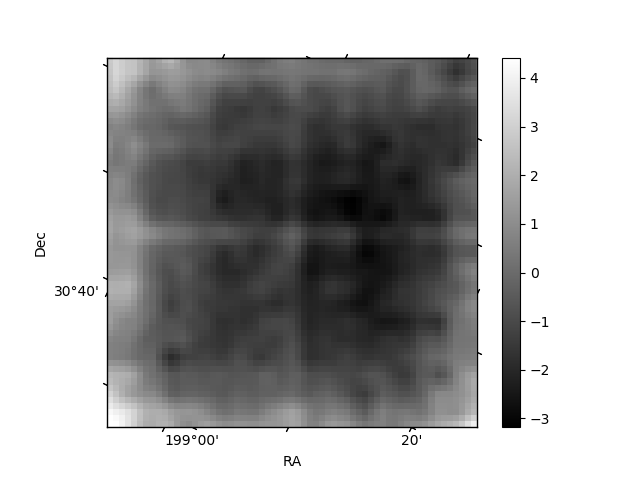
Quadrant B |
|---|---|---|---|
| Quadrant D | 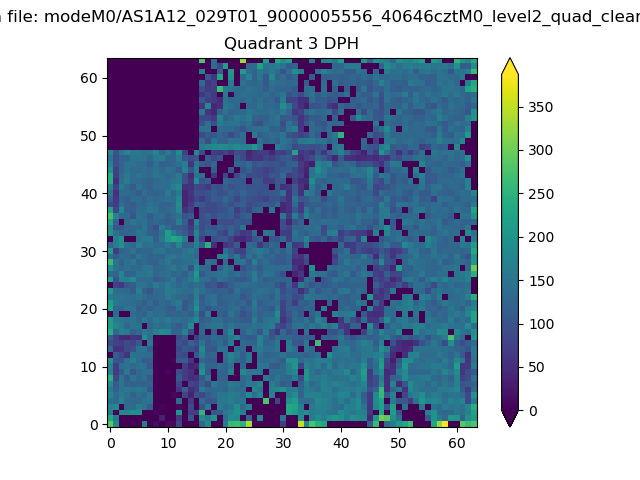 |
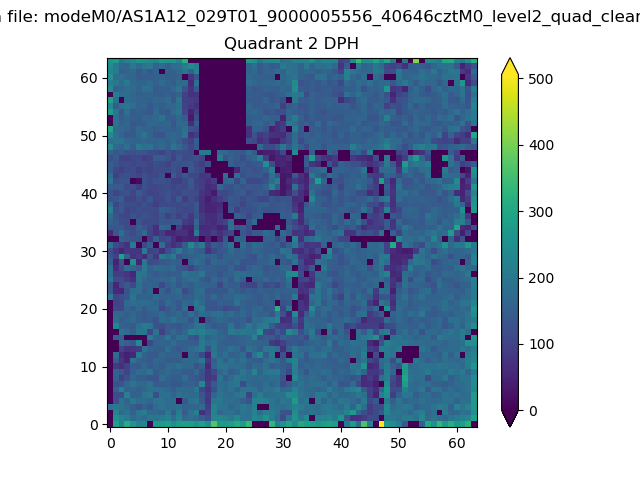 |
Quadrant C |
| Plot type | Count rate plots | Images |
|---|---|---|
| Comparison with Poisson distribution Blue bars denote a histogram of data divided into 1 sec bins. Red curve is a Poisson curve with rate = median count rate of data. |
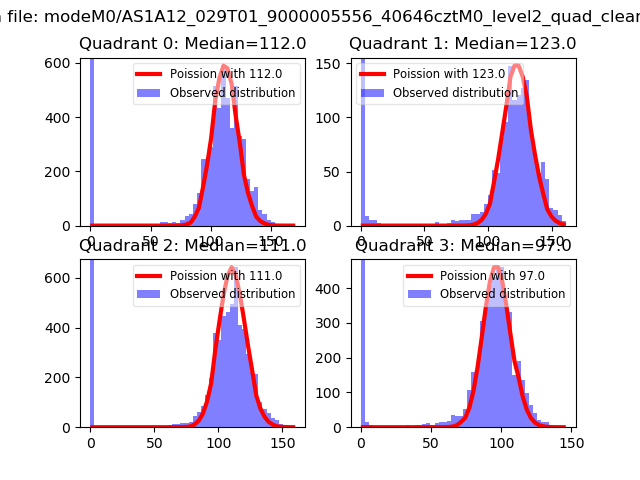 |
 |
| Quadrant-wise count rates Data is divided into 100 sec bins |
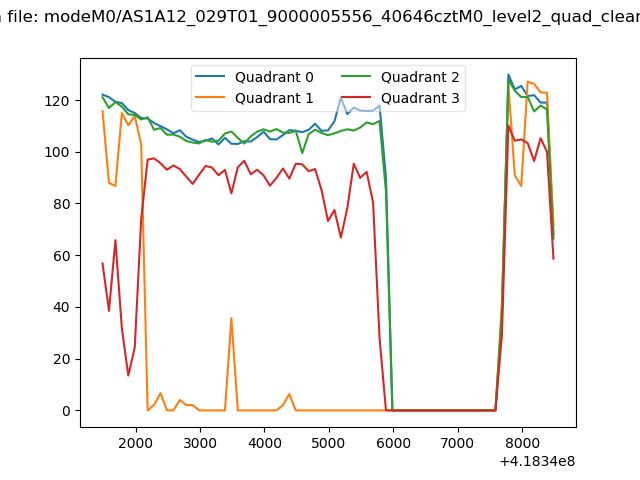 |
|
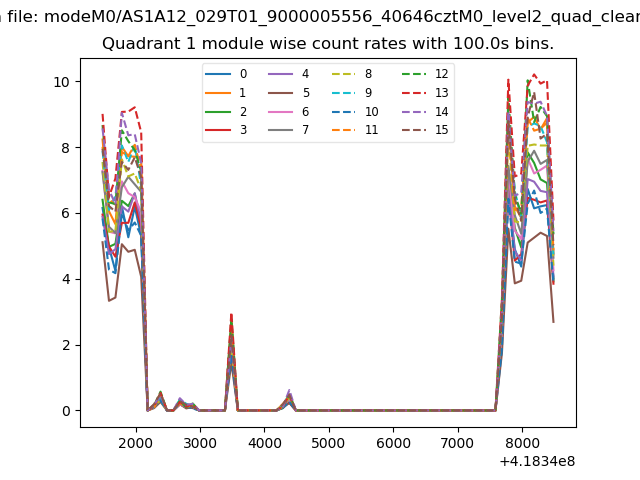
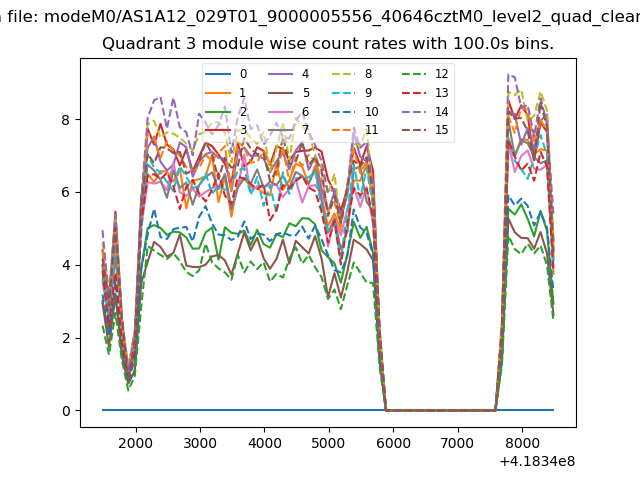
| Module-wise count rates for Quadrant A Data is divided into 100 sec bins |
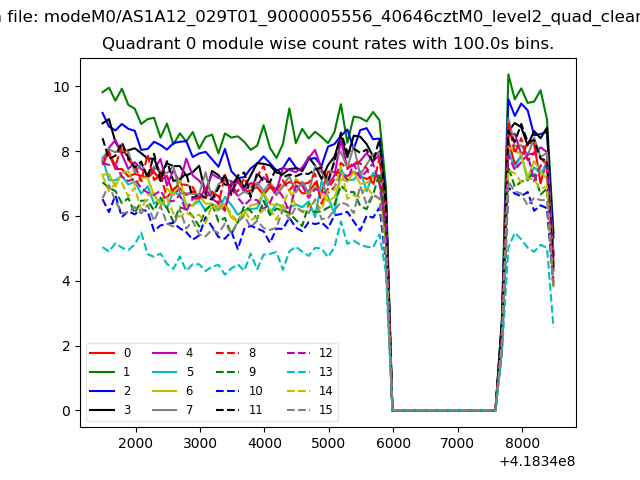 |
 |
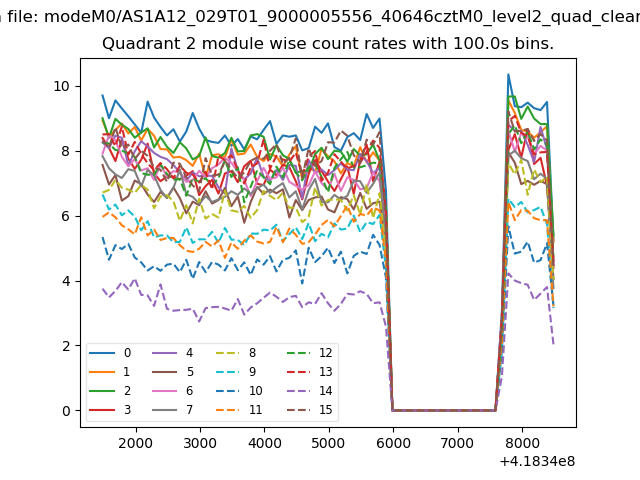
| Module-wise count rates for Quadrant B Data is divided into 100 sec bins |
 |
 |
| Module-wise count rates for Quadrant C Data is divided into 100 sec bins |
 |
 |
| Module-wise count rates for Quadrant D Data is divided into 100 sec bins |
 |
 |
| Parameter | Plot |
|---|---|
| CZT HV Monitor | 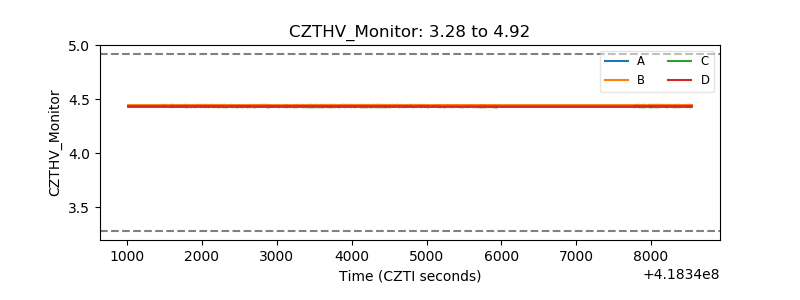 |
| D_VDD | 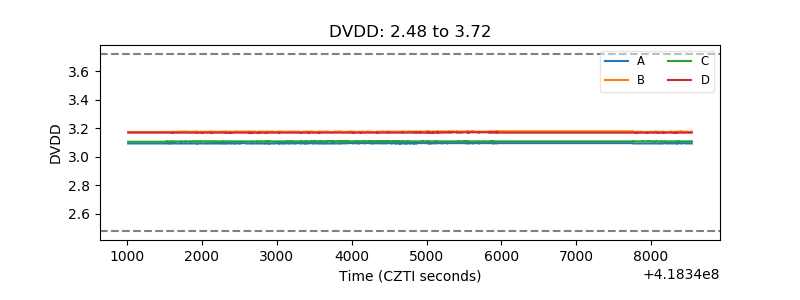 |
| Temperature 1 | 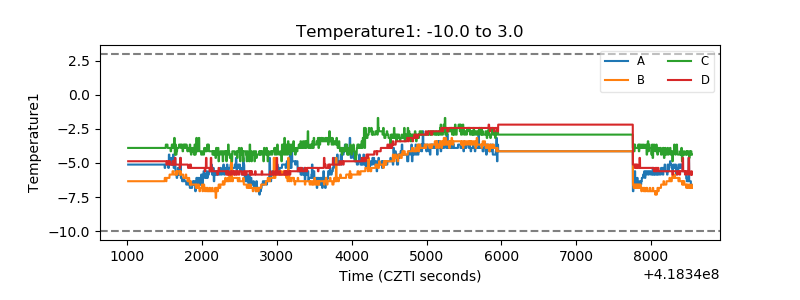 |
| Veto HV Monitor | 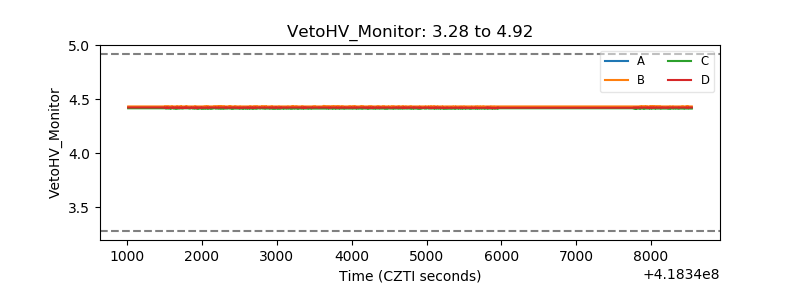 |
| Veto LLD | 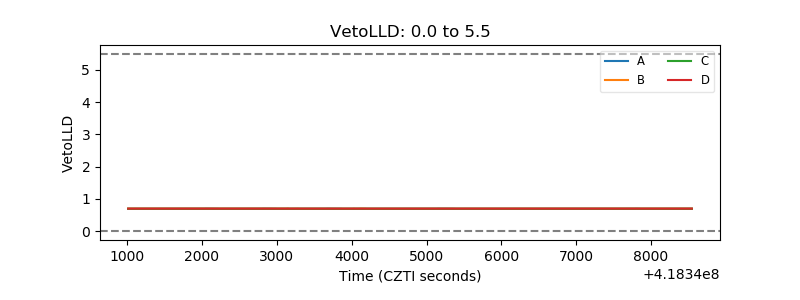 |
| Alpha Counter | 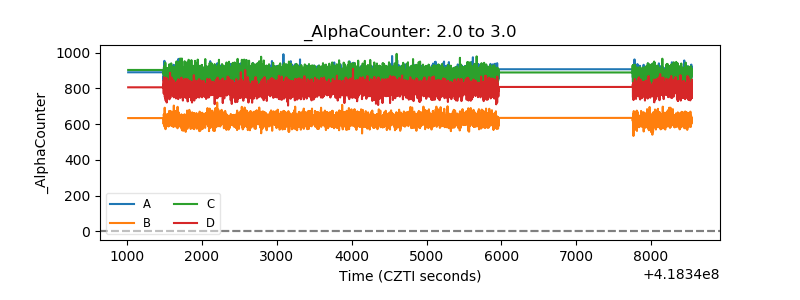 |
| _CPM_Rate | 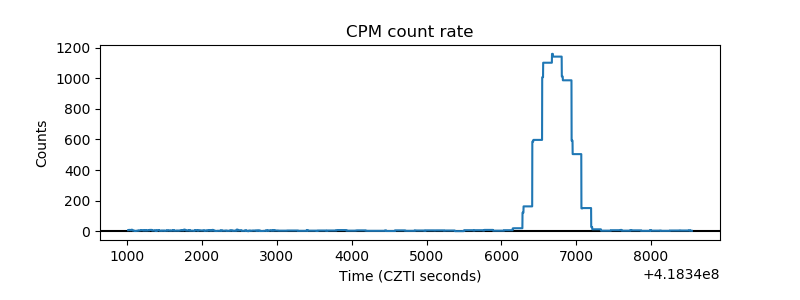 |
| CZT Counter | 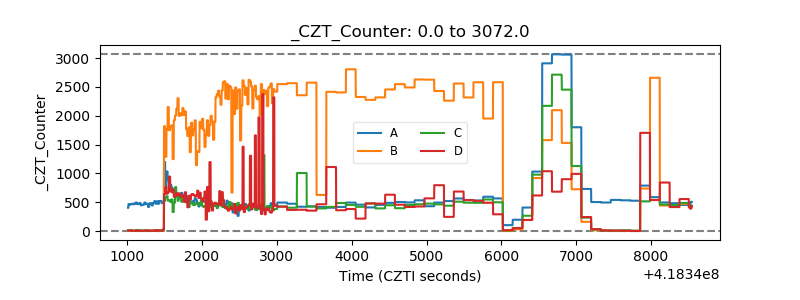 |
| +2.5 Volts monitor | 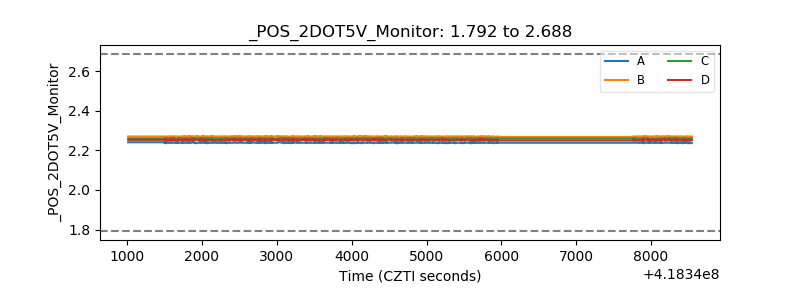 |
| +5 Volts monitor | 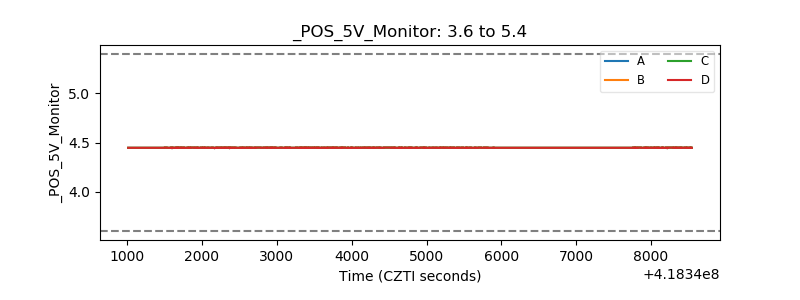 |
| _ROLL_ROT | 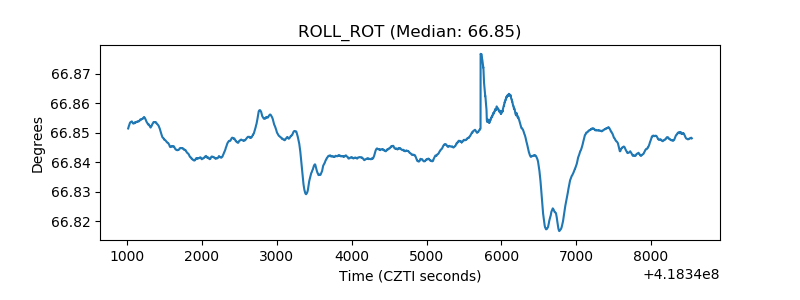 |
| _Roll_DEC | 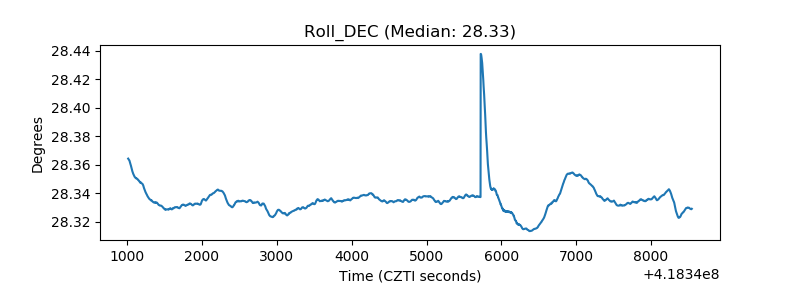 |
| _Roll_RA | 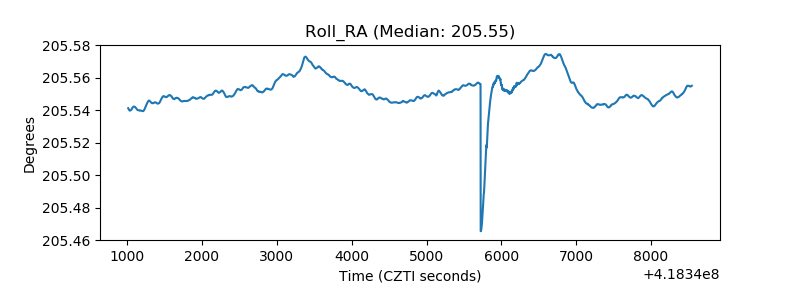 |
| Veto Counter | 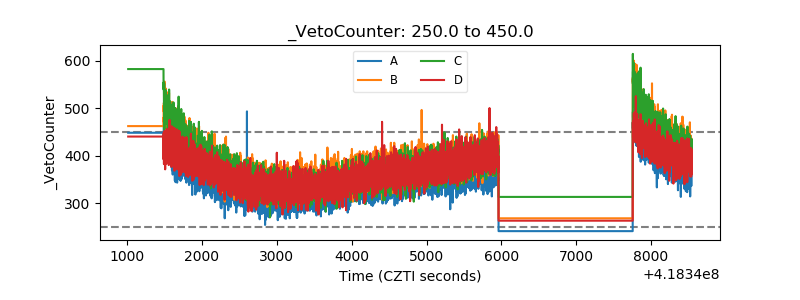 |