| Param | Original file | Final file |
|---|---|---|
| Filename | modeM0/AS1A12_029T01_9000005556_40647cztM0_level2.fits | modeM0/AS1A12_029T01_9000005556_40647cztM0_level2_quad_clean.evt |
| Size (bytes) | 387,210,240 | 83,868,480 |
| Size | 369.3 MB | 80.0 MB |
| Events in quadrant A | 2,715,444 | 598,960 |
| Events in quadrant B | 5,029,046 | 499,554 |
| Events in quadrant C | 2,556,372 | 587,003 |
| Events in quadrant D | 3,629,857 | 492,362 |
| Mode M0 | |||
|---|---|---|---|
| Quadrant | BADHDUFLAG | Total packets | Discarded packets |
| A | 0 | 11155 | 3 |
| B | 0 | 18377 | 2 |
| C | 0 | 10801 | 2 |
| D | 0 | 14380 | 2 |
| Mode M9 | |||
|---|---|---|---|
| Quadrant | BADHDUFLAG | Total packets | Discarded packets |
| A | 0 | 29 | 0 |
| B | 0 | 29 | 0 |
| C | 0 | 29 | 0 |
| D | 0 | 30 | 0 |
| Mode SS | |||
|---|---|---|---|
| Quadrant | BADHDUFLAG | Total packets | Discarded packets |
| A | 0 | 104 | 0 |
| B | 0 | 104 | 0 |
| C | 0 | 104 | 0 |
| D | 0 | 104 | 0 |
| Quadrant | Total seconds | Saturated seconds | Saturation percentage |
|---|---|---|---|
| A | 5164 | 8 | 0.154919% |
| B | 5164 | 991 | 19.190550% |
| C | 5164 | 14 | 0.271108% |
| D | 5164 | 517 | 10.011619% |
Noise dominated data is calculated using 1-second bins in cleaned event files. If a bin has >2000 counts, and if more than 50% of those come from <1% of pixels, then it is considered to be noise-dominated and hence unusable.
| Quadrant | # 1 sec bins | Bins with >0 counts | Bins with >2000 counts | High rate bins dominated by noise | Noise dominated (total time) | Noise dominated (detector-on time) | Marked lightcurve |
|---|---|---|---|---|---|---|---|
| A | 7107 | 5165 | 4 | 4 | 0.06% | 0.08% | 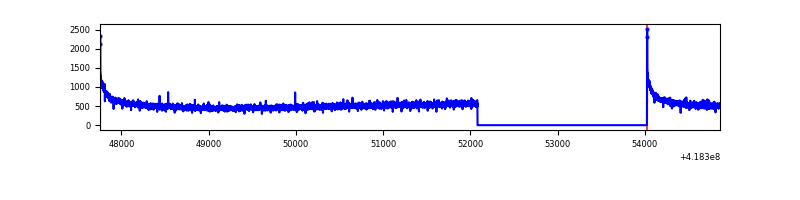 |
| B | 7106 | 5164 | 949 | 949 | 13.35% | 18.38% | 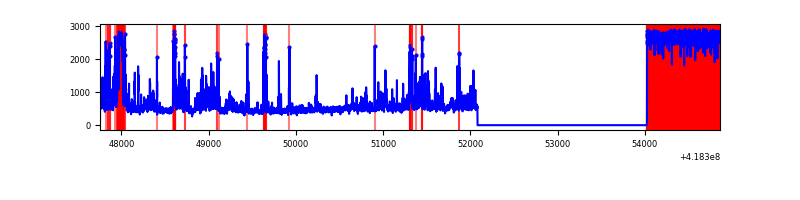 |
| C | 7107 | 5165 | 13 | 13 | 0.18% | 0.25% | 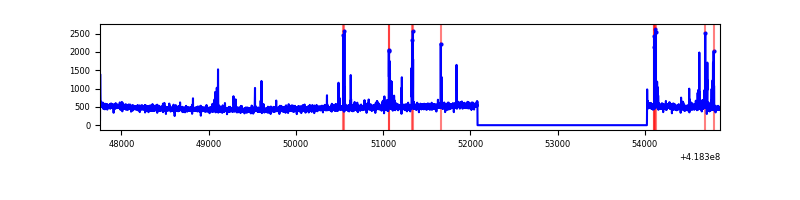 |
| D | 7107 | 5165 | 182 | 182 | 2.56% | 3.52% | 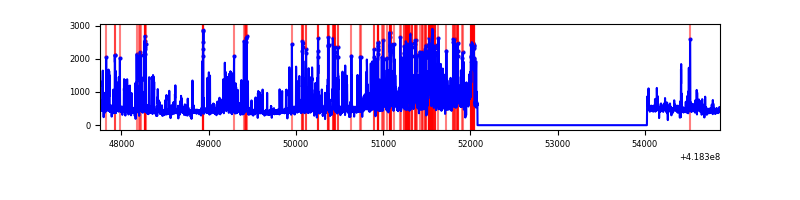 |
Top three noisy pixels from each quadrant. If the there are fewer than three noisy pixels in the level2.evt file, extra rows are filled as -1
| Pixel properties | Quadrant properties | ||||||
|---|---|---|---|---|---|---|---|
| Quadrant | DetID | PixID | Counts | Sigma | Mean | Median | Sigma |
| A | 10 | 83 | 453615 | 3854.89 | 579 | 570 | 117.5 |
| A | 13 | 252 | 15543 | 127.4 | 579 | 570 | 117.5 |
| A | 13 | 6 | 8447 | 67.02 | 579 | 570 | 117.5 |
| B | 7 | 202 | 2155796 | 22253.16 | 499 | 485 | 96.9 |
| B | 0 | 229 | 419956 | 4330.96 | 499 | 485 | 96.9 |
| B | 0 | 190 | 364106 | 3754.32 | 499 | 485 | 96.9 |
| C | 15 | 214 | 226460 | 1736.82 | 560 | 565 | 130.1 |
| C | 14 | 254 | 130082 | 995.81 | 560 | 565 | 130.1 |
| C | 0 | 10 | 4667 | 31.54 | 560 | 565 | 130.1 |
| D | 12 | 227 | 1134039 | 8719.68 | 530 | 516 | 130.0 |
| D | 12 | 191 | 125051 | 957.99 | 530 | 516 | 130.0 |
| D | 13 | 249 | 95221 | 728.52 | 530 | 516 | 130.0 |
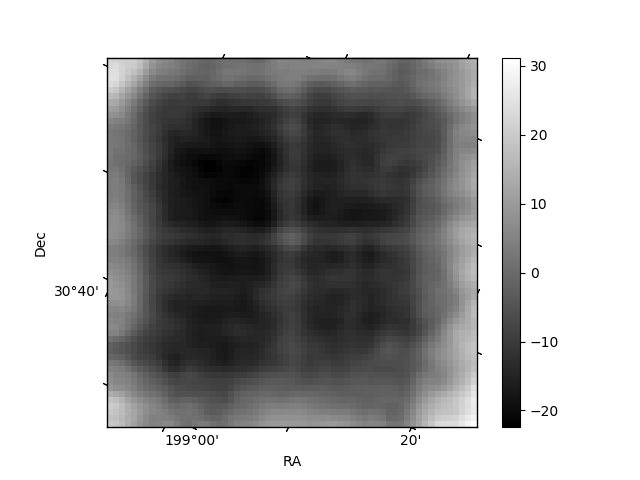
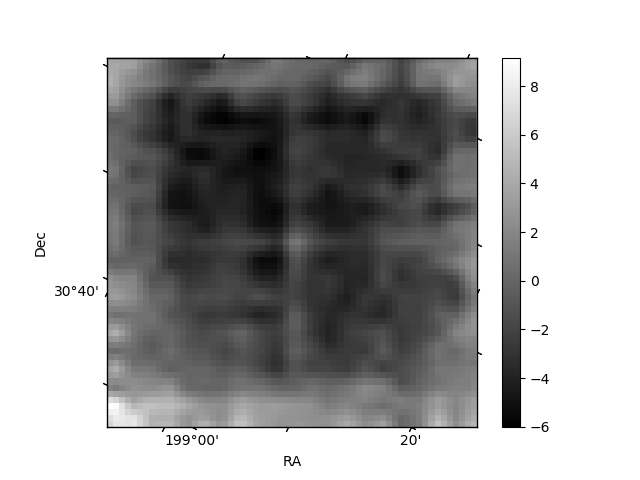
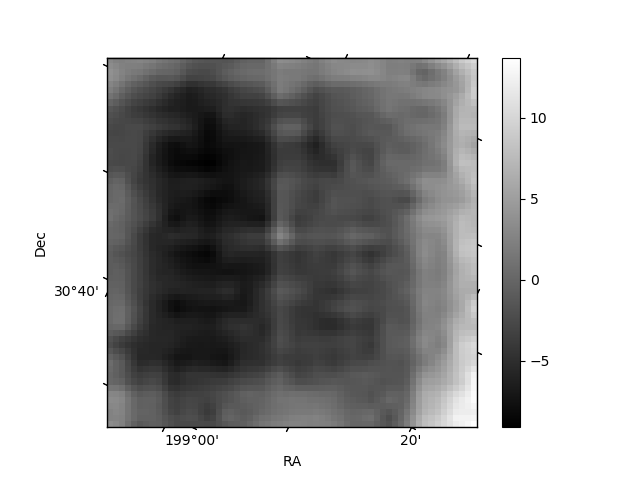
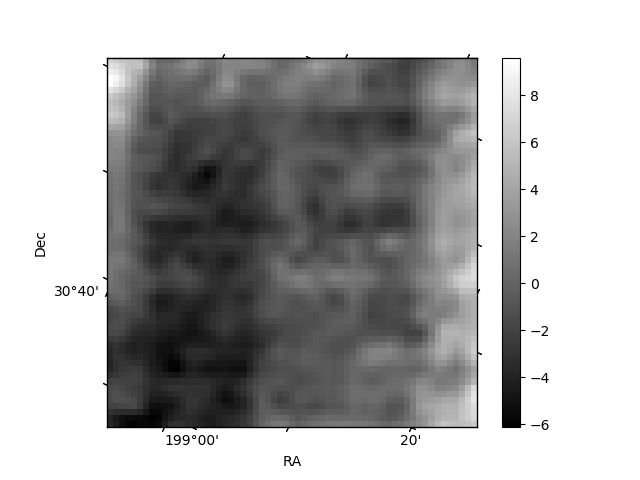
Histogram calculated using DETX and DETY for each event in the final _common_clean file
| Quadrant A | 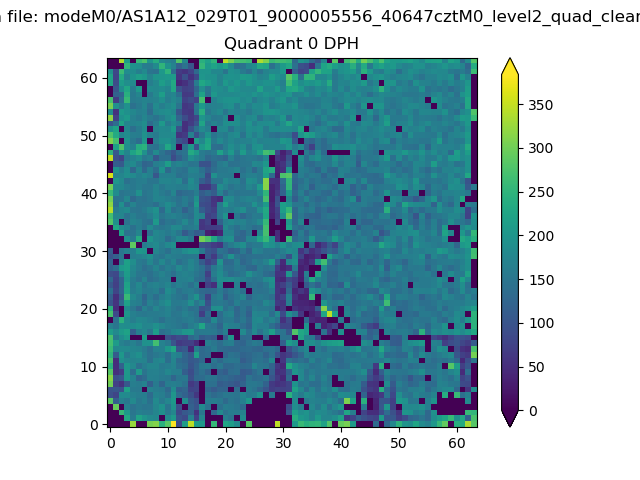 |
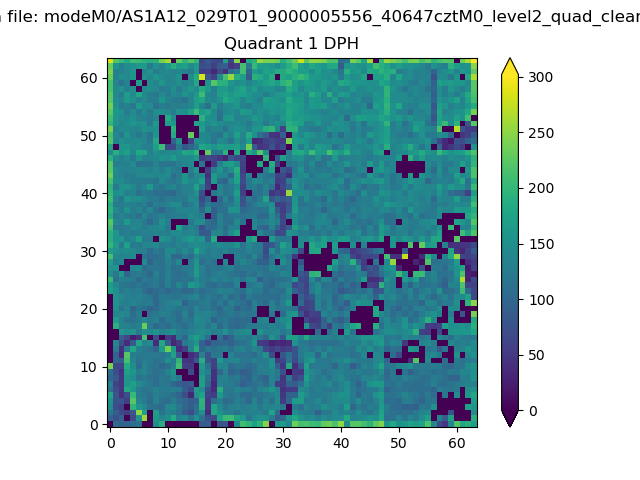 |
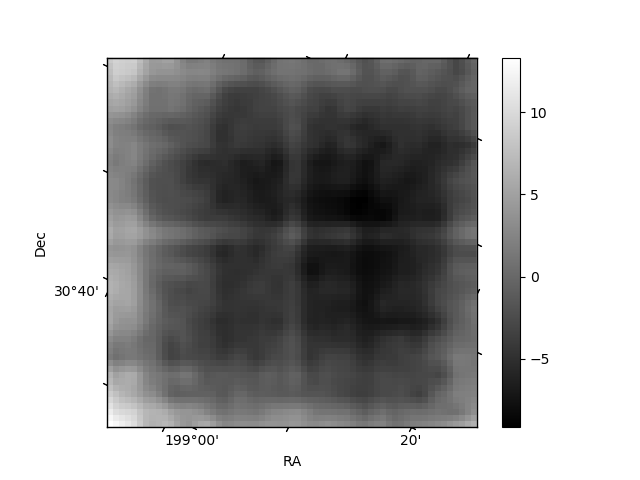
Quadrant B |
|---|---|---|---|
| Quadrant D | 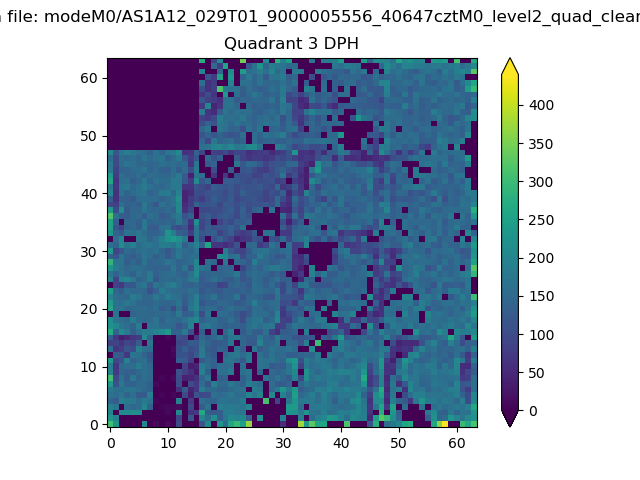 |
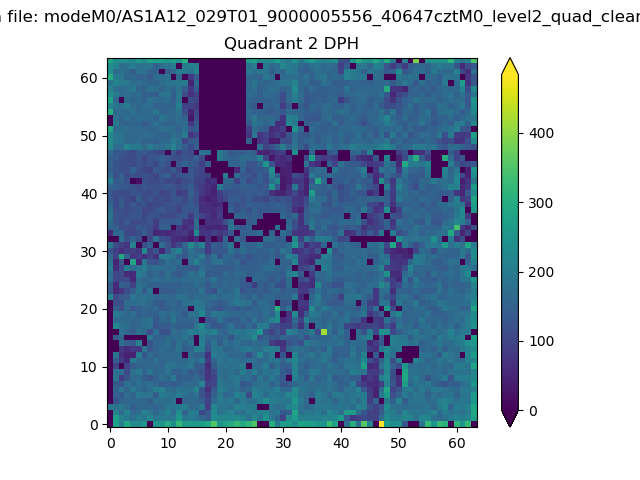 |
Quadrant C |
| Plot type | Count rate plots | Images |
|---|---|---|
| Comparison with Poisson distribution Blue bars denote a histogram of data divided into 1 sec bins. Red curve is a Poisson curve with rate = median count rate of data. |
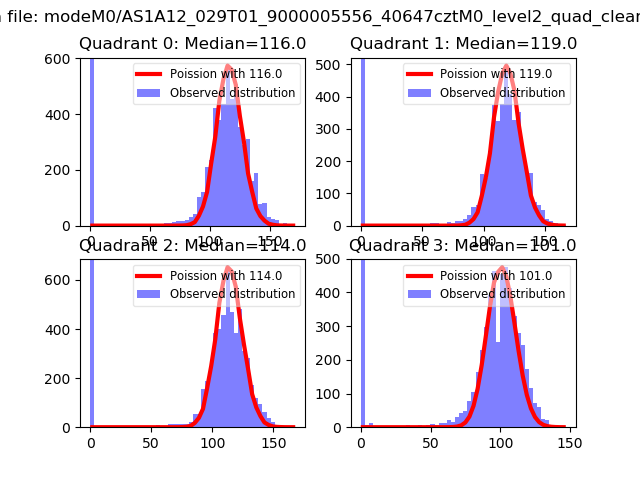 |
 |
| Quadrant-wise count rates Data is divided into 100 sec bins |
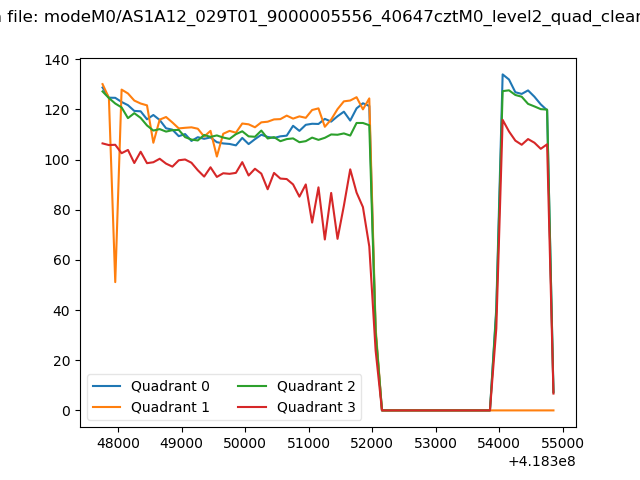 |
|
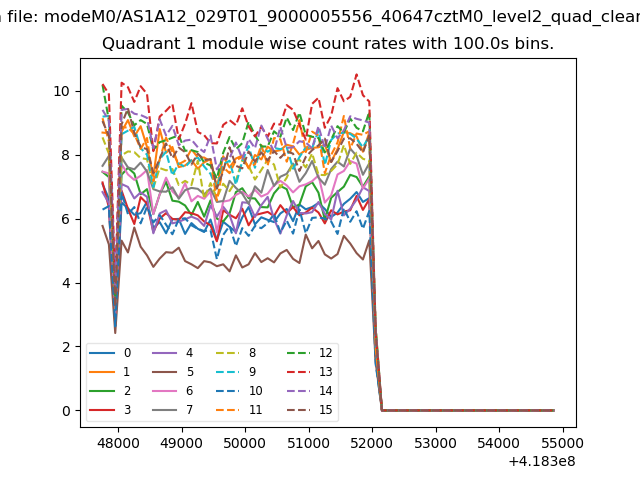
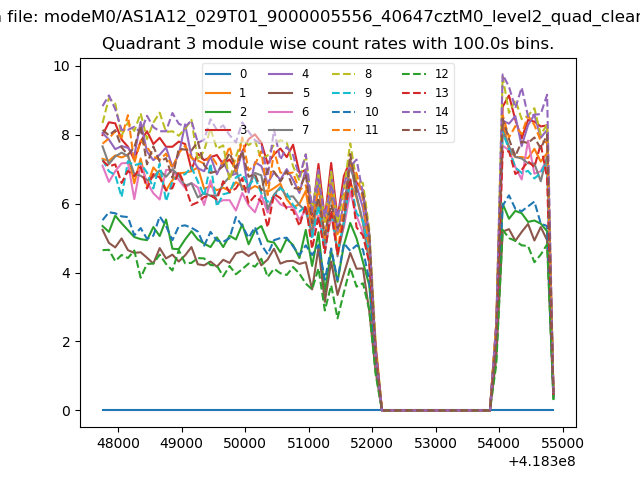
| Module-wise count rates for Quadrant A Data is divided into 100 sec bins |
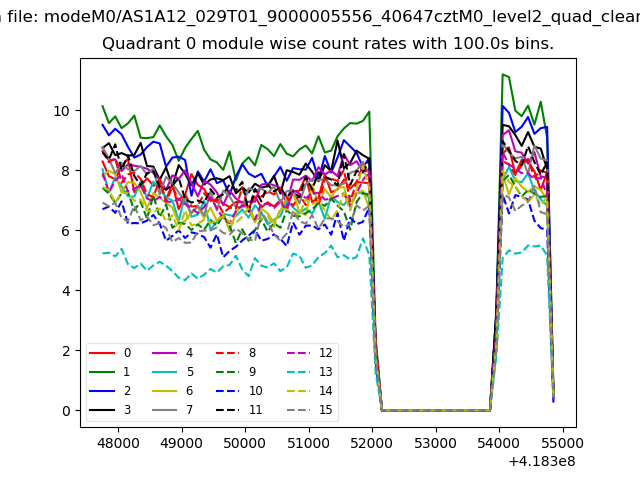 |
 |
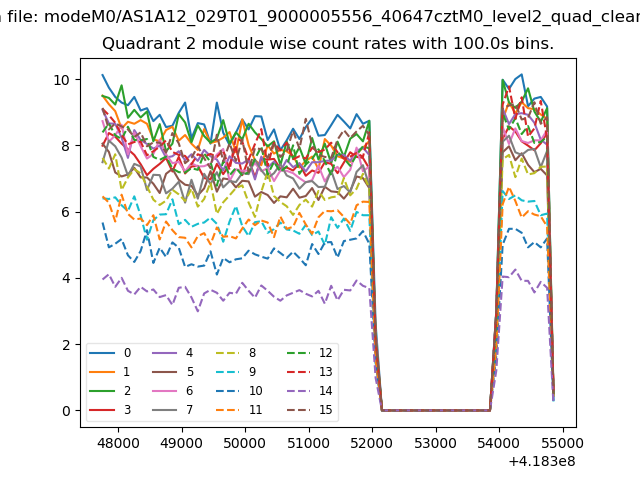
| Module-wise count rates for Quadrant B Data is divided into 100 sec bins |
 |
 |
| Module-wise count rates for Quadrant C Data is divided into 100 sec bins |
 |
 |
| Module-wise count rates for Quadrant D Data is divided into 100 sec bins |
 |
 |
| Parameter | Plot |
|---|---|
| CZT HV Monitor | 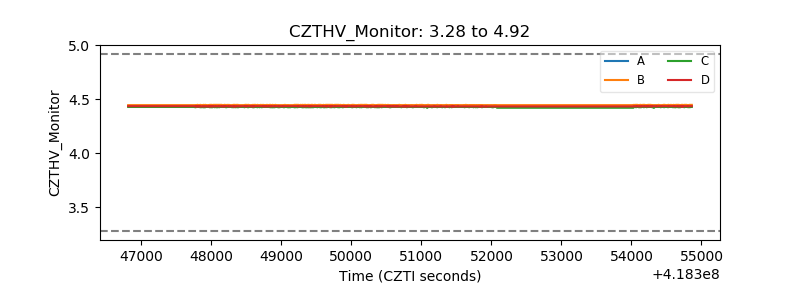 |
| D_VDD | 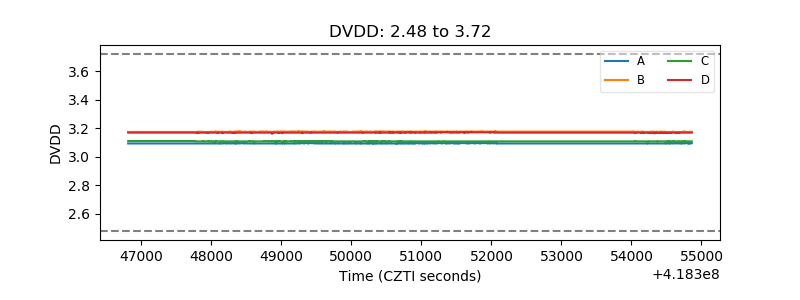 |
| Temperature 1 | 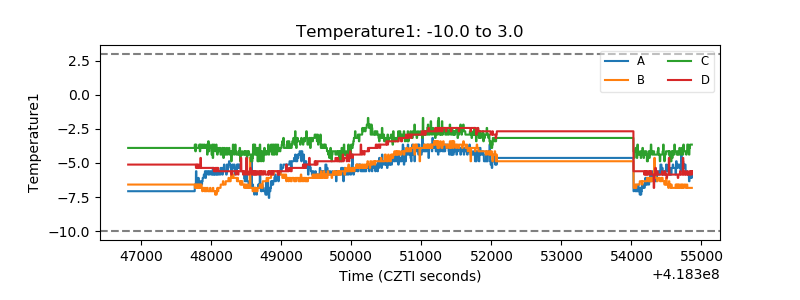 |
| Veto HV Monitor | 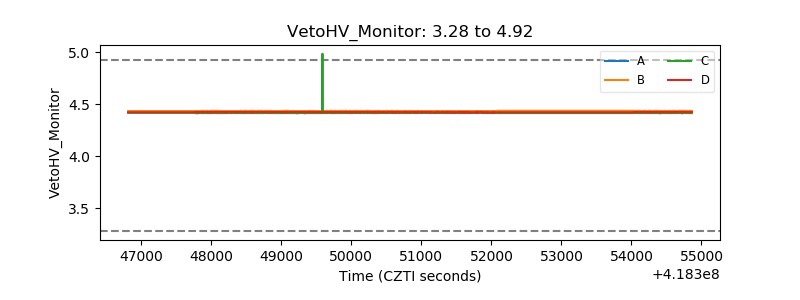 |
| Veto LLD | 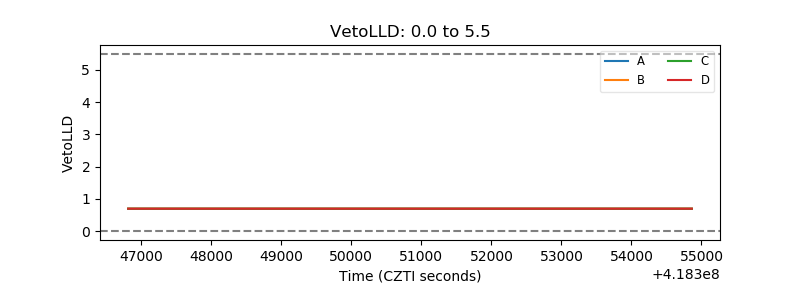 |
| Alpha Counter | 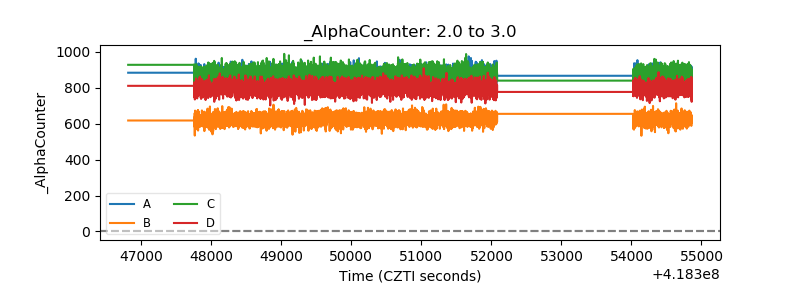 |
| _CPM_Rate | 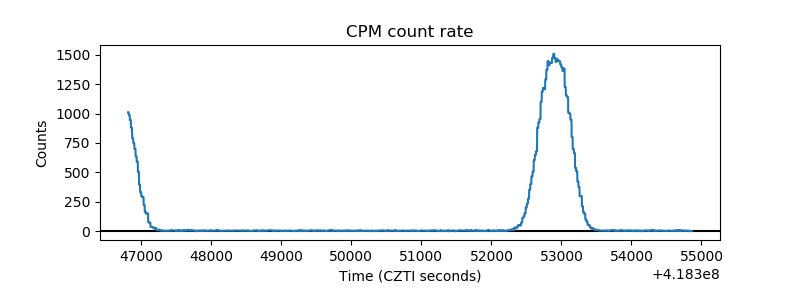 |
| CZT Counter | 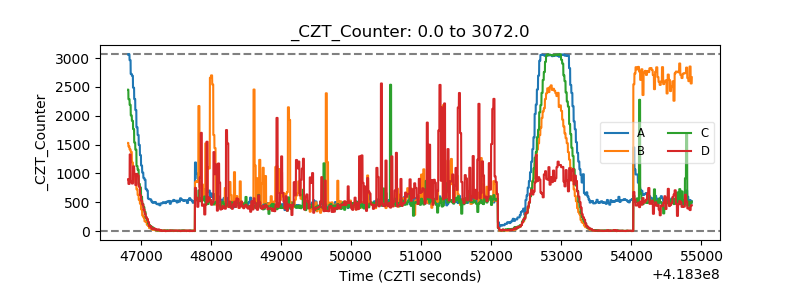 |
| +2.5 Volts monitor | 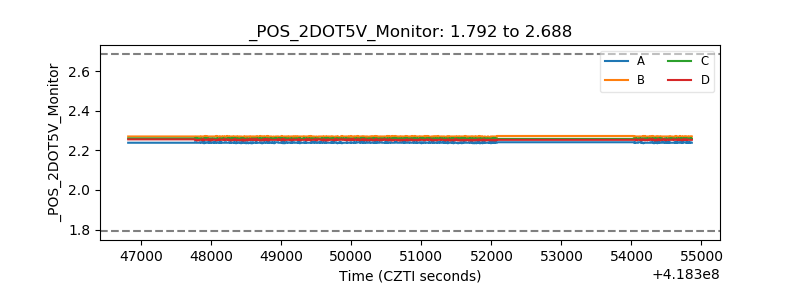 |
| +5 Volts monitor | 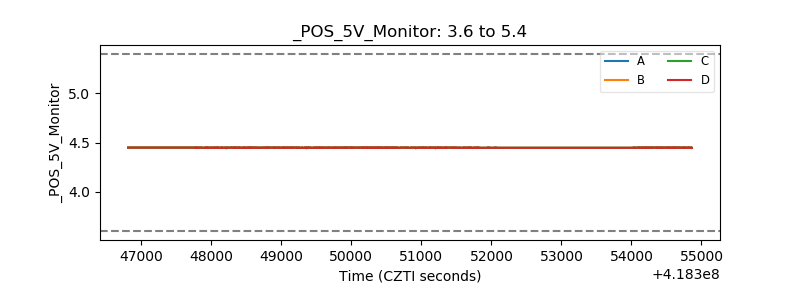 |
| _ROLL_ROT | 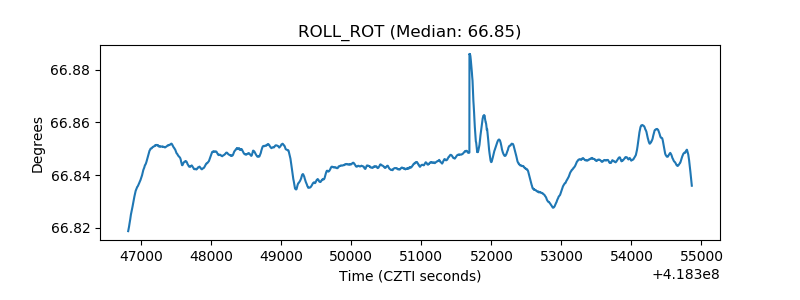 |
| _Roll_DEC | 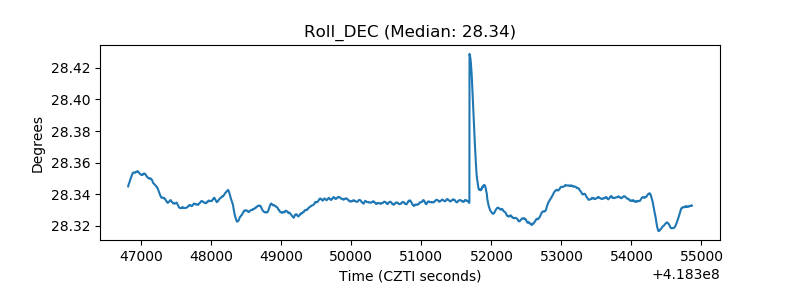 |
| _Roll_RA | 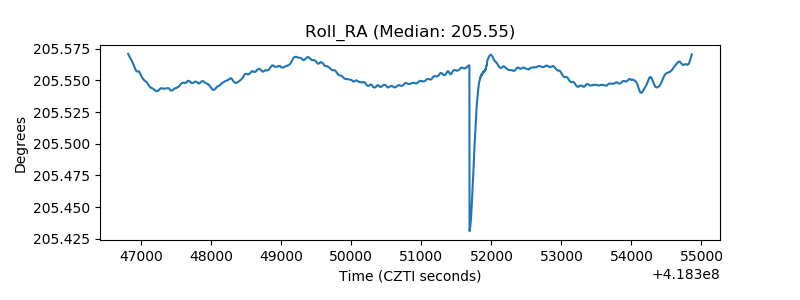 |
| Veto Counter | 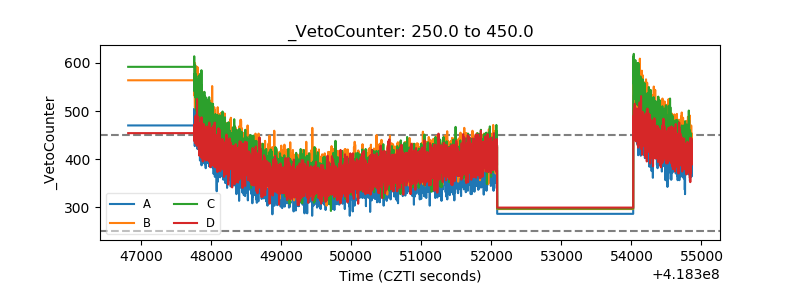 |