| Param | Original file | Final file |
|---|---|---|
| Filename | modeM0/AS1A12_029T01_9000005556_40649cztM0_level2.fits | modeM0/AS1A12_029T01_9000005556_40649cztM0_level2_quad_clean.evt |
| Size (bytes) | 551,327,040 | 68,287,680 |
| Size | 525.8 MB | 65.1 MB |
| Events in quadrant A | 2,653,875 | 584,325 |
| Events in quadrant B | 11,612,723 | 88,128 |
| Events in quadrant C | 2,568,165 | 563,859 |
| Events in quadrant D | 3,193,714 | 489,546 |
| Mode M0 | |||
|---|---|---|---|
| Quadrant | BADHDUFLAG | Total packets | Discarded packets |
| A | 0 | 10615 | 3 |
| B | 0 | 37957 | 2 |
| C | 0 | 10503 | 2 |
| D | 0 | 12911 | 2 |
| Mode M9 | |||
|---|---|---|---|
| Quadrant | BADHDUFLAG | Total packets | Discarded packets |
| A | 0 | 32 | 0 |
| B | 0 | 32 | 0 |
| C | 0 | 32 | 0 |
| D | 0 | 33 | 0 |
| Mode SS | |||
|---|---|---|---|
| Quadrant | BADHDUFLAG | Total packets | Discarded packets |
| A | 0 | 100 | 0 |
| B | 0 | 100 | 0 |
| C | 0 | 100 | 0 |
| D | 0 | 100 | 0 |
| Quadrant | Total seconds | Saturated seconds | Saturation percentage |
|---|---|---|---|
| A | 4872 | 18 | 0.369458% |
| B | 4872 | 4184 | 85.878489% |
| C | 4872 | 28 | 0.574713% |
| D | 4872 | 327 | 6.711823% |
Noise dominated data is calculated using 1-second bins in cleaned event files. If a bin has >2000 counts, and if more than 50% of those come from <1% of pixels, then it is considered to be noise-dominated and hence unusable.
| Quadrant | # 1 sec bins | Bins with >0 counts | Bins with >2000 counts | High rate bins dominated by noise | Noise dominated (total time) | Noise dominated (detector-on time) | Marked lightcurve |
|---|---|---|---|---|---|---|---|
| A | 6965 | 4873 | 4 | 4 | 0.06% | 0.08% | 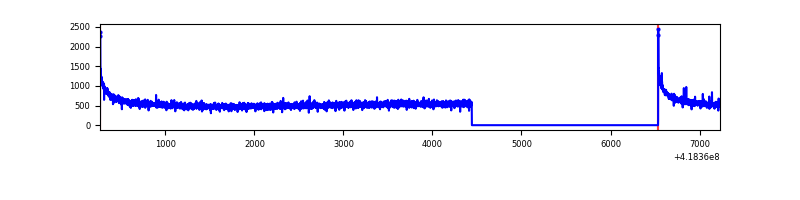 |
| B | 6965 | 4872 | 4162 | 4162 | 59.76% | 85.43% | 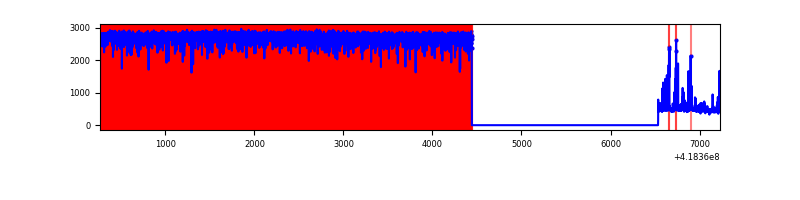 |
| C | 6965 | 4873 | 25 | 25 | 0.36% | 0.51% | 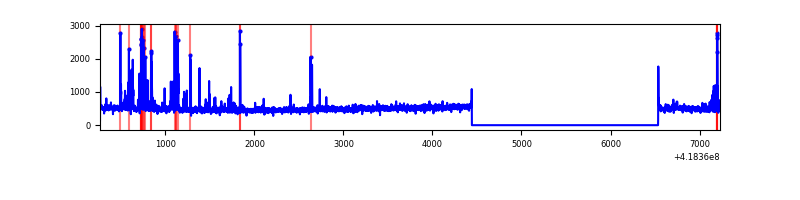 |
| D | 6965 | 4873 | 13 | 13 | 0.19% | 0.27% | 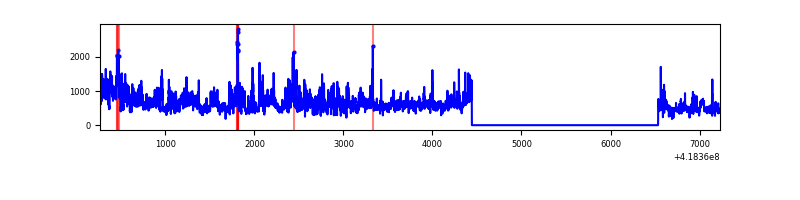 |
Top three noisy pixels from each quadrant. If the there are fewer than three noisy pixels in the level2.evt file, extra rows are filled as -1
| Pixel properties | Quadrant properties | ||||||
|---|---|---|---|---|---|---|---|
| Quadrant | DetID | PixID | Counts | Sigma | Mean | Median | Sigma |
| A | 10 | 83 | 440816 | 3803.94 | 568 | 558 | 115.7 |
| A | 15 | 191 | 10323 | 84.37 | 568 | 558 | 115.7 |
| A | 13 | 6 | 6948 | 55.21 | 568 | 558 | 115.7 |
| B | 7 | 202 | 10763303 | 317472.45 | 171 | 167 | 33.9 |
| B | 0 | 190 | 98769 | 2908.39 | 171 | 167 | 33.9 |
| B | 0 | 229 | 66971 | 1970.47 | 171 | 167 | 33.9 |
| C | 15 | 214 | 216949 | 1717.97 | 543 | 547 | 126.0 |
| C | 14 | 254 | 205019 | 1623.26 | 543 | 547 | 126.0 |
| C | 15 | 159 | 12548 | 95.27 | 543 | 547 | 126.0 |
| D | 12 | 227 | 901138 | 6913.95 | 526 | 511 | 130.3 |
| D | 12 | 191 | 140972 | 1078.29 | 526 | 511 | 130.3 |
| D | 2 | 250 | 53473 | 406.58 | 526 | 511 | 130.3 |
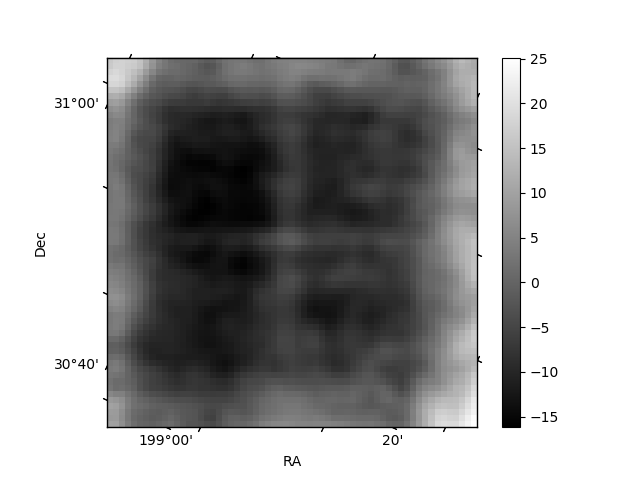
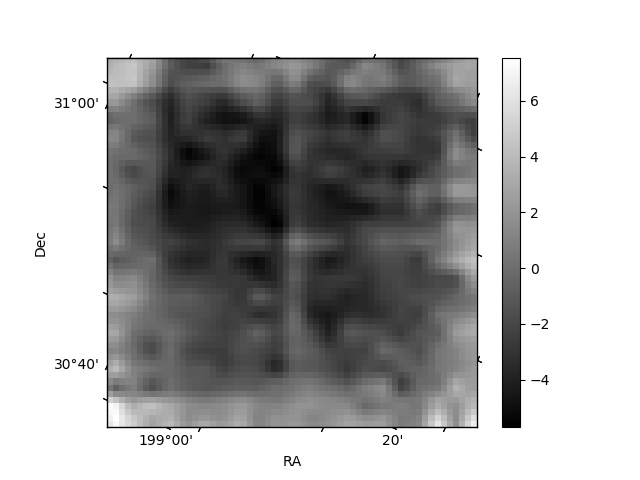
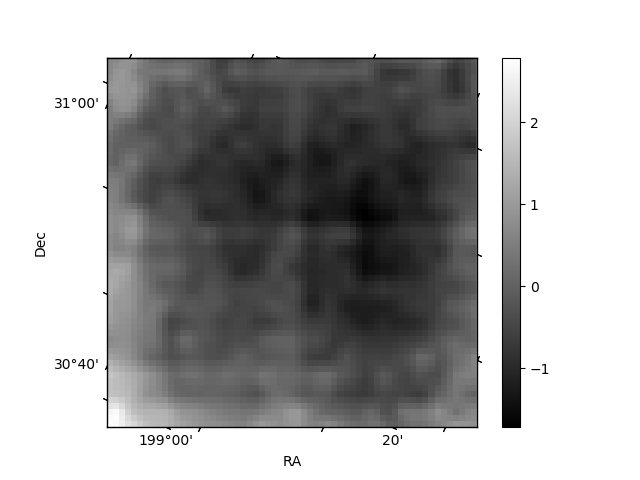
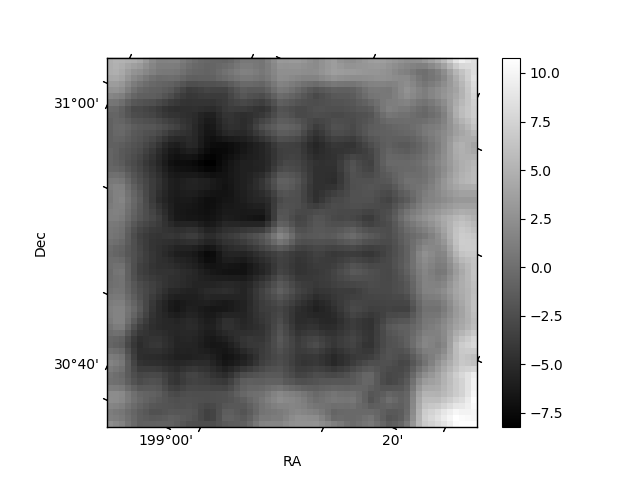
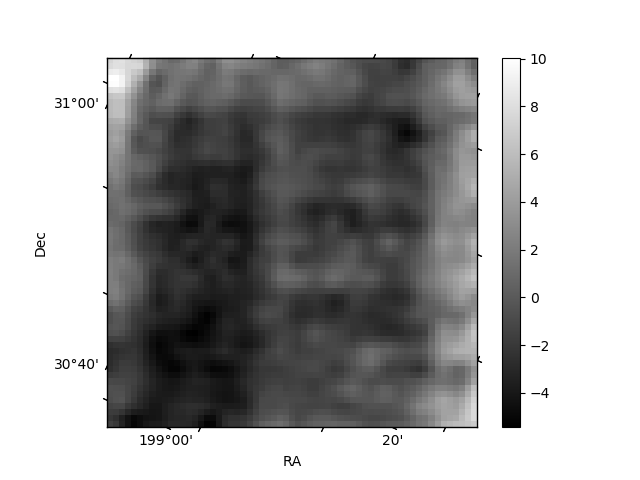
Histogram calculated using DETX and DETY for each event in the final _common_clean file
| Quadrant A | 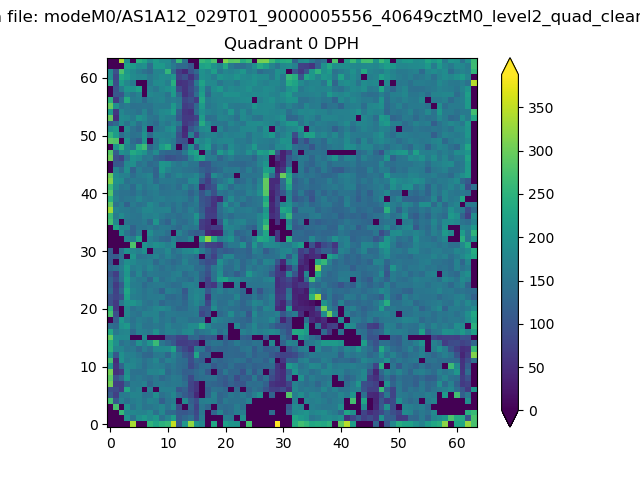 |
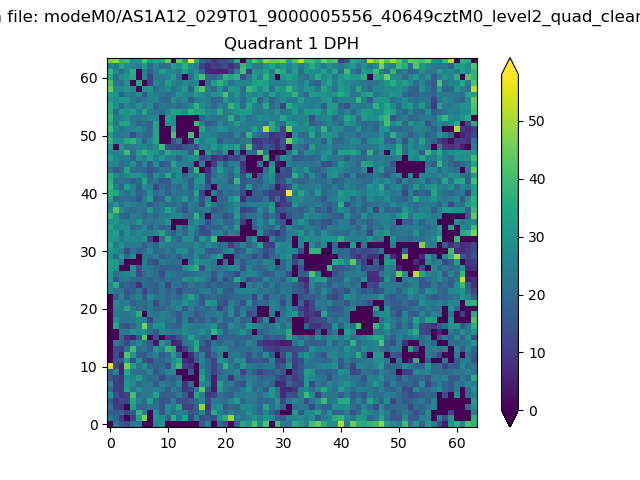 |
Quadrant B |
|---|---|---|---|
| Quadrant D | 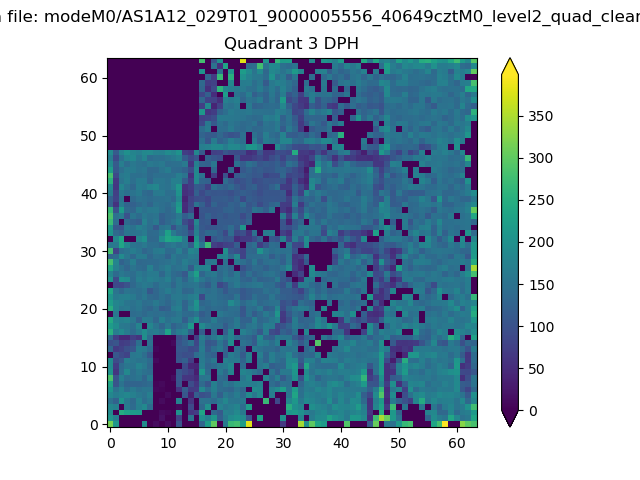 |
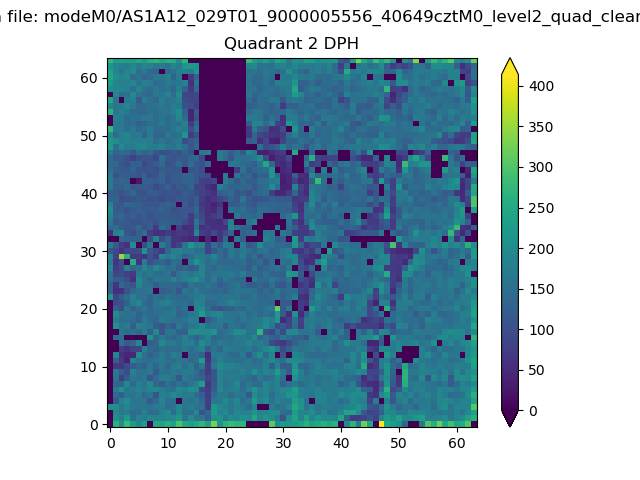 |
Quadrant C |
| Plot type | Count rate plots | Images |
|---|---|---|
| Comparison with Poisson distribution Blue bars denote a histogram of data divided into 1 sec bins. Red curve is a Poisson curve with rate = median count rate of data. |
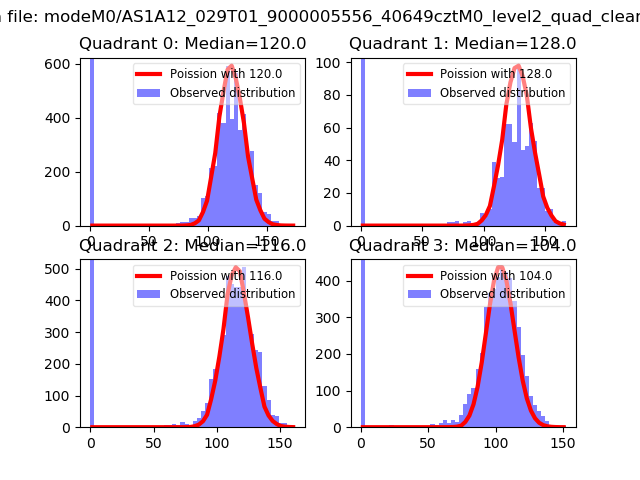 |
 |
| Quadrant-wise count rates Data is divided into 100 sec bins |
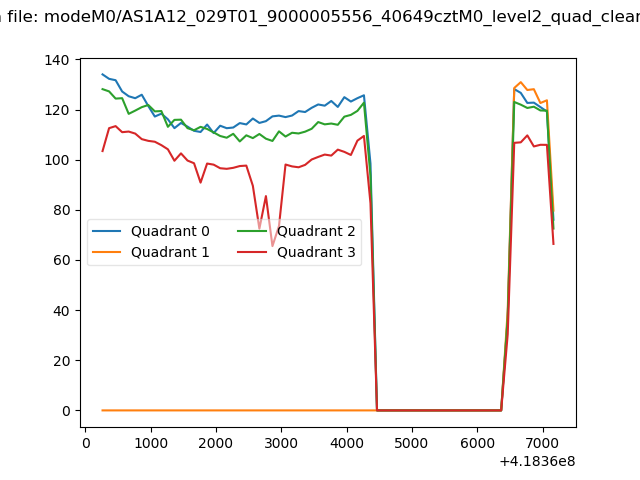 |
|
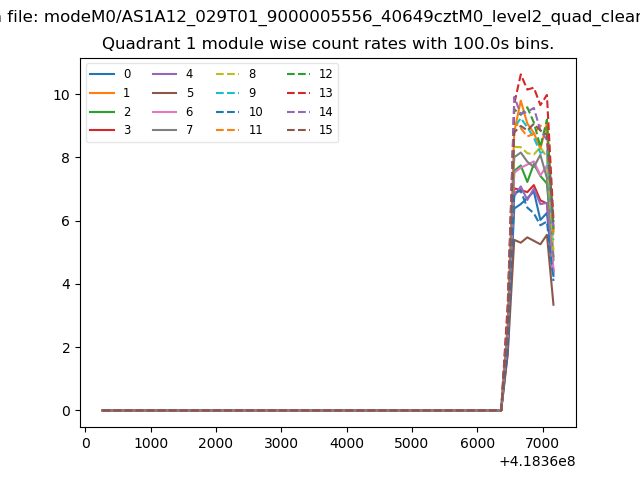
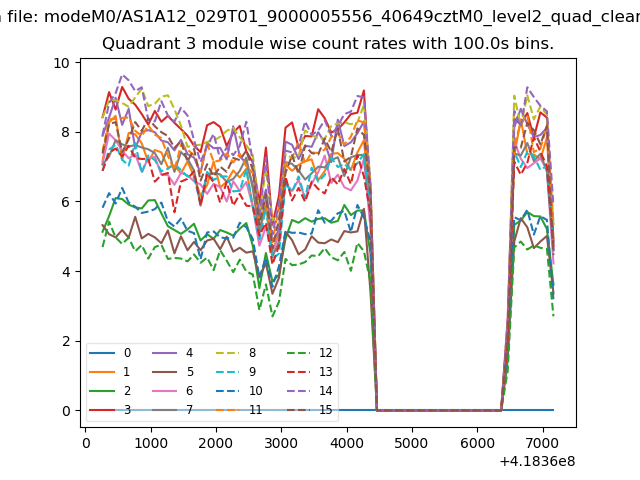
| Module-wise count rates for Quadrant A Data is divided into 100 sec bins |
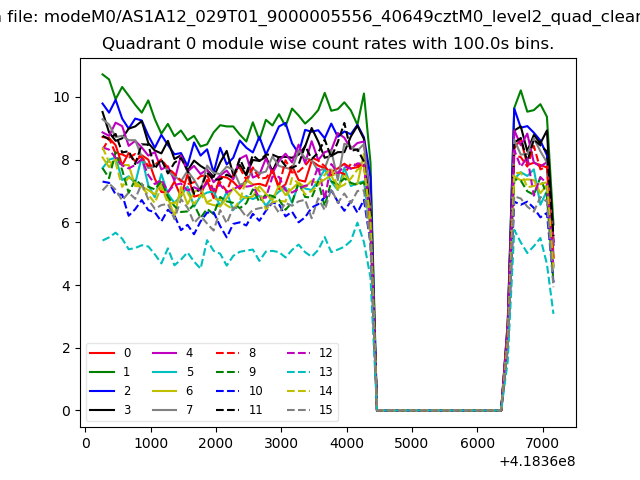 |
 |
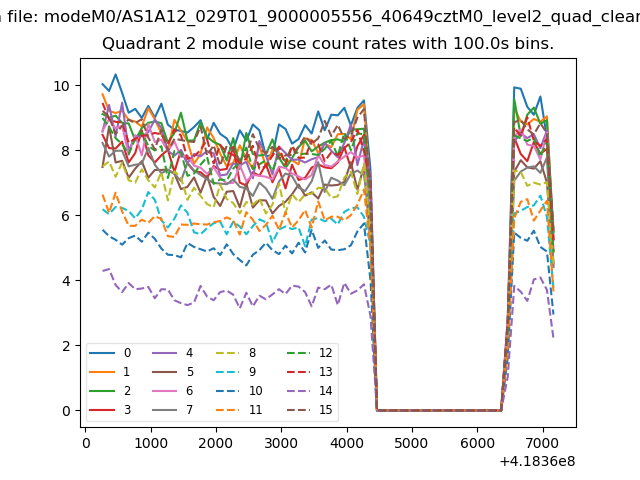
| Module-wise count rates for Quadrant B Data is divided into 100 sec bins |
 |
 |
| Module-wise count rates for Quadrant C Data is divided into 100 sec bins |
 |
 |
| Module-wise count rates for Quadrant D Data is divided into 100 sec bins |
 |
 |
| Parameter | Plot |
|---|---|
| CZT HV Monitor | 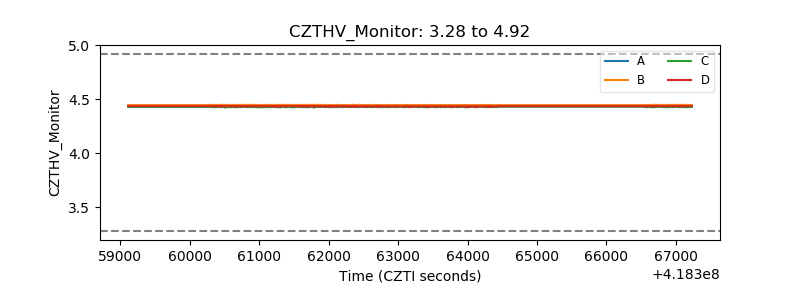 |
| D_VDD | 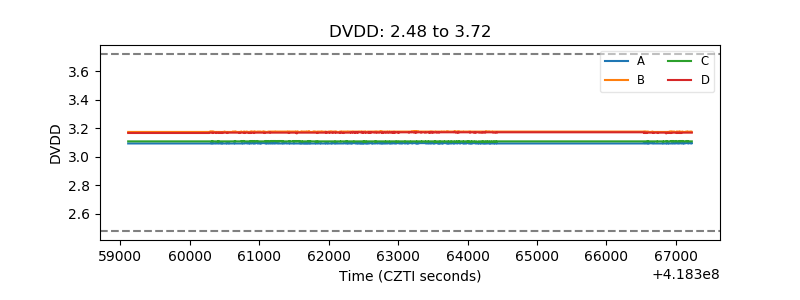 |
| Temperature 1 | 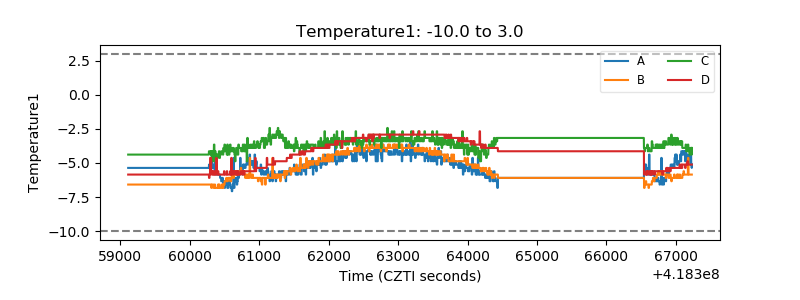 |
| Veto HV Monitor | 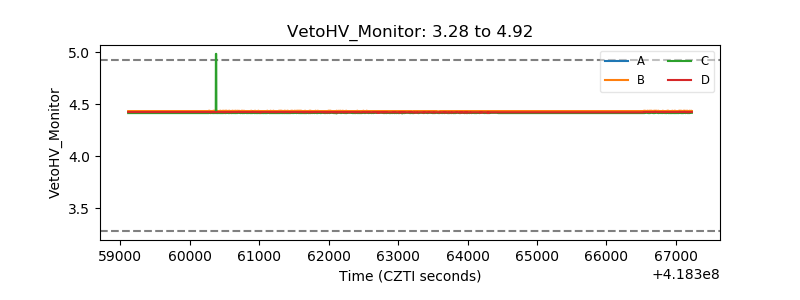 |
| Veto LLD | 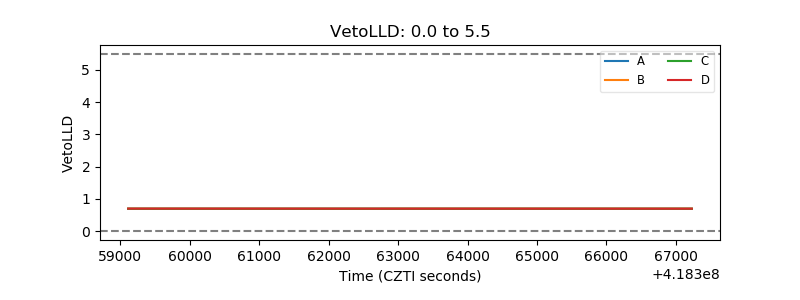 |
| Alpha Counter | 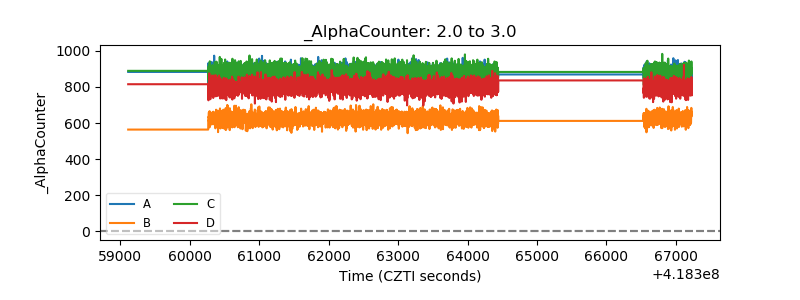 |
| _CPM_Rate | 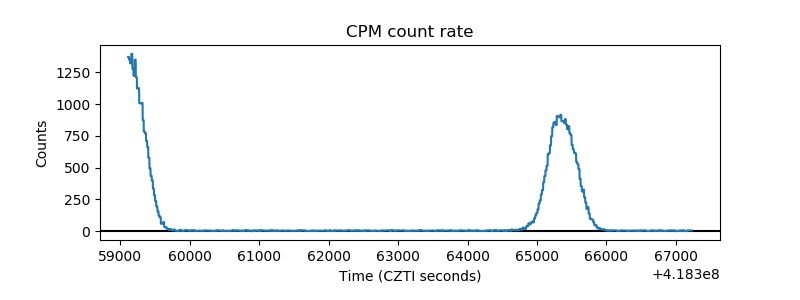 |
| CZT Counter | 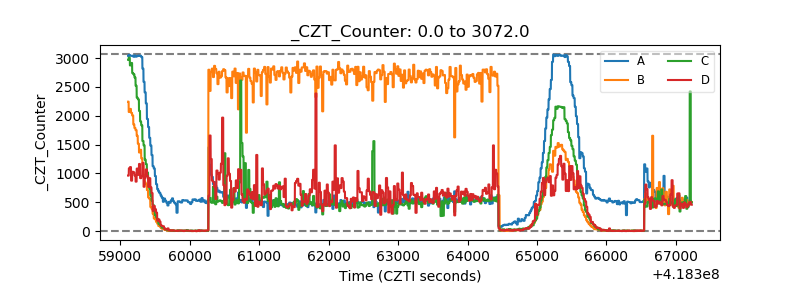 |
| +2.5 Volts monitor | 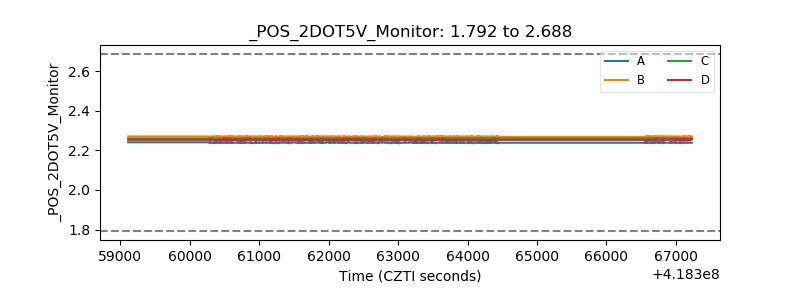 |
| +5 Volts monitor | 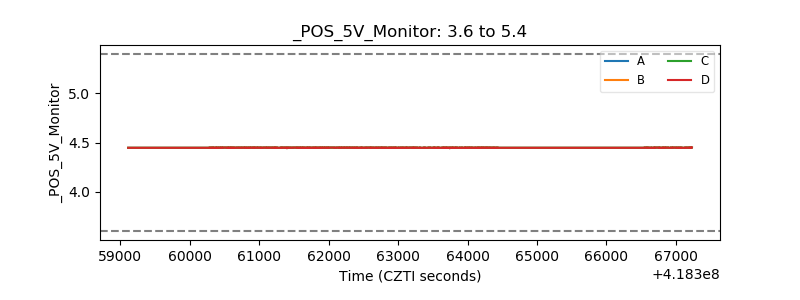 |
| _ROLL_ROT | 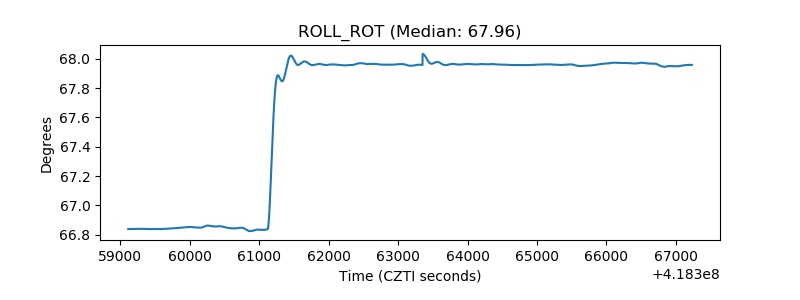 |
| _Roll_DEC | 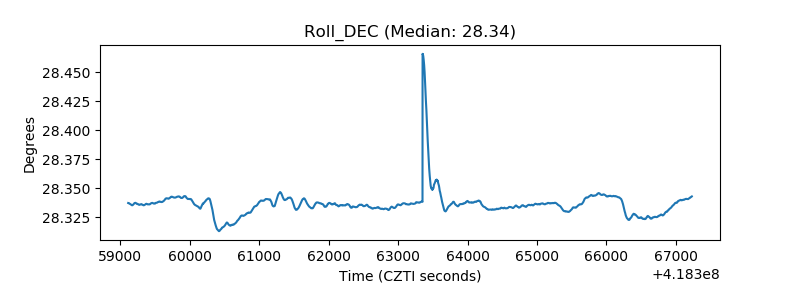 |
| _Roll_RA | 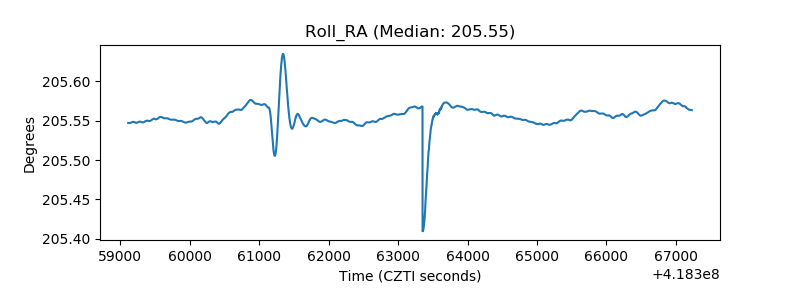 |
| Veto Counter | 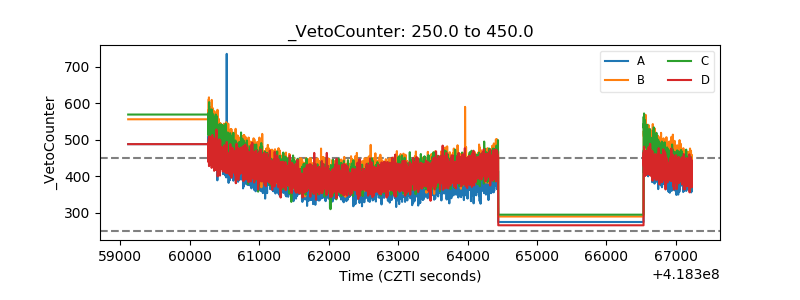 |