| Param | Original file | Final file |
|---|---|---|
| Filename | modeM0/AS1A12_029T01_9000005556_40650cztM0_level2.fits | modeM0/AS1A12_029T01_9000005556_40650cztM0_level2_quad_clean.evt |
| Size (bytes) | 340,513,920 | 86,100,480 |
| Size | 324.7 MB | 82.1 MB |
| Events in quadrant A | 2,747,018 | 590,668 |
| Events in quadrant B | 2,933,204 | 607,621 |
| Events in quadrant C | 2,727,404 | 568,372 |
| Events in quadrant D | 3,802,422 | 485,203 |
| Mode M0 | |||
|---|---|---|---|
| Quadrant | BADHDUFLAG | Total packets | Discarded packets |
| A | 0 | 10997 | 3 |
| B | 0 | 11932 | 2 |
| C | 0 | 11118 | 2 |
| D | 0 | 14785 | 2 |
| Mode M9 | |||
|---|---|---|---|
| Quadrant | BADHDUFLAG | Total packets | Discarded packets |
| A | 0 | 23 | 0 |
| B | 0 | 23 | 0 |
| C | 0 | 23 | 0 |
| D | 0 | 24 | 0 |
| Mode SS | |||
|---|---|---|---|
| Quadrant | BADHDUFLAG | Total packets | Discarded packets |
| A | 0 | 104 | 0 |
| B | 0 | 104 | 0 |
| C | 0 | 104 | 0 |
| D | 0 | 104 | 0 |
| Quadrant | Total seconds | Saturated seconds | Saturation percentage |
|---|---|---|---|
| A | 5067 | 13 | 0.256562% |
| B | 5067 | 87 | 1.716992% |
| C | 5067 | 68 | 1.342017% |
| D | 5067 | 484 | 9.552003% |
Noise dominated data is calculated using 1-second bins in cleaned event files. If a bin has >2000 counts, and if more than 50% of those come from <1% of pixels, then it is considered to be noise-dominated and hence unusable.
| Quadrant | # 1 sec bins | Bins with >0 counts | Bins with >2000 counts | High rate bins dominated by noise | Noise dominated (total time) | Noise dominated (detector-on time) | Marked lightcurve |
|---|---|---|---|---|---|---|---|
| A | 7190 | 5068 | 4 | 4 | 0.06% | 0.08% | 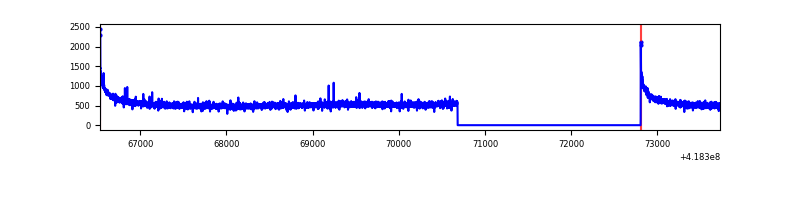 |
| B | 7190 | 5068 | 42 | 42 | 0.58% | 0.83% | 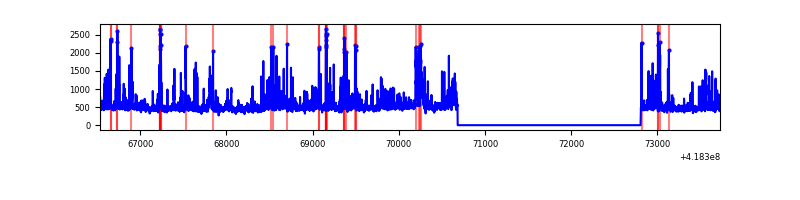 |
| C | 7190 | 5068 | 48 | 48 | 0.67% | 0.95% | 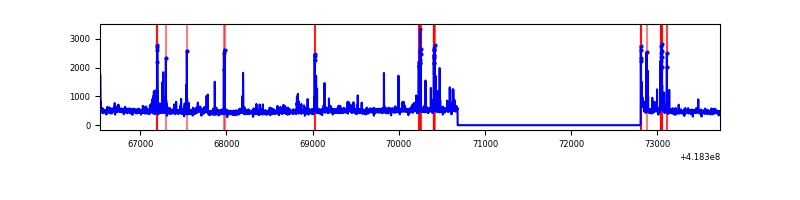 |
| D | 7190 | 5068 | 29 | 29 | 0.40% | 0.57% | 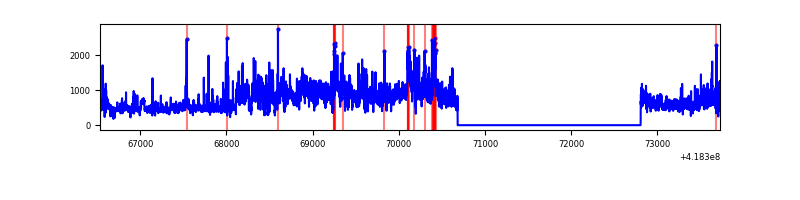 |
Top three noisy pixels from each quadrant. If the there are fewer than three noisy pixels in the level2.evt file, extra rows are filled as -1
| Pixel properties | Quadrant properties | ||||||
|---|---|---|---|---|---|---|---|
| Quadrant | DetID | PixID | Counts | Sigma | Mean | Median | Sigma |
| A | 10 | 83 | 459845 | 3855.93 | 584 | 572 | 119.1 |
| A | 15 | 191 | 18681 | 152.04 | 584 | 572 | 119.1 |
| A | 2 | 79 | 9617 | 75.94 | 584 | 572 | 119.1 |
| B | 0 | 229 | 435539 | 3892.76 | 574 | 559 | 111.7 |
| B | 0 | 190 | 209315 | 1868.22 | 574 | 559 | 111.7 |
| B | 5 | 255 | 23616 | 206.34 | 574 | 559 | 111.7 |
| C | 14 | 254 | 297149 | 2284.5 | 557 | 559 | 129.8 |
| C | 15 | 214 | 223599 | 1717.98 | 557 | 559 | 129.8 |
| C | 0 | 10 | 24425 | 183.83 | 557 | 559 | 129.8 |
| D | 12 | 227 | 1199023 | 8991.8 | 537 | 523 | 133.3 |
| D | 5 | 51 | 170235 | 1273.27 | 537 | 523 | 133.3 |
| D | 12 | 191 | 160819 | 1202.63 | 537 | 523 | 133.3 |
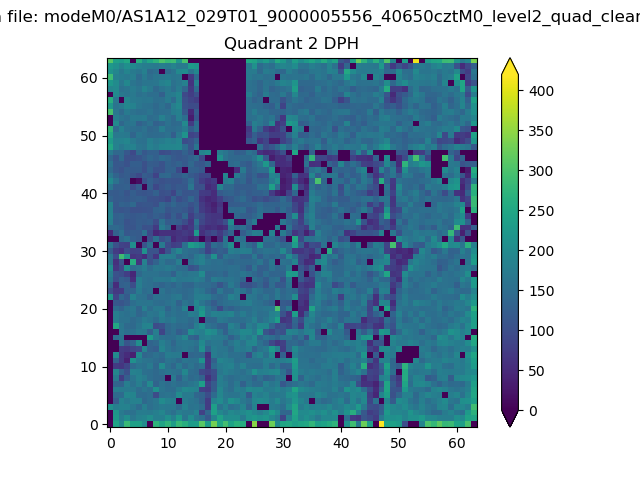
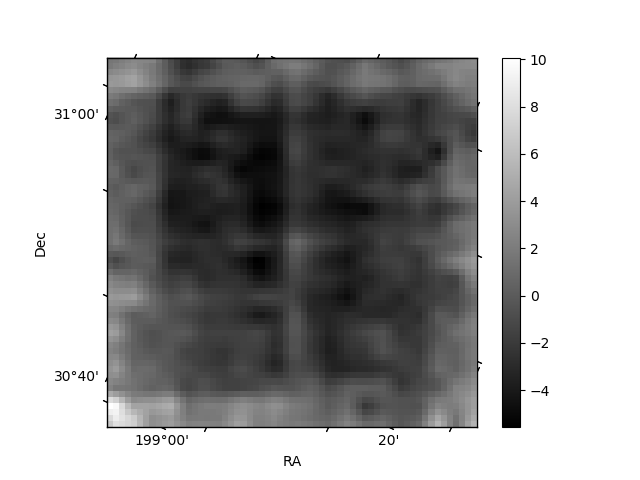
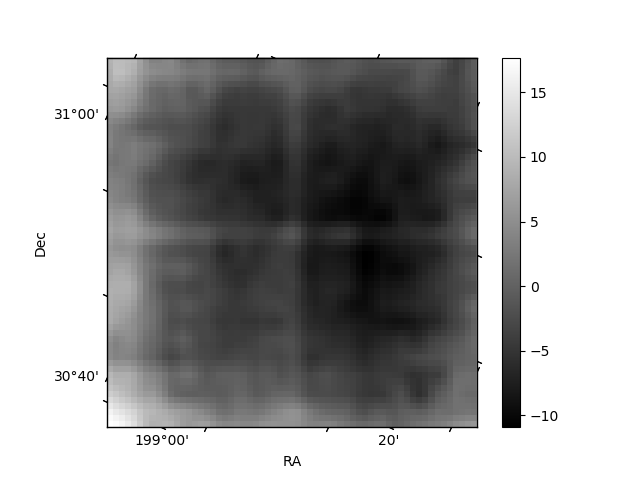
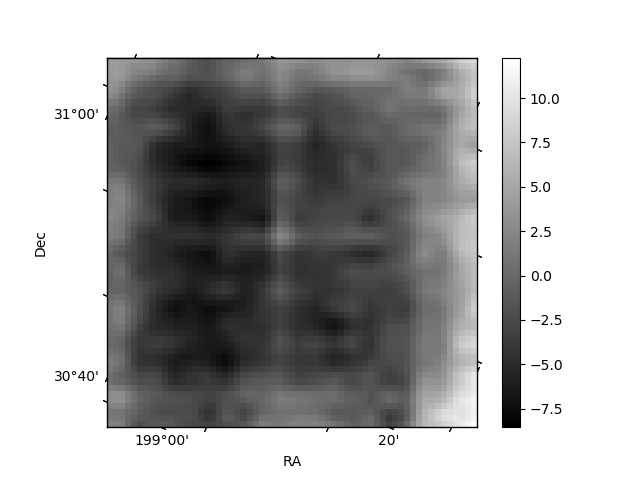
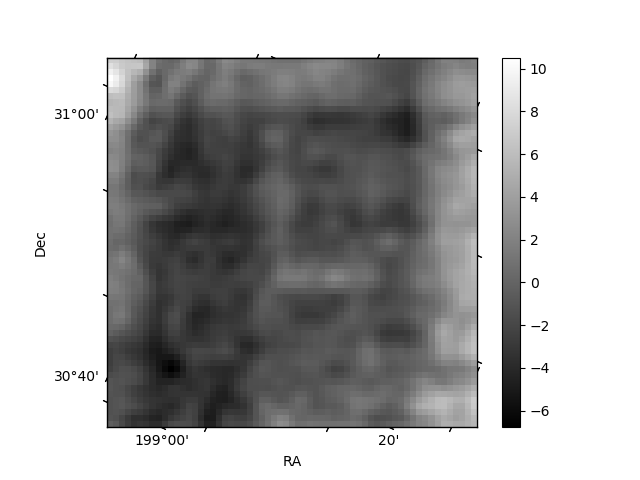
Histogram calculated using DETX and DETY for each event in the final _common_clean file
| Quadrant A | 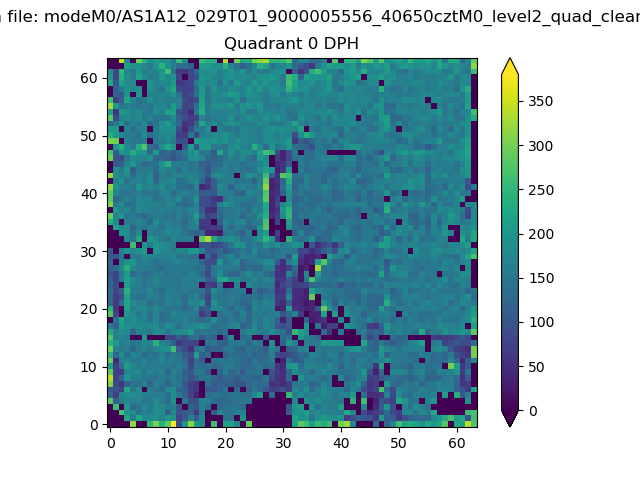 |
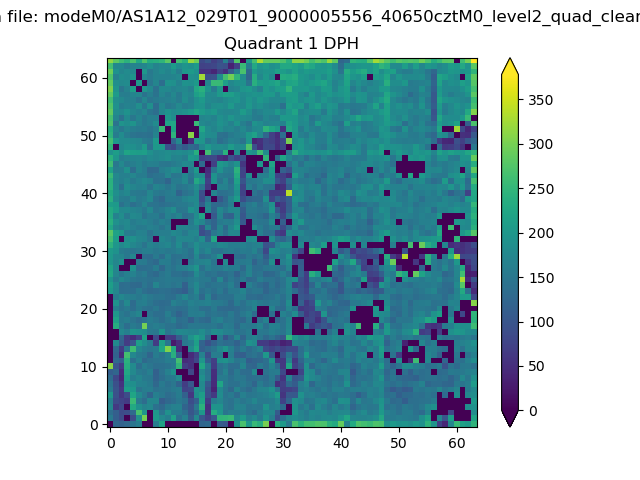 |
Quadrant B |
|---|---|---|---|
| Quadrant D | 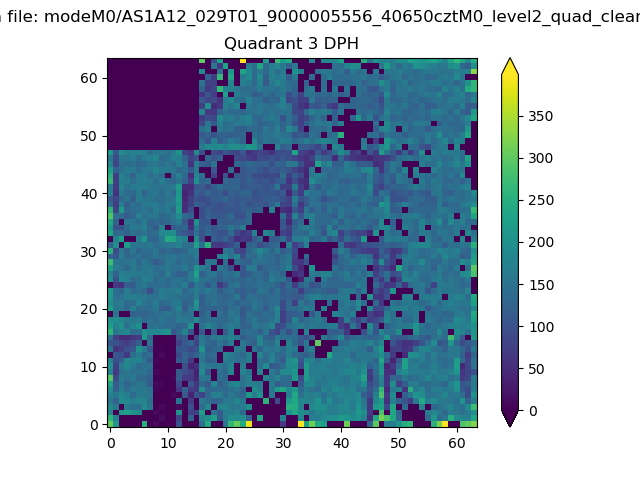 |
 |
Quadrant C |
| Plot type | Count rate plots | Images |
|---|---|---|
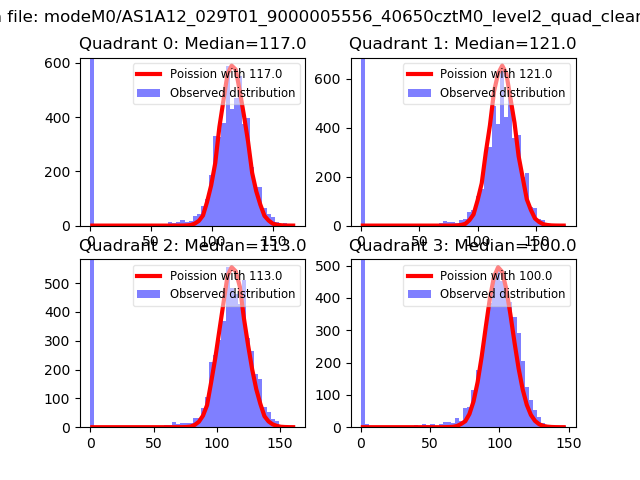
| Comparison with Poisson distribution Blue bars denote a histogram of data divided into 1 sec bins. Red curve is a Poisson curve with rate = median count rate of data. |
 |
 |
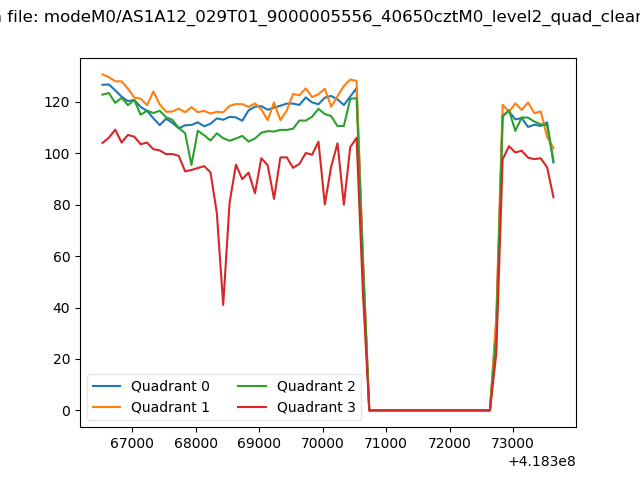
| Quadrant-wise count rates Data is divided into 100 sec bins |
 |
|
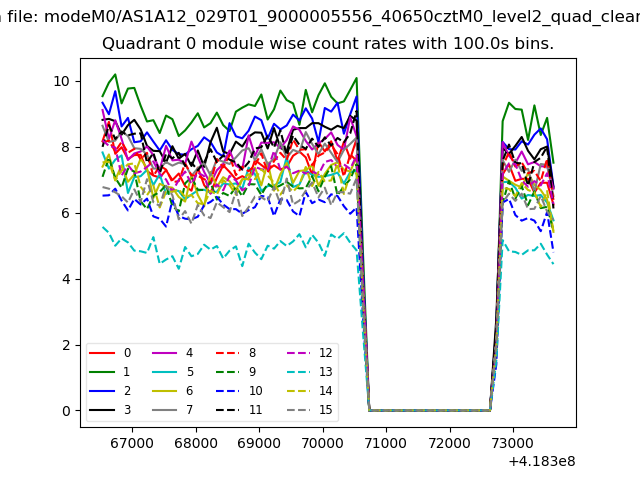
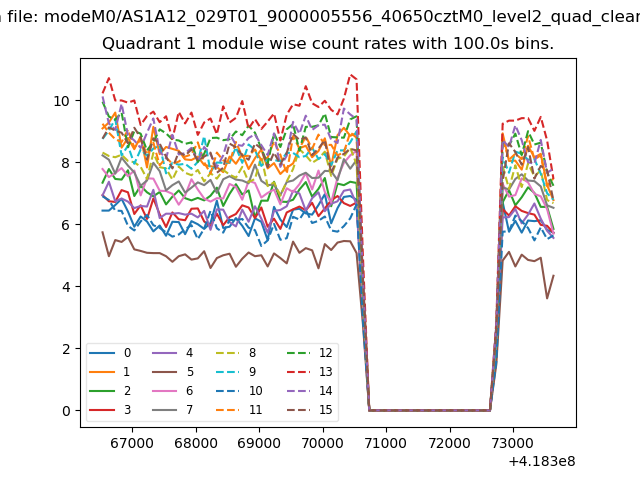
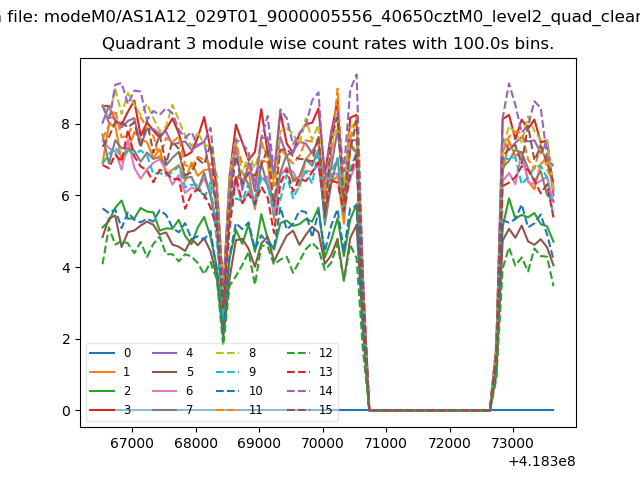
| Module-wise count rates for Quadrant A Data is divided into 100 sec bins |
 |
 |
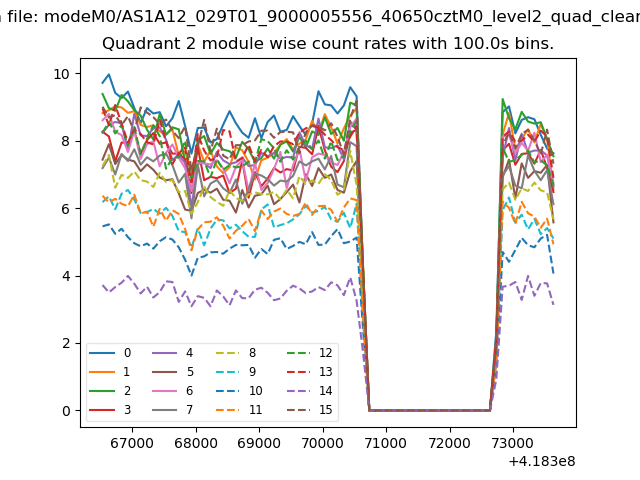
| Module-wise count rates for Quadrant B Data is divided into 100 sec bins |
 |
 |
| Module-wise count rates for Quadrant C Data is divided into 100 sec bins |
 |
 |
| Module-wise count rates for Quadrant D Data is divided into 100 sec bins |
 |
 |
| Parameter | Plot |
|---|---|
| CZT HV Monitor | 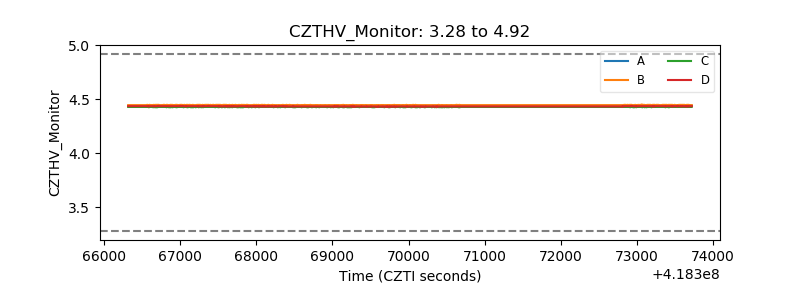 |
| D_VDD | 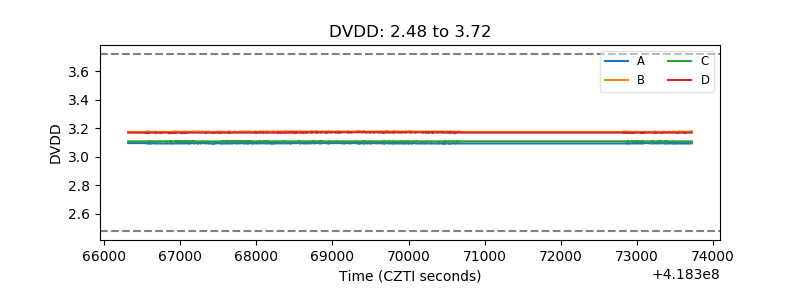 |
| Temperature 1 | 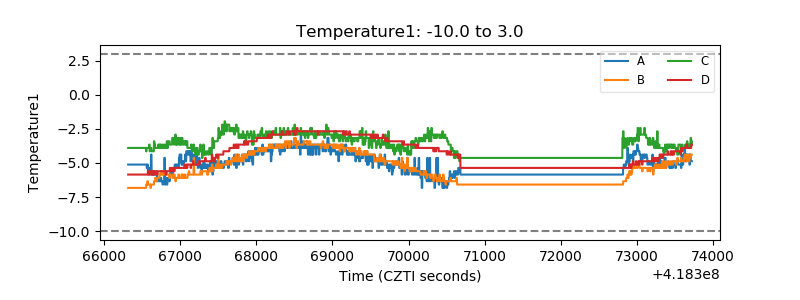 |
| Veto HV Monitor | 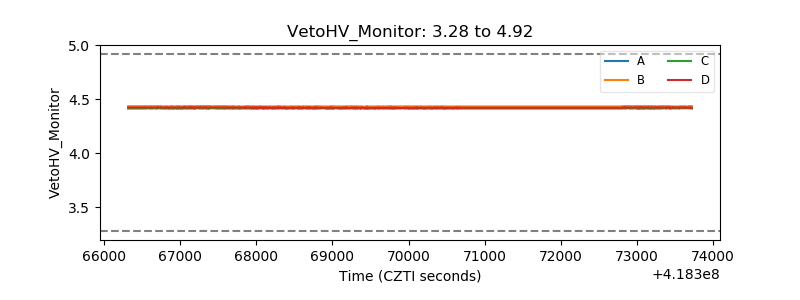 |
| Veto LLD | 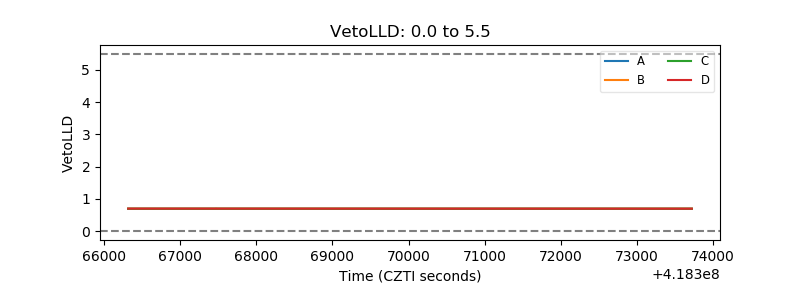 |
| Alpha Counter | 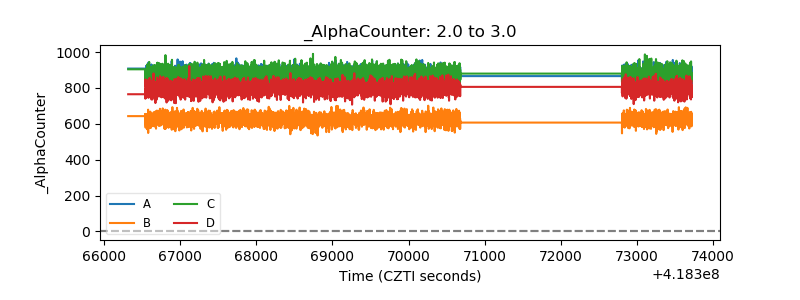 |
| _CPM_Rate | 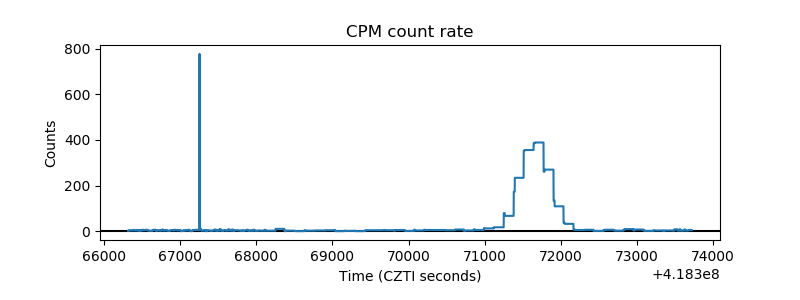 |
| CZT Counter | 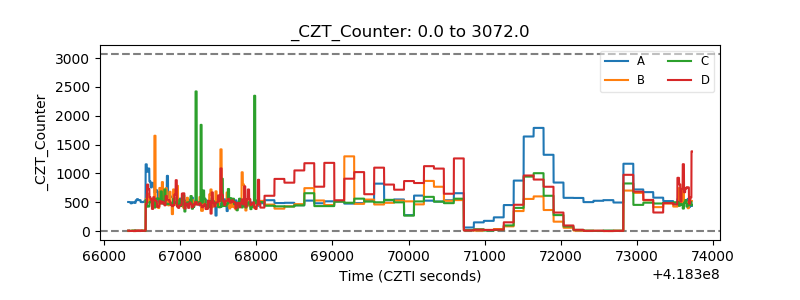 |
| +2.5 Volts monitor |  |
| +5 Volts monitor | 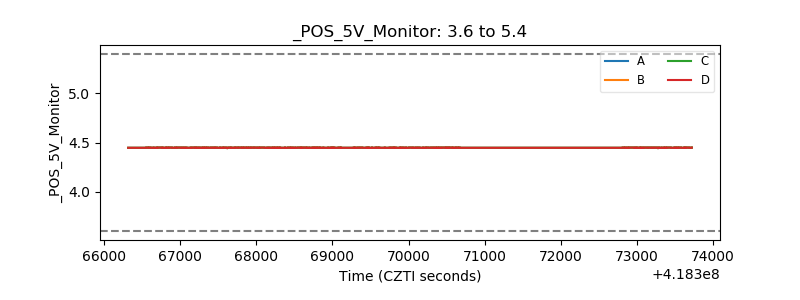 |
| _ROLL_ROT | 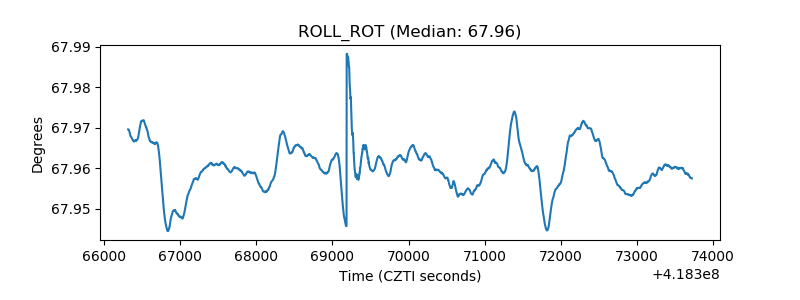 |
| _Roll_DEC | 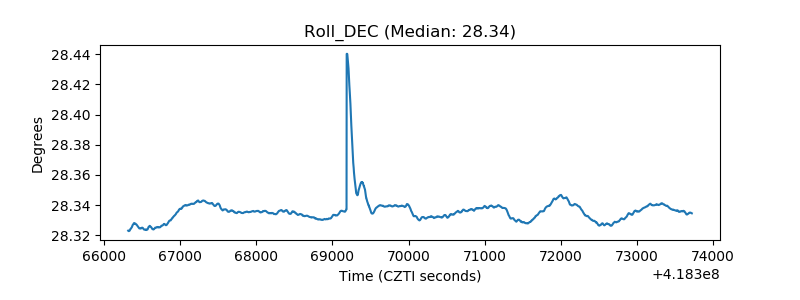 |
| _Roll_RA | 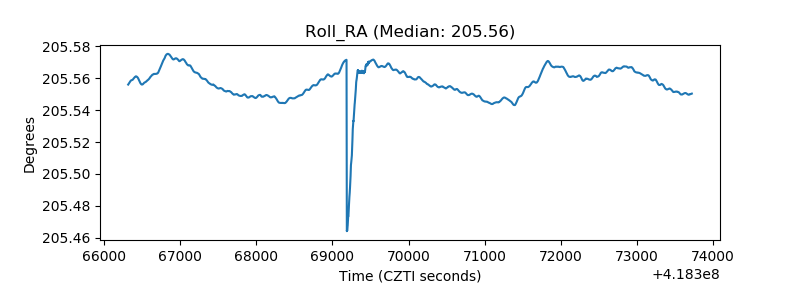 |
| Veto Counter | 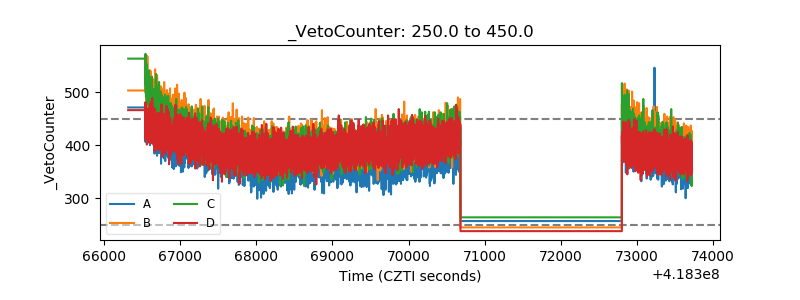 |