| Param | Original file | Final file |
|---|---|---|
| Filename | modeM0/AS1A12_029T01_9000005556_40651cztM0_level2.fits | modeM0/AS1A12_029T01_9000005556_40651cztM0_level2_quad_clean.evt |
| Size (bytes) | 305,576,640 | 82,909,440 |
| Size | 291.4 MB | 79.1 MB |
| Events in quadrant A | 2,660,462 | 566,030 |
| Events in quadrant B | 2,811,083 | 579,777 |
| Events in quadrant C | 2,472,900 | 548,726 |
| Events in quadrant D | 2,975,045 | 463,591 |
| Mode M0 | |||
|---|---|---|---|
| Quadrant | BADHDUFLAG | Total packets | Discarded packets |
| A | 0 | 10802 | 3 |
| B | 0 | 11607 | 2 |
| C | 0 | 10388 | 2 |
| D | 0 | 12144 | 2 |
| Mode M9 | |||
|---|---|---|---|
| Quadrant | BADHDUFLAG | Total packets | Discarded packets |
| A | 0 | 30 | 0 |
| B | 0 | 30 | 0 |
| C | 0 | 30 | 0 |
| D | 0 | 31 | 0 |
| Mode SS | |||
|---|---|---|---|
| Quadrant | BADHDUFLAG | Total packets | Discarded packets |
| A | 0 | 104 | 0 |
| B | 0 | 104 | 0 |
| C | 0 | 104 | 0 |
| D | 0 | 104 | 0 |
| Quadrant | Total seconds | Saturated seconds | Saturation percentage |
|---|---|---|---|
| A | 5021 | 10 | 0.199164% |
| B | 5021 | 76 | 1.513643% |
| C | 5021 | 20 | 0.398327% |
| D | 5021 | 499 | 9.938259% |
Noise dominated data is calculated using 1-second bins in cleaned event files. If a bin has >2000 counts, and if more than 50% of those come from <1% of pixels, then it is considered to be noise-dominated and hence unusable.
| Quadrant | # 1 sec bins | Bins with >0 counts | Bins with >2000 counts | High rate bins dominated by noise | Noise dominated (total time) | Noise dominated (detector-on time) | Marked lightcurve |
|---|---|---|---|---|---|---|---|
| A | 7054 | 5022 | 4 | 4 | 0.06% | 0.08% | 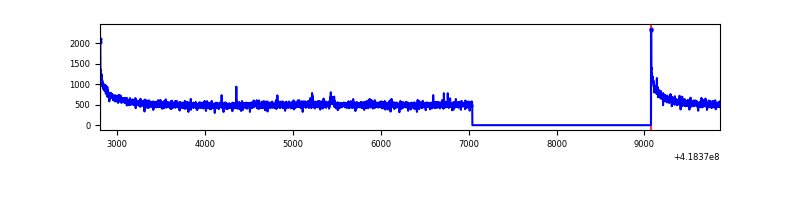 |
| B | 7054 | 5022 | 35 | 35 | 0.50% | 0.70% | 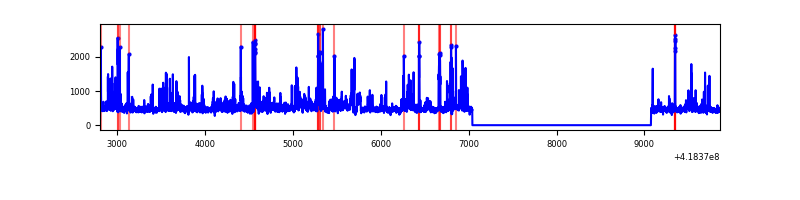 |
| C | 7054 | 5022 | 18 | 18 | 0.26% | 0.36% | 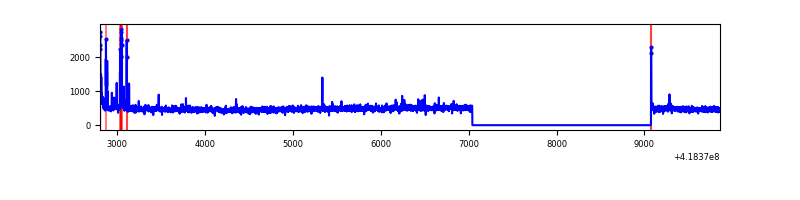 |
| D | 7053 | 5021 | 47 | 47 | 0.67% | 0.94% | 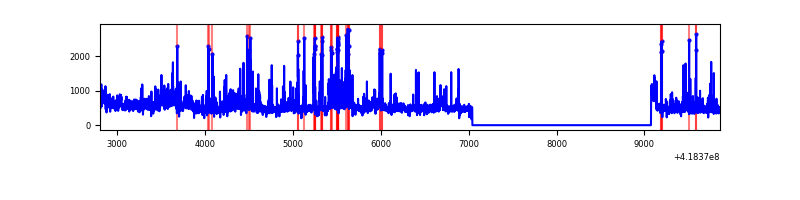 |
Top three noisy pixels from each quadrant. If the there are fewer than three noisy pixels in the level2.evt file, extra rows are filled as -1
| Pixel properties | Quadrant properties | ||||||
|---|---|---|---|---|---|---|---|
| Quadrant | DetID | PixID | Counts | Sigma | Mean | Median | Sigma |
| A | 10 | 83 | 453197 | 3899.25 | 566 | 556 | 116.1 |
| A | 6 | 10 | 12020 | 98.76 | 566 | 556 | 116.1 |
| A | 3 | 137 | 6363 | 50.02 | 566 | 556 | 116.1 |
| B | 0 | 229 | 404432 | 3691.62 | 560 | 545 | 109.4 |
| B | 0 | 190 | 170716 | 1555.4 | 560 | 545 | 109.4 |
| B | 12 | 111 | 14232 | 125.1 | 560 | 545 | 109.4 |
| C | 15 | 214 | 223983 | 1740.99 | 547 | 550 | 128.3 |
| C | 14 | 254 | 69731 | 539.06 | 547 | 550 | 128.3 |
| C | 0 | 10 | 25710 | 196.05 | 547 | 550 | 128.3 |
| D | 12 | 227 | 362444 | 2845.16 | 519 | 505 | 127.2 |
| D | 5 | 51 | 233645 | 1832.69 | 519 | 505 | 127.2 |
| D | 12 | 191 | 173827 | 1362.46 | 519 | 505 | 127.2 |
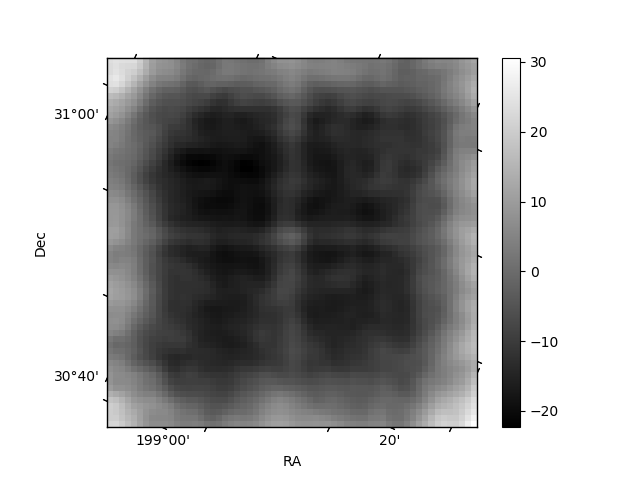
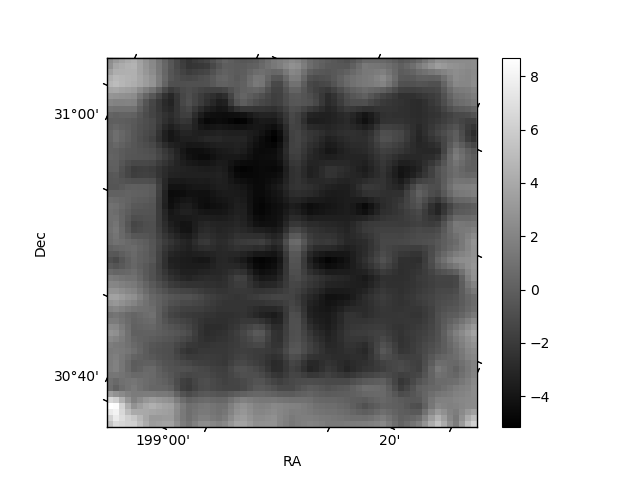
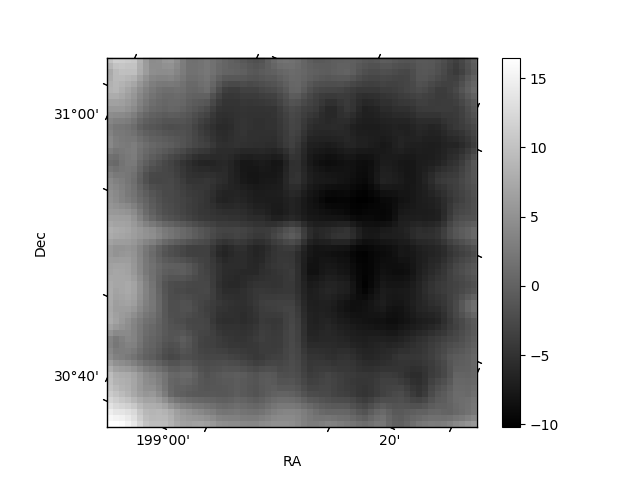
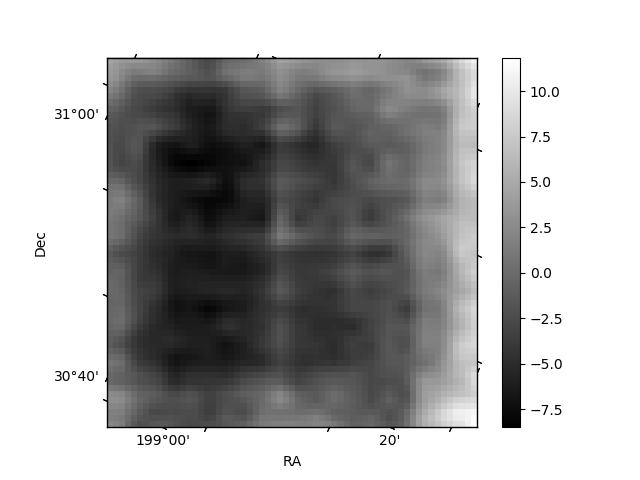
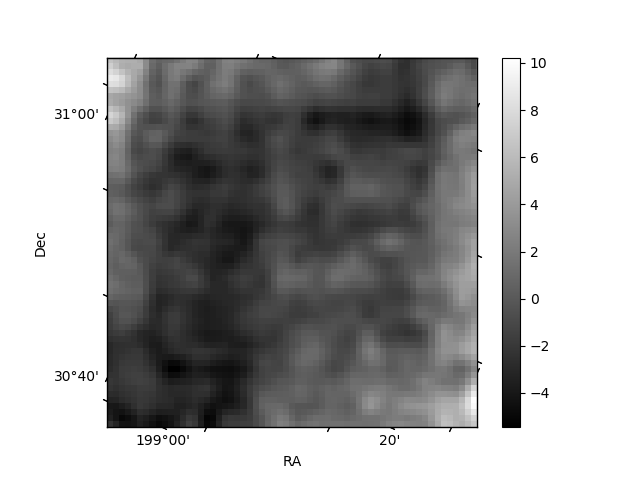
Histogram calculated using DETX and DETY for each event in the final _common_clean file
| Quadrant A | 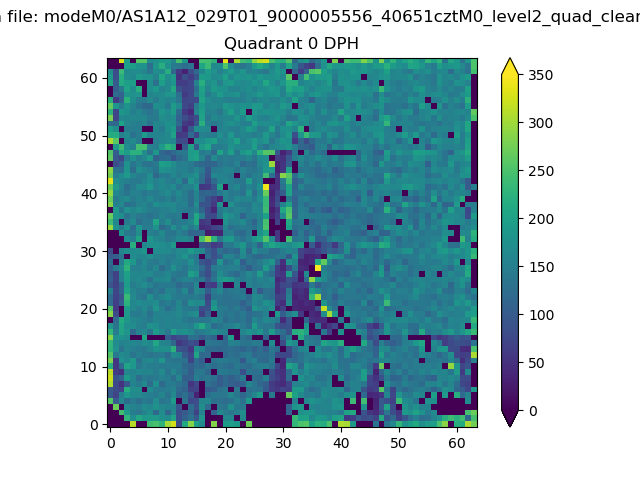 |
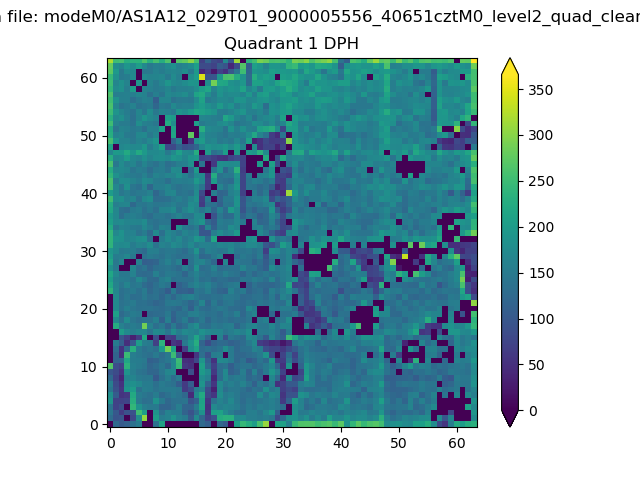 |
Quadrant B |
|---|---|---|---|
| Quadrant D | 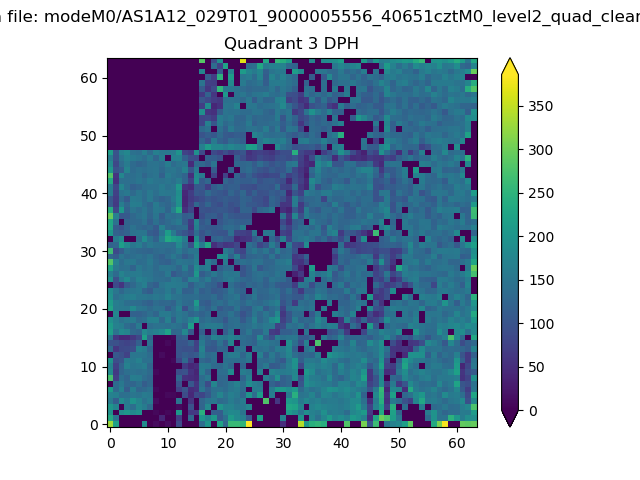 |
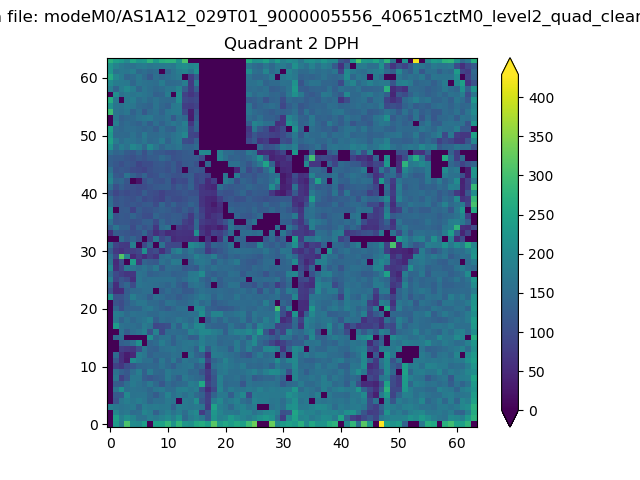 |
Quadrant C |
| Plot type | Count rate plots | Images |
|---|---|---|
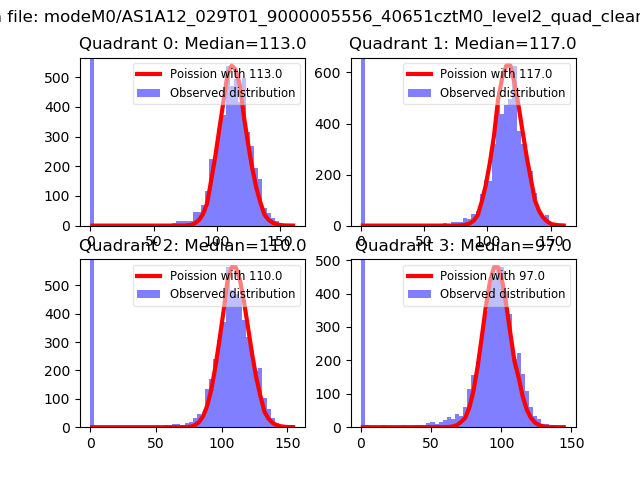
| Comparison with Poisson distribution Blue bars denote a histogram of data divided into 1 sec bins. Red curve is a Poisson curve with rate = median count rate of data. |
 |
 |
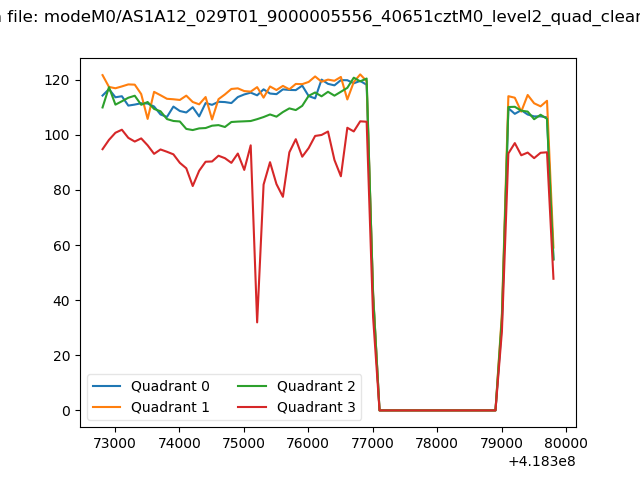
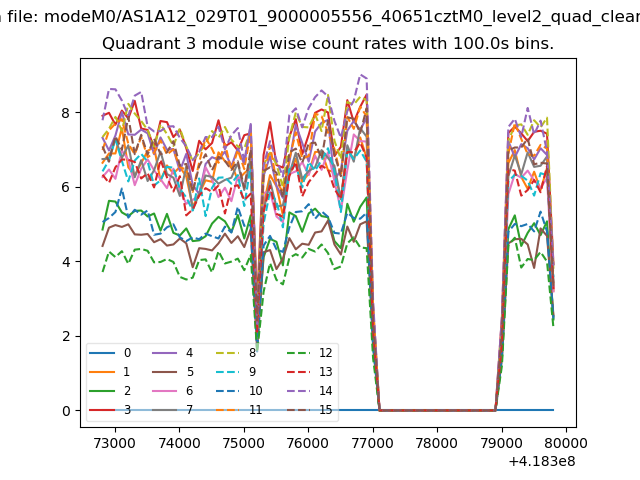
| Quadrant-wise count rates Data is divided into 100 sec bins |
 |
|
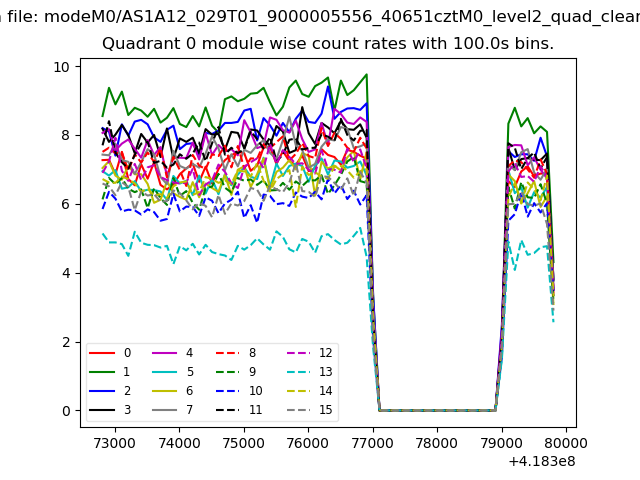
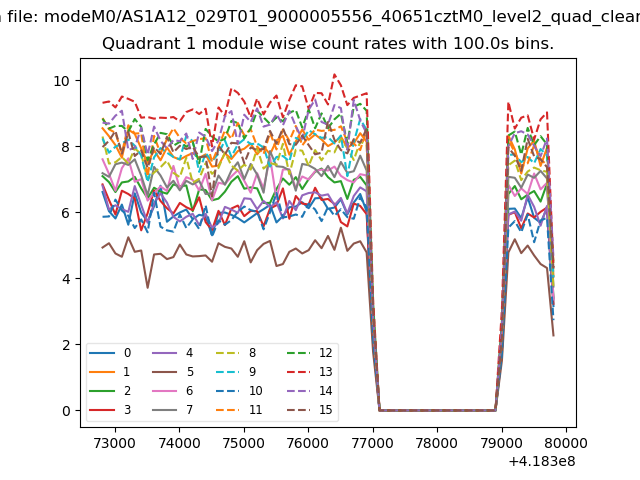
| Module-wise count rates for Quadrant A Data is divided into 100 sec bins |
 |
 |
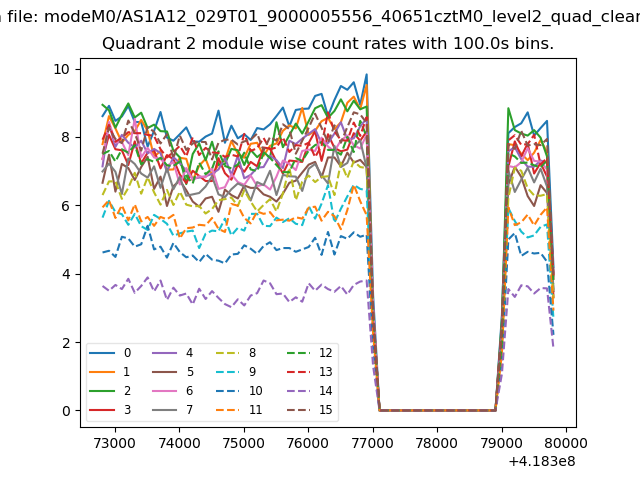
| Module-wise count rates for Quadrant B Data is divided into 100 sec bins |
 |
 |
| Module-wise count rates for Quadrant C Data is divided into 100 sec bins |
 |
 |
| Module-wise count rates for Quadrant D Data is divided into 100 sec bins |
 |
 |
| Parameter | Plot |
|---|---|
| CZT HV Monitor | 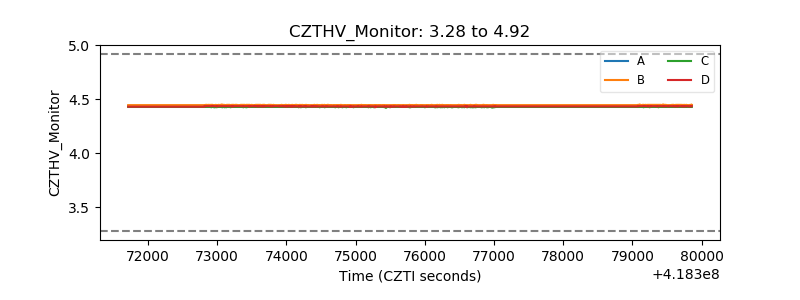 |
| D_VDD | 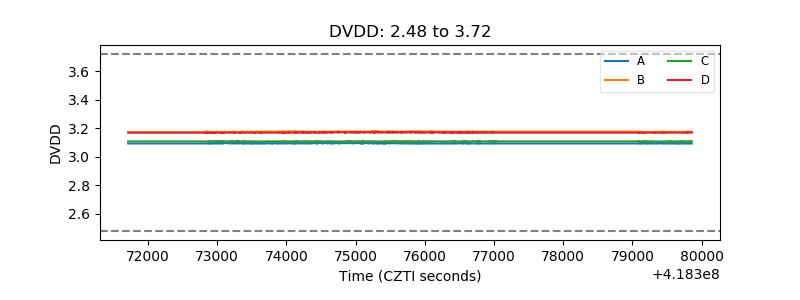 |
| Temperature 1 | 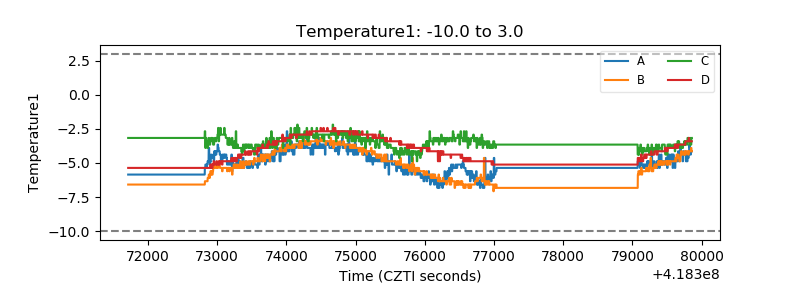 |
| Veto HV Monitor | 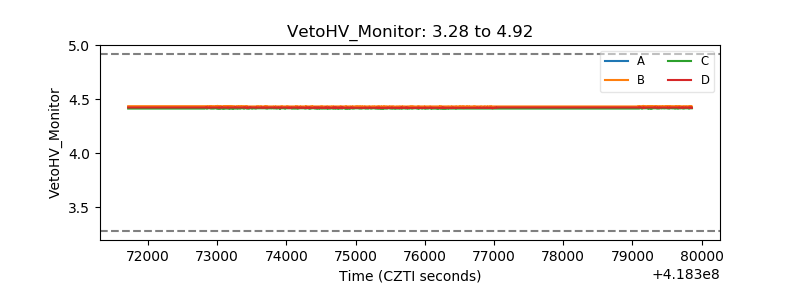 |
| Veto LLD | 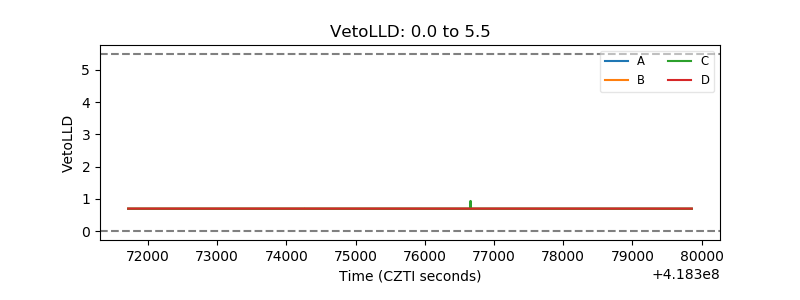 |
| Alpha Counter | 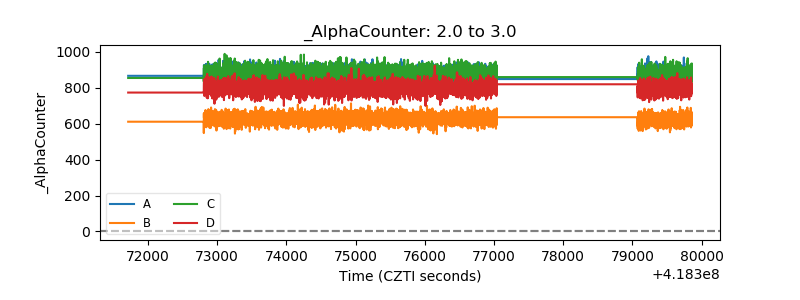 |
| _CPM_Rate | 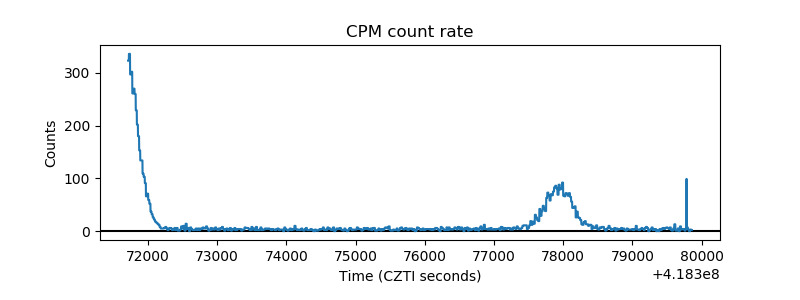 |
| CZT Counter | 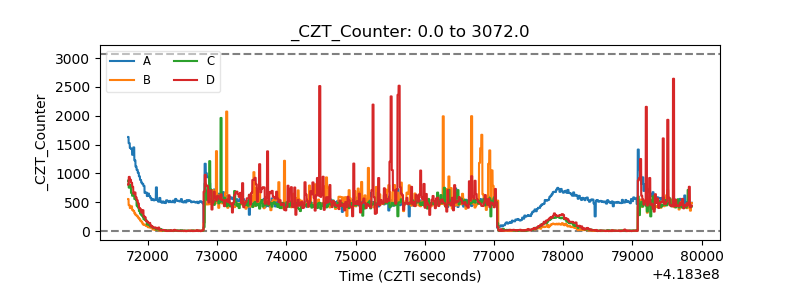 |
| +2.5 Volts monitor |  |
| +5 Volts monitor | 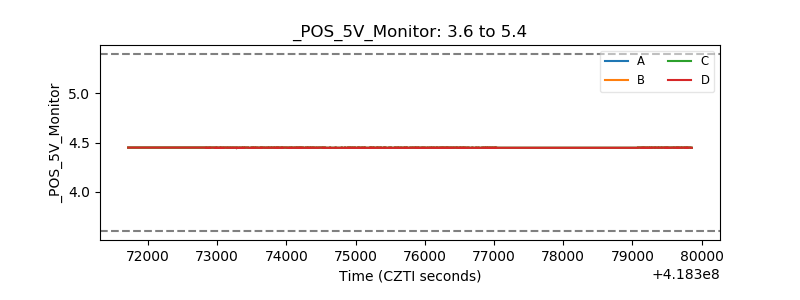 |
| _ROLL_ROT | 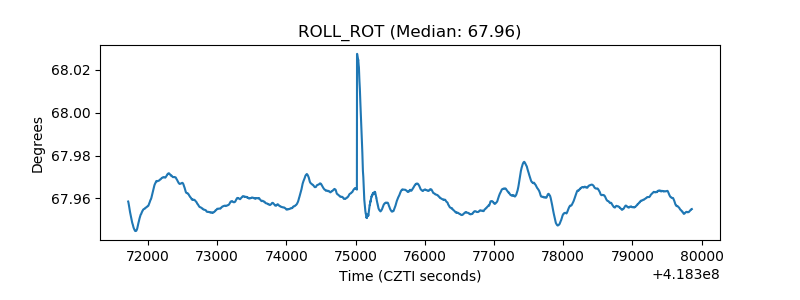 |
| _Roll_DEC | 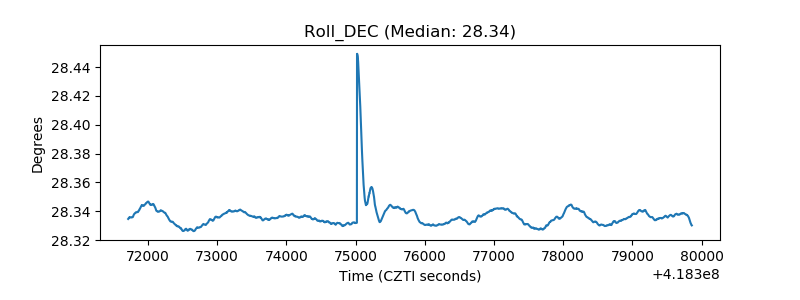 |
| _Roll_RA | 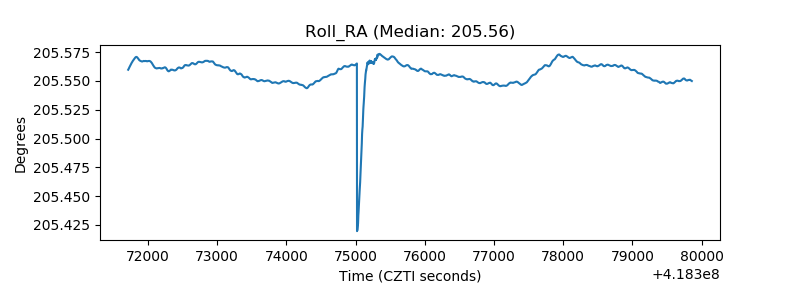 |
| Veto Counter | 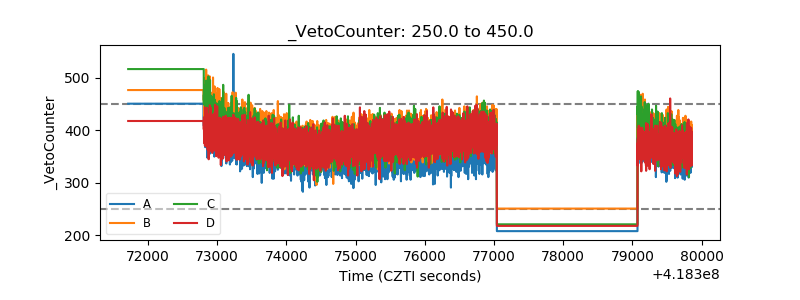 |