| Param | Original file | Final file |
|---|---|---|
| Filename | modeM0/AS1A12_029T01_9000005556_40652cztM0_level2.fits | modeM0/AS1A12_029T01_9000005556_40652cztM0_level2_quad_clean.evt |
| Size (bytes) | 307,480,320 | 85,775,040 |
| Size | 293.2 MB | 81.8 MB |
| Events in quadrant A | 2,762,169 | 586,387 |
| Events in quadrant B | 3,014,310 | 598,951 |
| Events in quadrant C | 2,575,710 | 564,950 |
| Events in quadrant D | 2,613,996 | 474,382 |
| Mode M0 | |||
|---|---|---|---|
| Quadrant | BADHDUFLAG | Total packets | Discarded packets |
| A | 0 | 11348 | 3 |
| B | 0 | 12503 | 2 |
| C | 0 | 10934 | 2 |
| D | 0 | 11325 | 2 |
| Mode M9 | |||
|---|---|---|---|
| Quadrant | BADHDUFLAG | Total packets | Discarded packets |
| A | 0 | 33 | 0 |
| B | 0 | 33 | 0 |
| C | 0 | 33 | 0 |
| D | 0 | 34 | 0 |
| Mode SS | |||
|---|---|---|---|
| Quadrant | BADHDUFLAG | Total packets | Discarded packets |
| A | 0 | 108 | 0 |
| B | 0 | 108 | 0 |
| C | 0 | 108 | 0 |
| D | 0 | 108 | 0 |
| Quadrant | Total seconds | Saturated seconds | Saturation percentage |
|---|---|---|---|
| A | 5323 | 11 | 0.206650% |
| B | 5323 | 97 | 1.822281% |
| C | 5323 | 24 | 0.450874% |
| D | 5323 | 566 | 10.633102% |
Noise dominated data is calculated using 1-second bins in cleaned event files. If a bin has >2000 counts, and if more than 50% of those come from <1% of pixels, then it is considered to be noise-dominated and hence unusable.
| Quadrant | # 1 sec bins | Bins with >0 counts | Bins with >2000 counts | High rate bins dominated by noise | Noise dominated (total time) | Noise dominated (detector-on time) | Marked lightcurve |
|---|---|---|---|---|---|---|---|
| A | 7086 | 5324 | 4 | 4 | 0.06% | 0.08% | 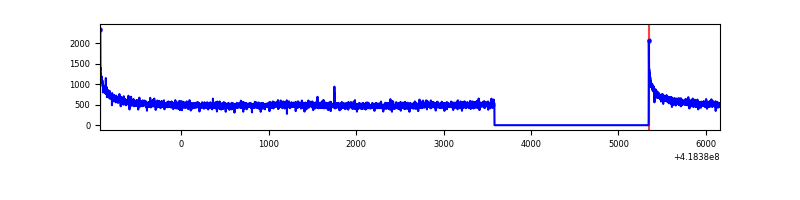 |
| B | 7086 | 5324 | 64 | 64 | 0.90% | 1.20% | 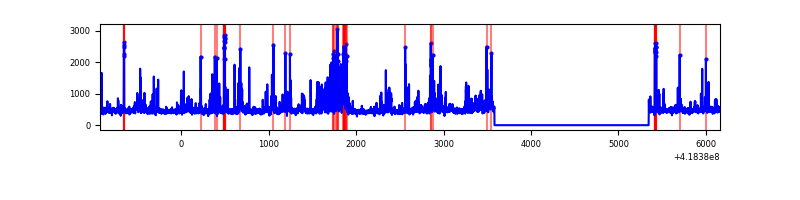 |
| C | 7086 | 5324 | 18 | 18 | 0.25% | 0.34% | 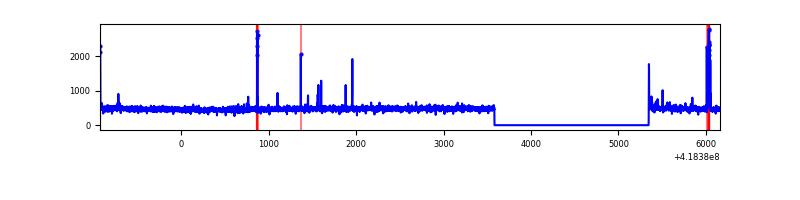 |
| D | 7086 | 5324 | 25 | 25 | 0.35% | 0.47% | 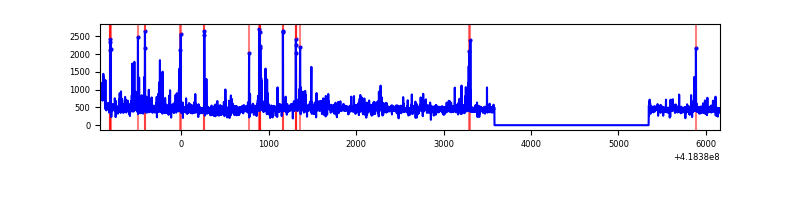 |
Top three noisy pixels from each quadrant. If the there are fewer than three noisy pixels in the level2.evt file, extra rows are filled as -1
| Pixel properties | Quadrant properties | ||||||
|---|---|---|---|---|---|---|---|
| Quadrant | DetID | PixID | Counts | Sigma | Mean | Median | Sigma |
| A | 10 | 83 | 468267 | 3847.15 | 591 | 581 | 121.6 |
| A | 3 | 137 | 6639 | 49.83 | 591 | 581 | 121.6 |
| A | 13 | 254 | 5949 | 44.16 | 591 | 581 | 121.6 |
| B | 0 | 229 | 407711 | 3550.22 | 584 | 568 | 114.7 |
| B | 0 | 190 | 300224 | 2612.95 | 584 | 568 | 114.7 |
| B | 12 | 111 | 14655 | 122.84 | 584 | 568 | 114.7 |
| C | 15 | 214 | 237484 | 1767.59 | 574 | 576 | 134.0 |
| C | 10 | 20 | 43281 | 318.62 | 574 | 576 | 134.0 |
| C | 14 | 254 | 38495 | 282.91 | 574 | 576 | 134.0 |
| D | 12 | 191 | 188602 | 1405.38 | 541 | 525 | 133.8 |
| D | 12 | 227 | 103894 | 772.41 | 541 | 525 | 133.8 |
| D | 2 | 250 | 83865 | 622.74 | 541 | 525 | 133.8 |
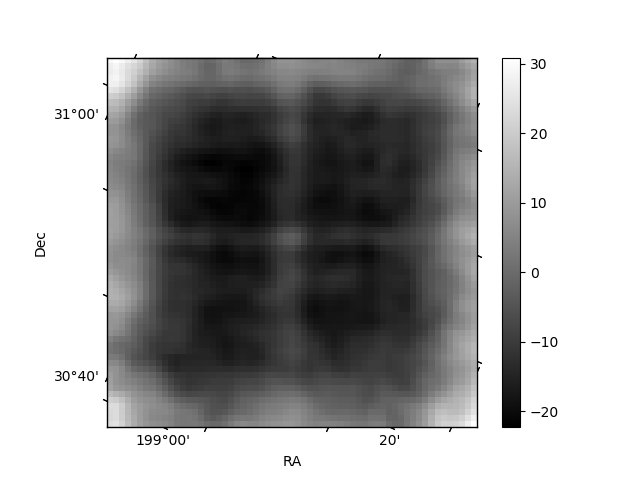
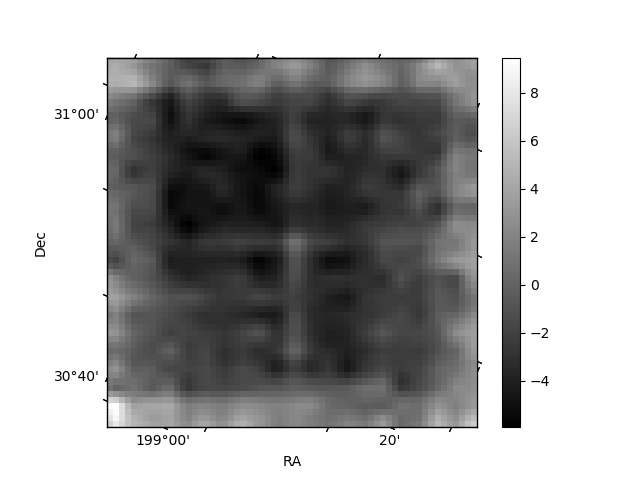
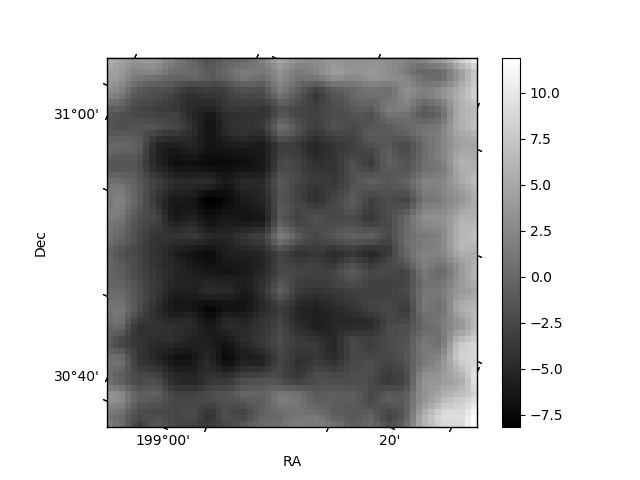
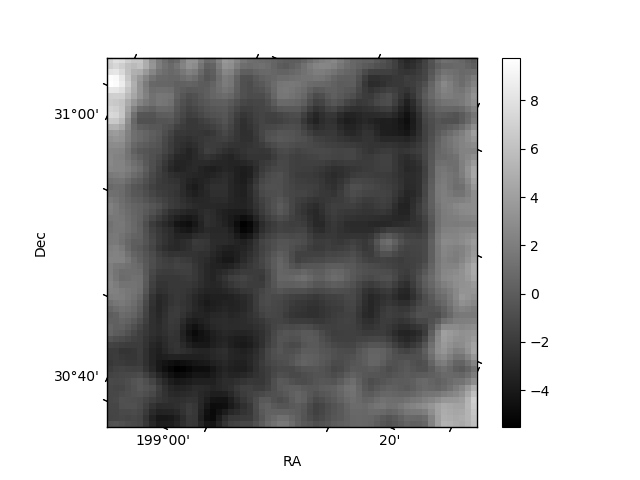
Histogram calculated using DETX and DETY for each event in the final _common_clean file
| Quadrant A | 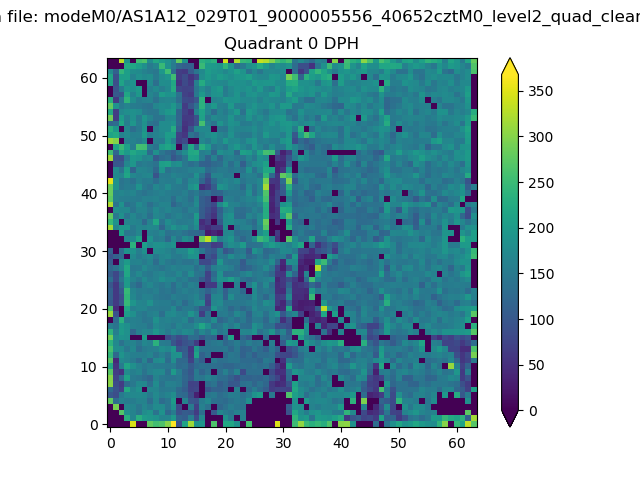 |
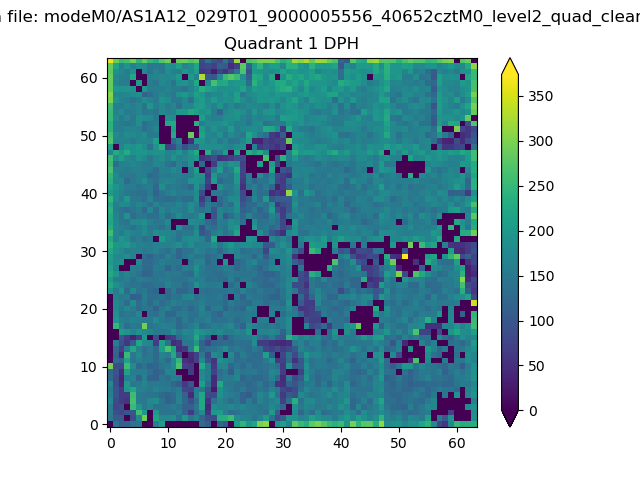 |
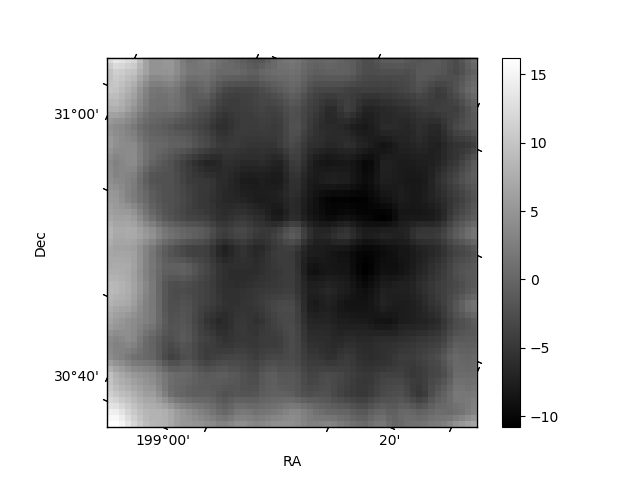
Quadrant B |
|---|---|---|---|
| Quadrant D | 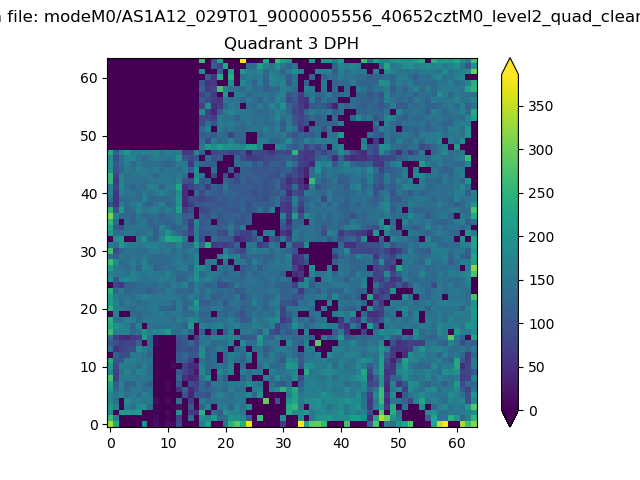 |
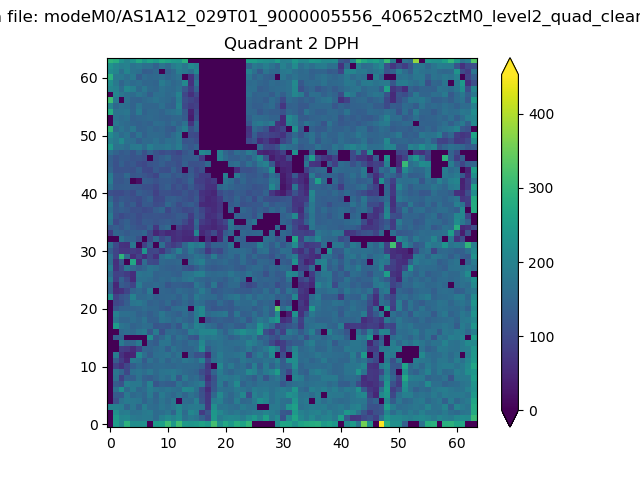 |
Quadrant C |
| Plot type | Count rate plots | Images |
|---|---|---|
| Comparison with Poisson distribution Blue bars denote a histogram of data divided into 1 sec bins. Red curve is a Poisson curve with rate = median count rate of data. |
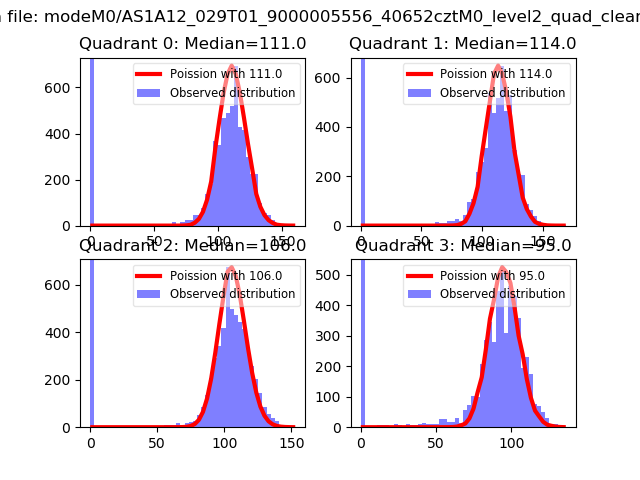 |
 |
| Quadrant-wise count rates Data is divided into 100 sec bins |
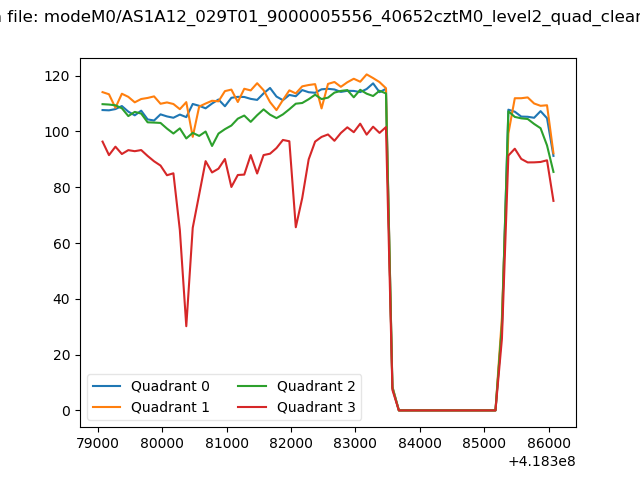 |
|
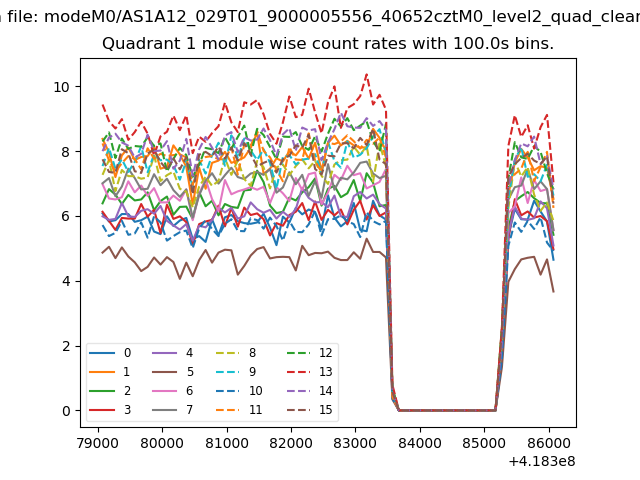
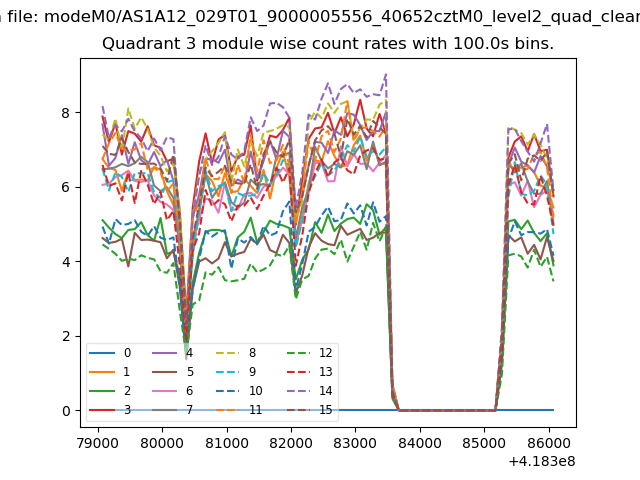
| Module-wise count rates for Quadrant A Data is divided into 100 sec bins |
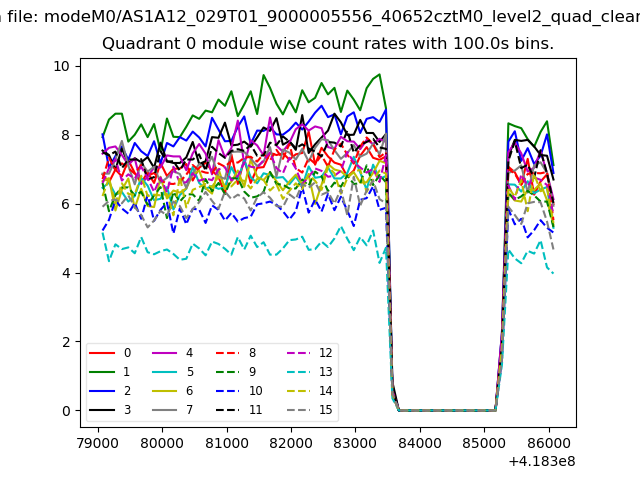 |
 |
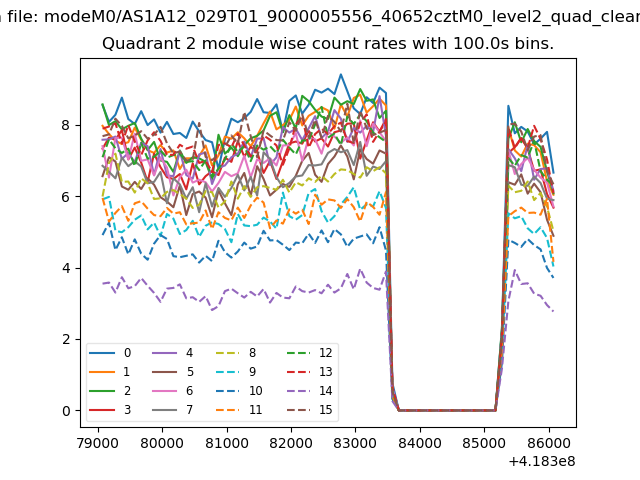
| Module-wise count rates for Quadrant B Data is divided into 100 sec bins |
 |
 |
| Module-wise count rates for Quadrant C Data is divided into 100 sec bins |
 |
 |
| Module-wise count rates for Quadrant D Data is divided into 100 sec bins |
 |
 |
| Parameter | Plot |
|---|---|
| CZT HV Monitor | 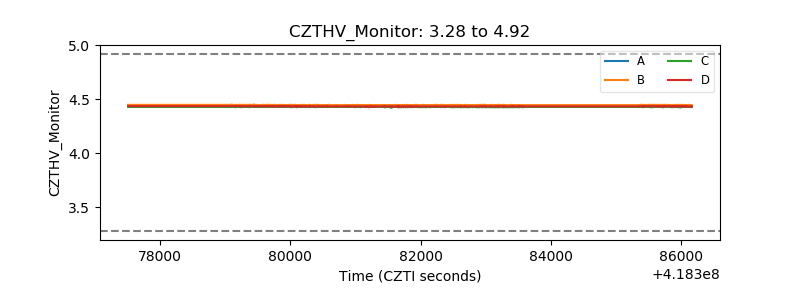 |
| D_VDD | 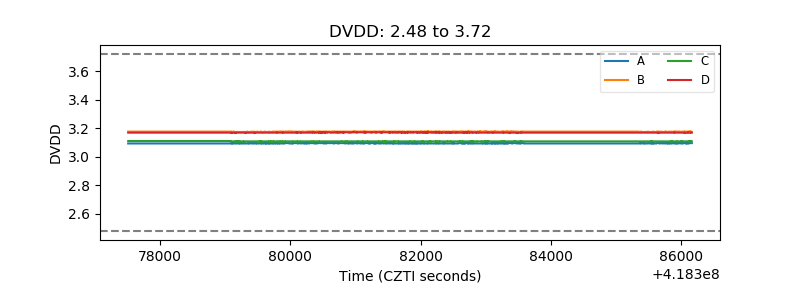 |
| Temperature 1 | 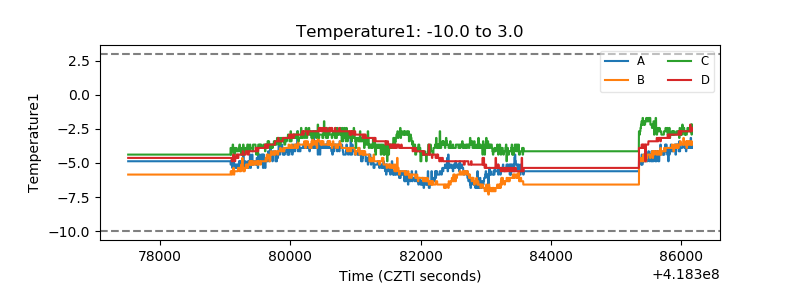 |
| Veto HV Monitor | 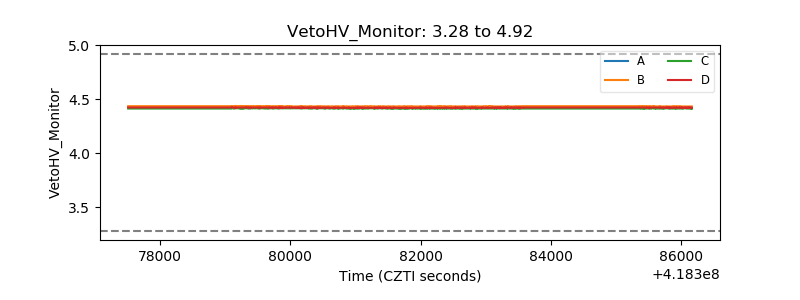 |
| Veto LLD | 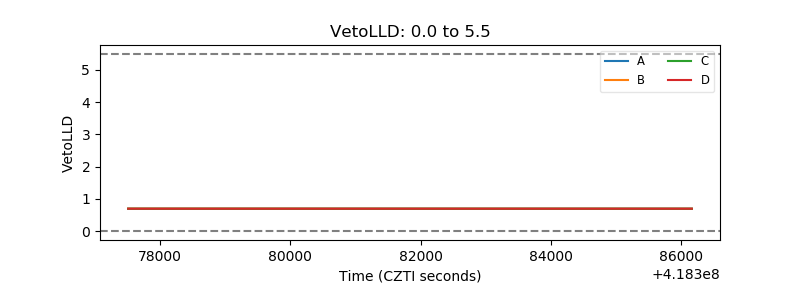 |
| Alpha Counter | 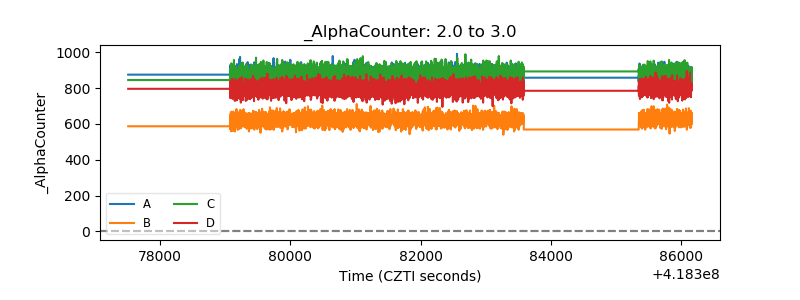 |
| _CPM_Rate | 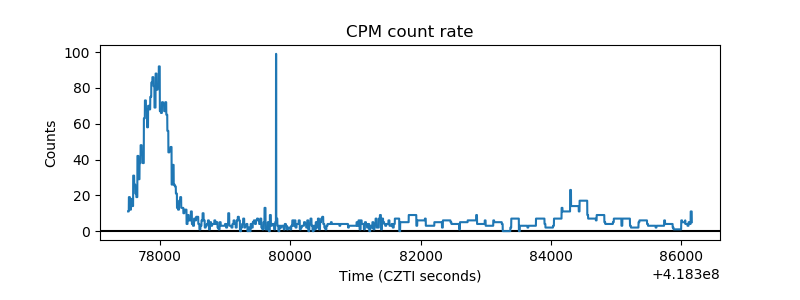 |
| CZT Counter | 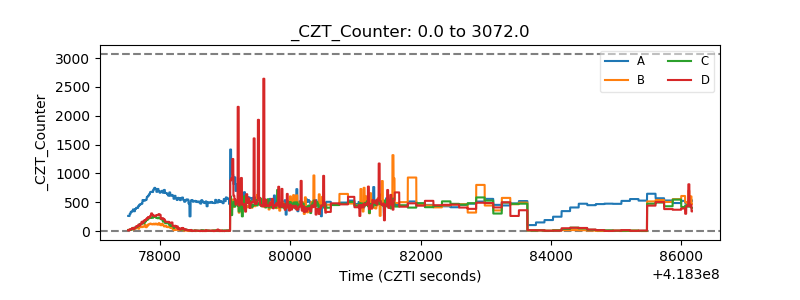 |
| +2.5 Volts monitor | 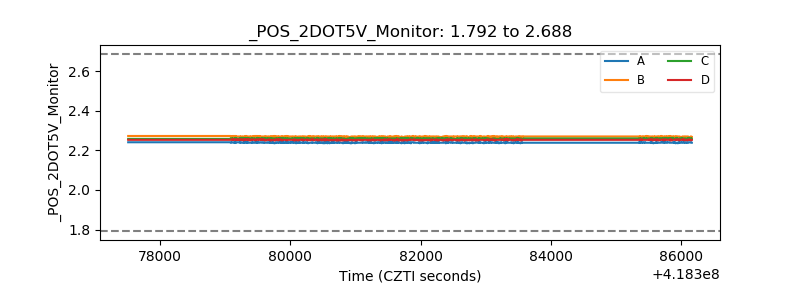 |
| +5 Volts monitor | 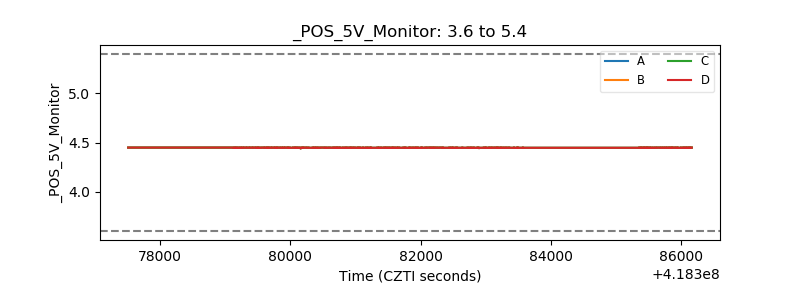 |
| _ROLL_ROT | 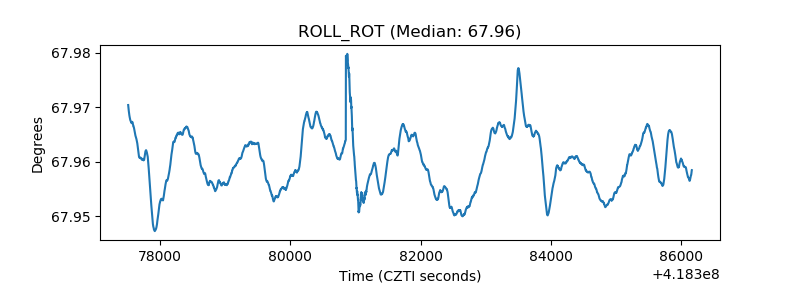 |
| _Roll_DEC | 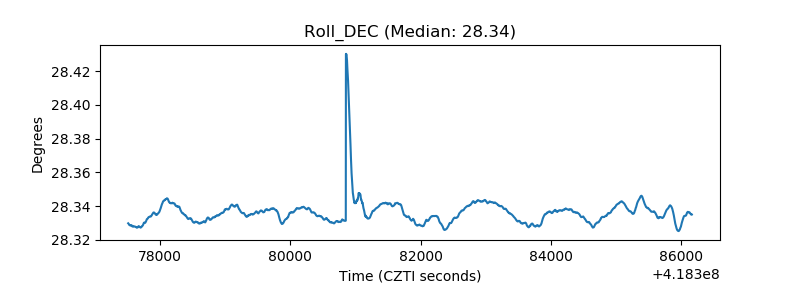 |
| _Roll_RA | 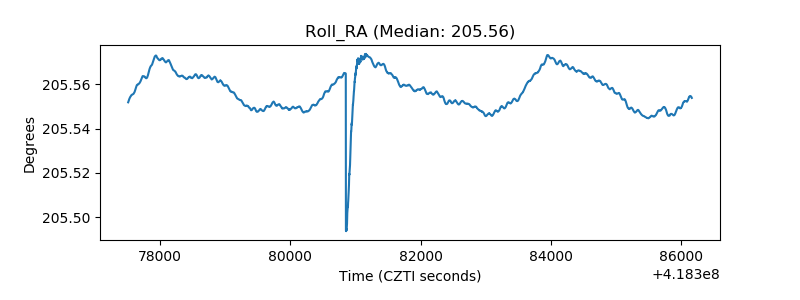 |
| Veto Counter | 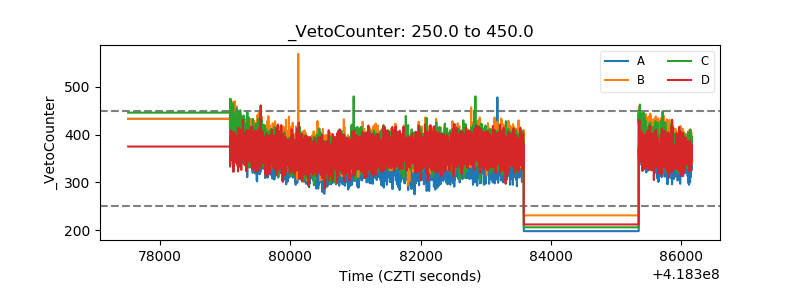 |