| Param | Original file | Final file |
|---|---|---|
| Filename | modeM0/AS1A12_029T01_9000005556_40653cztM0_level2.fits | modeM0/AS1A12_029T01_9000005556_40653cztM0_level2_quad_clean.evt |
| Size (bytes) | 335,318,400 | 95,086,080 |
| Size | 319.8 MB | 90.7 MB |
| Events in quadrant A | 3,043,096 | 649,681 |
| Events in quadrant B | 3,226,132 | 659,657 |
| Events in quadrant C | 2,875,221 | 625,332 |
| Events in quadrant D | 2,806,267 | 530,964 |
| Mode M0 | |||
|---|---|---|---|
| Quadrant | BADHDUFLAG | Total packets | Discarded packets |
| A | 0 | 12605 | 3 |
| B | 0 | 13497 | 2 |
| C | 0 | 12238 | 2 |
| D | 0 | 12455 | 2 |
| Mode M9 | |||
|---|---|---|---|
| Quadrant | BADHDUFLAG | Total packets | Discarded packets |
| A | 0 | 33 | 0 |
| B | 0 | 33 | 0 |
| C | 0 | 33 | 0 |
| D | 0 | 33 | 0 |
| Mode SS | |||
|---|---|---|---|
| Quadrant | BADHDUFLAG | Total packets | Discarded packets |
| A | 0 | 122 | 0 |
| B | 0 | 122 | 0 |
| C | 0 | 122 | 0 |
| D | 0 | 122 | 0 |
| Quadrant | Total seconds | Saturated seconds | Saturation percentage |
|---|---|---|---|
| A | 5919 | 13 | 0.219632% |
| B | 5919 | 100 | 1.689475% |
| C | 5919 | 22 | 0.371684% |
| D | 5919 | 549 | 9.275215% |
Noise dominated data is calculated using 1-second bins in cleaned event files. If a bin has >2000 counts, and if more than 50% of those come from <1% of pixels, then it is considered to be noise-dominated and hence unusable.
| Quadrant | # 1 sec bins | Bins with >0 counts | Bins with >2000 counts | High rate bins dominated by noise | Noise dominated (total time) | Noise dominated (detector-on time) | Marked lightcurve |
|---|---|---|---|---|---|---|---|
| A | 9145 | 5921 | 3 | 3 | 0.03% | 0.05% | 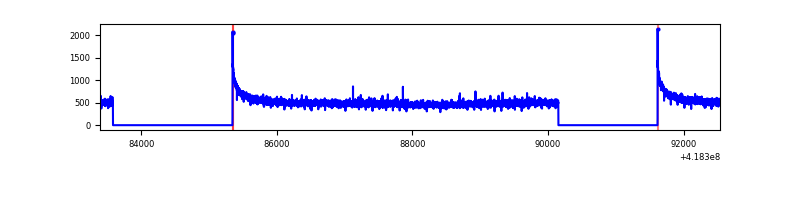 |
| B | 9145 | 5921 | 53 | 53 | 0.58% | 0.90% | 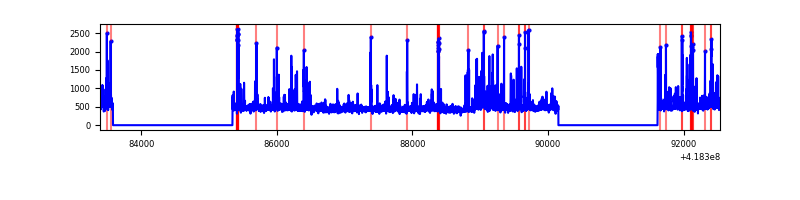 |
| C | 9145 | 5921 | 15 | 15 | 0.16% | 0.25% | 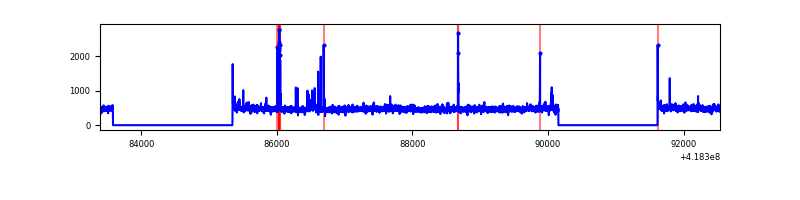 |
| D | 9145 | 5921 | 21 | 21 | 0.23% | 0.35% | 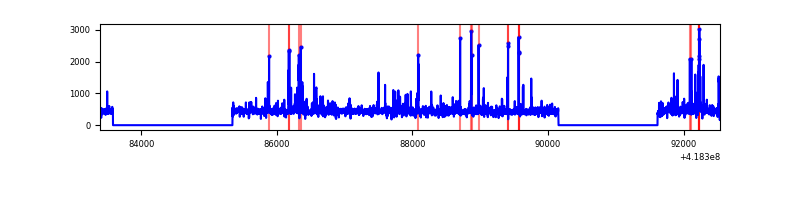 |
Top three noisy pixels from each quadrant. If the there are fewer than three noisy pixels in the level2.evt file, extra rows are filled as -1
| Pixel properties | Quadrant properties | ||||||
|---|---|---|---|---|---|---|---|
| Quadrant | DetID | PixID | Counts | Sigma | Mean | Median | Sigma |
| A | 10 | 83 | 502439 | 3719.61 | 655 | 641 | 134.9 |
| A | 13 | 254 | 7536 | 51.11 | 655 | 641 | 134.9 |
| A | 3 | 137 | 7445 | 50.44 | 655 | 641 | 134.9 |
| B | 0 | 229 | 475468 | 3723.12 | 647 | 629 | 127.5 |
| B | 0 | 190 | 182997 | 1429.91 | 647 | 629 | 127.5 |
| B | 12 | 111 | 16224 | 122.28 | 647 | 629 | 127.5 |
| C | 15 | 214 | 259956 | 1735.67 | 636 | 638 | 149.4 |
| C | 14 | 254 | 56319 | 372.68 | 636 | 638 | 149.4 |
| C | 10 | 20 | 43282 | 285.42 | 636 | 638 | 149.4 |
| D | 12 | 191 | 184546 | 1231.93 | 603 | 587 | 149.3 |
| D | 2 | 250 | 136853 | 912.54 | 603 | 587 | 149.3 |
| D | 5 | 51 | 104780 | 697.76 | 603 | 587 | 149.3 |
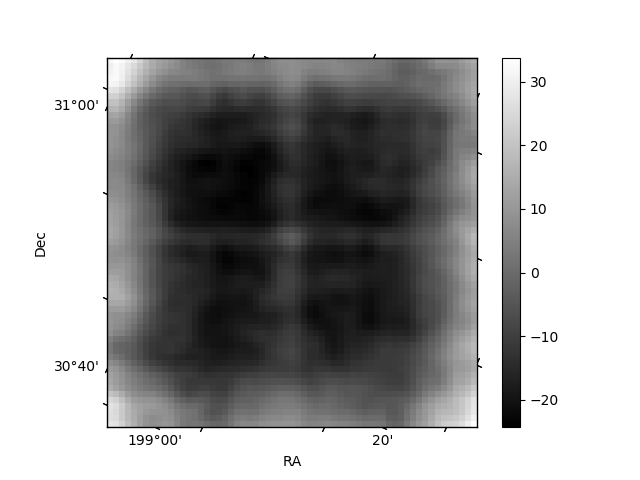
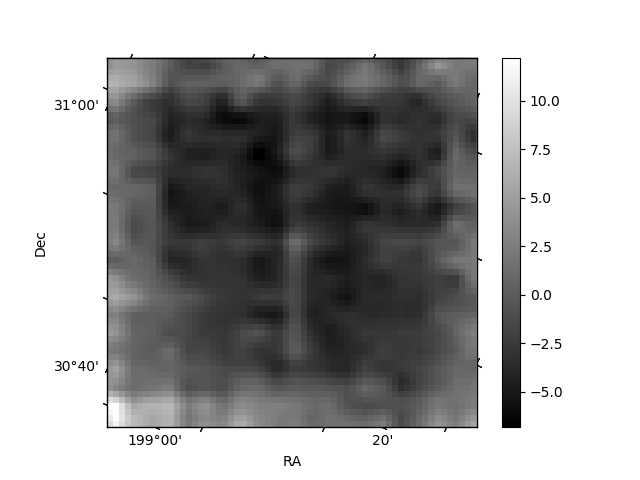
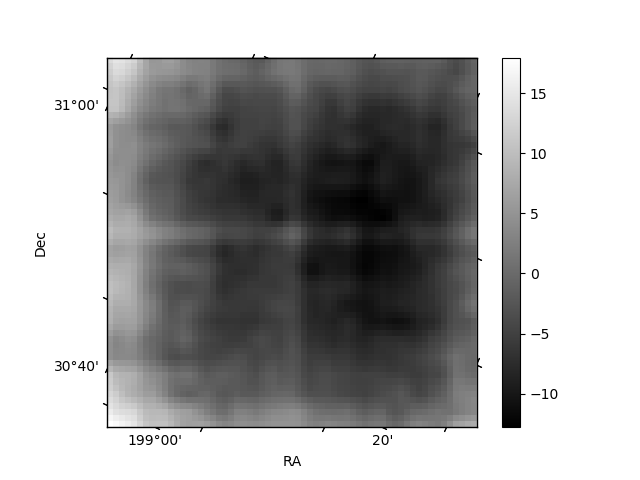
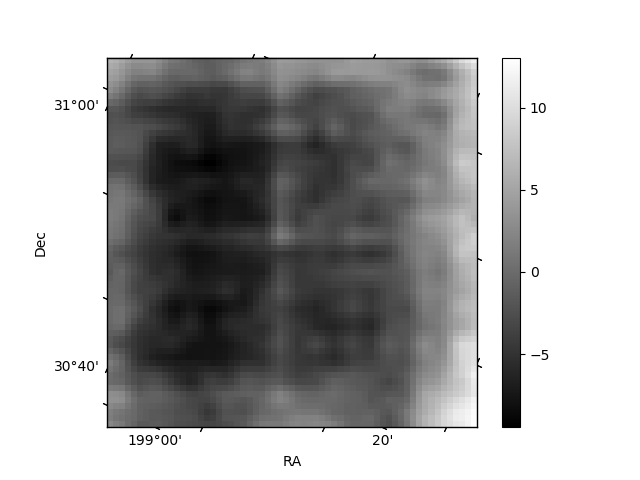
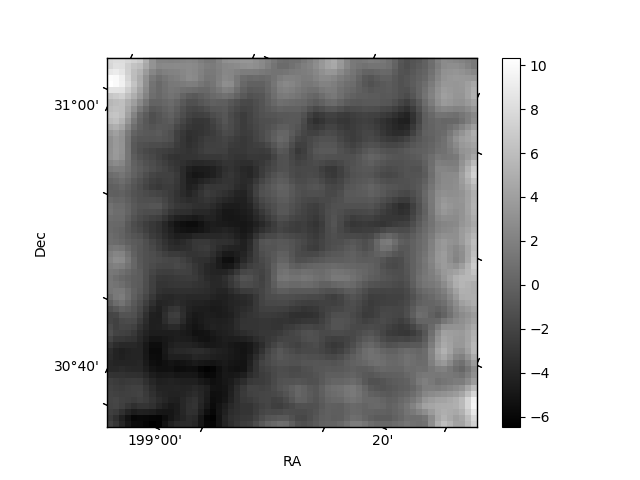
Histogram calculated using DETX and DETY for each event in the final _common_clean file
| Quadrant A | 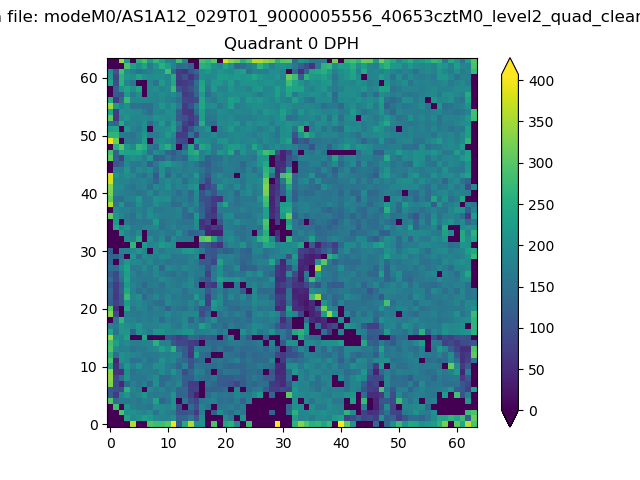 |
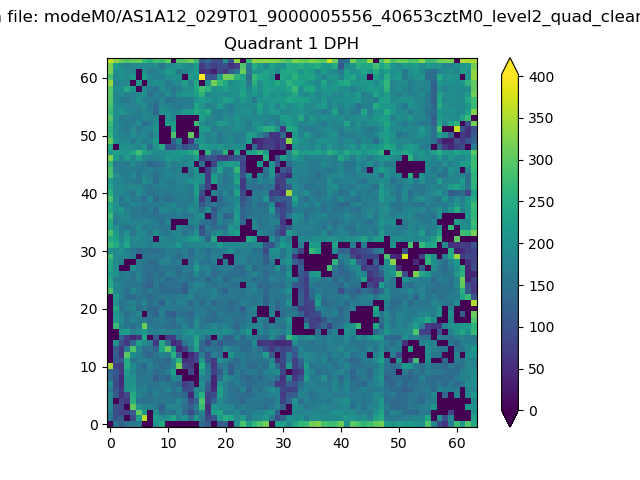 |
Quadrant B |
|---|---|---|---|
| Quadrant D | 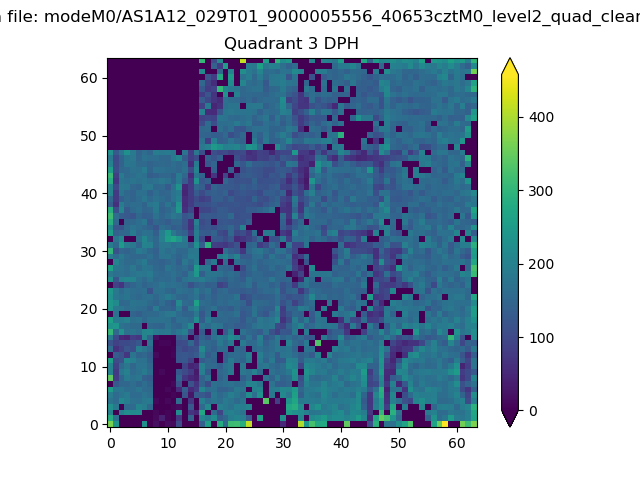 |
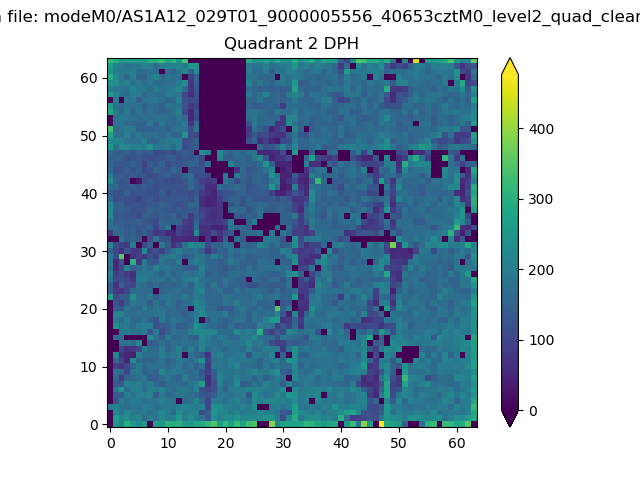 |
Quadrant C |
| Plot type | Count rate plots | Images |
|---|---|---|
| Comparison with Poisson distribution Blue bars denote a histogram of data divided into 1 sec bins. Red curve is a Poisson curve with rate = median count rate of data. |
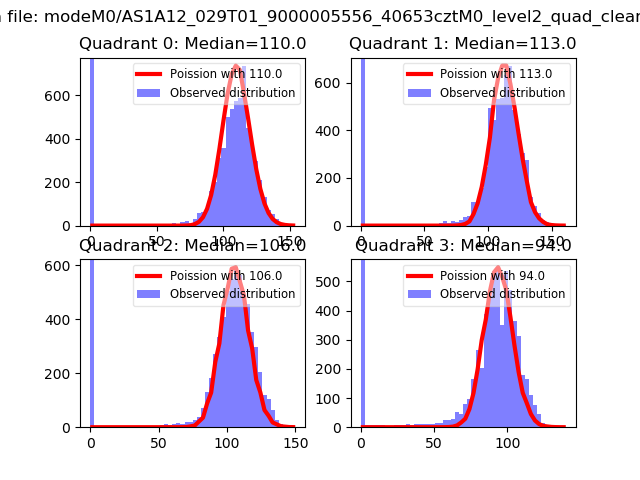 |
 |
| Quadrant-wise count rates Data is divided into 100 sec bins |
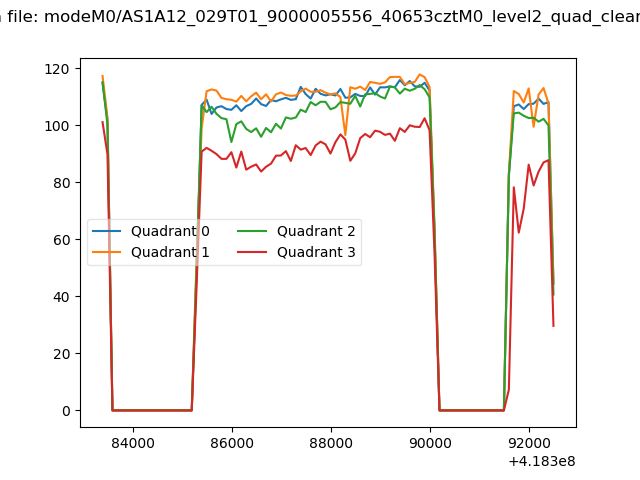 |
|
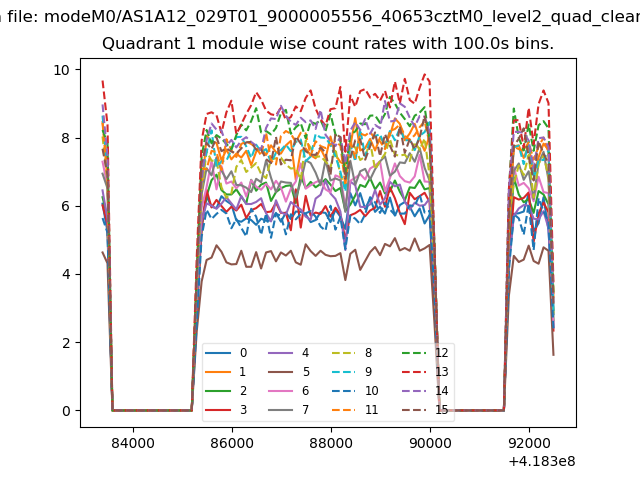
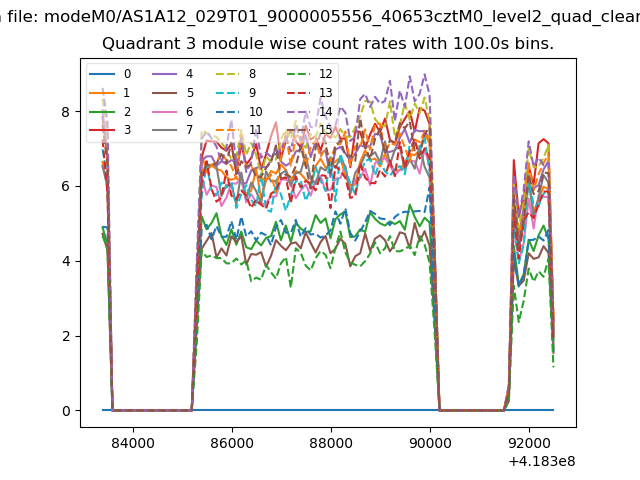
| Module-wise count rates for Quadrant A Data is divided into 100 sec bins |
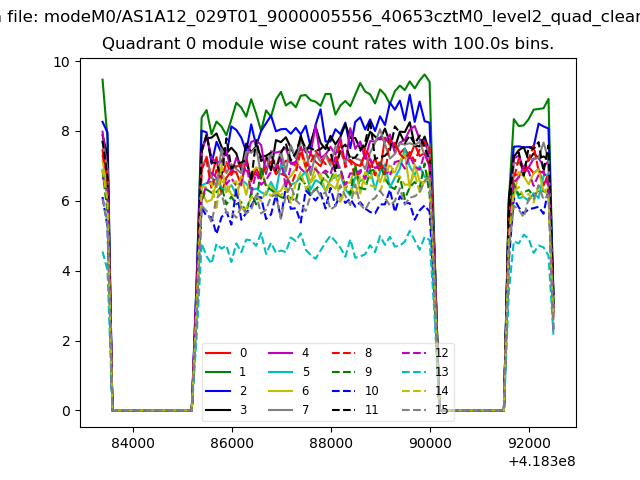 |
 |
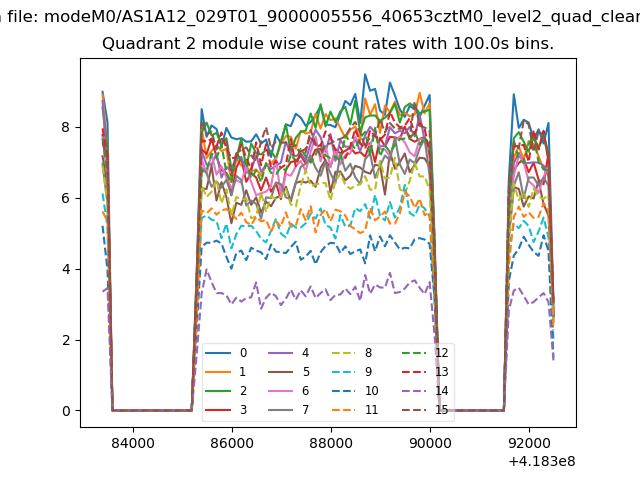
| Module-wise count rates for Quadrant B Data is divided into 100 sec bins |
 |
 |
| Module-wise count rates for Quadrant C Data is divided into 100 sec bins |
 |
 |
| Module-wise count rates for Quadrant D Data is divided into 100 sec bins |
 |
 |
| Parameter | Plot |
|---|---|
| CZT HV Monitor | 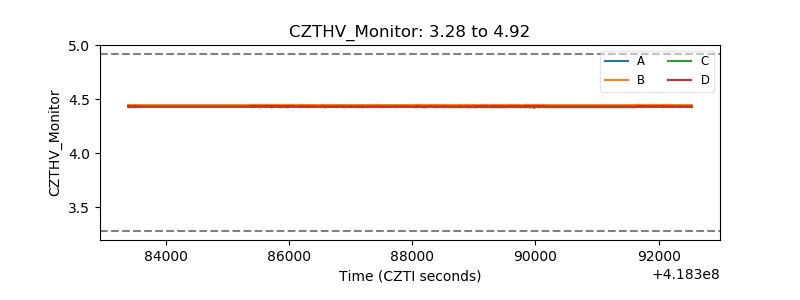 |
| D_VDD | 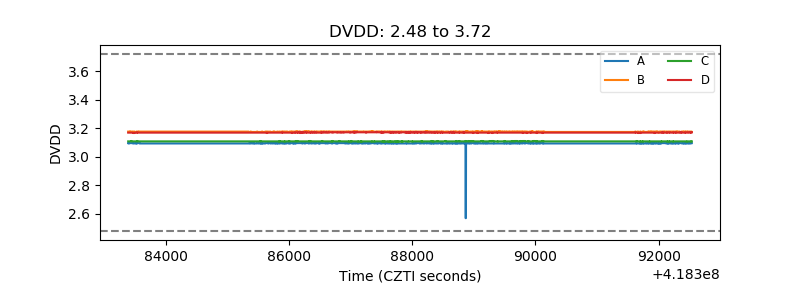 |
| Temperature 1 | 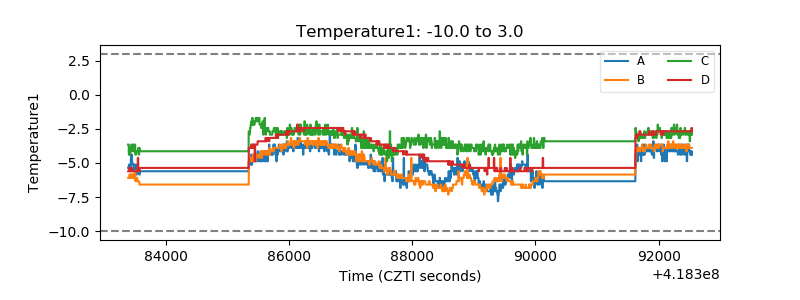 |
| Veto HV Monitor | 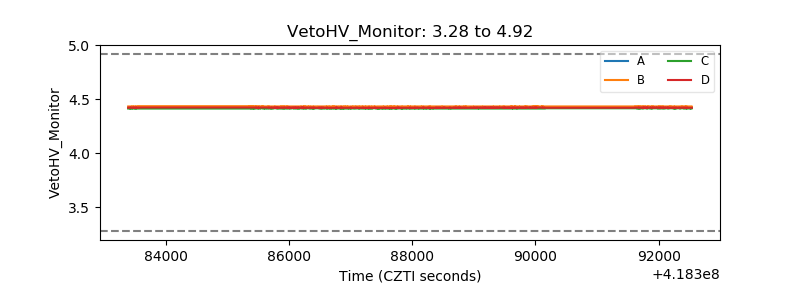 |
| Veto LLD | 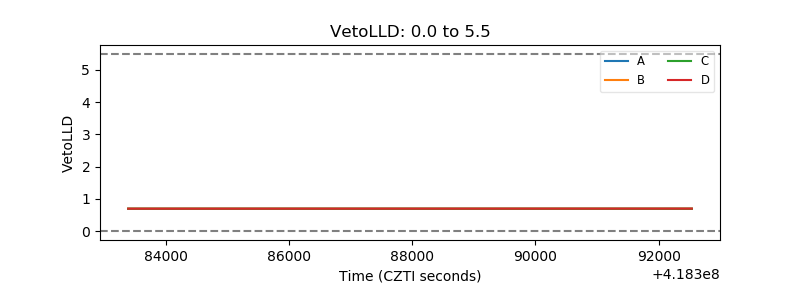 |
| Alpha Counter | 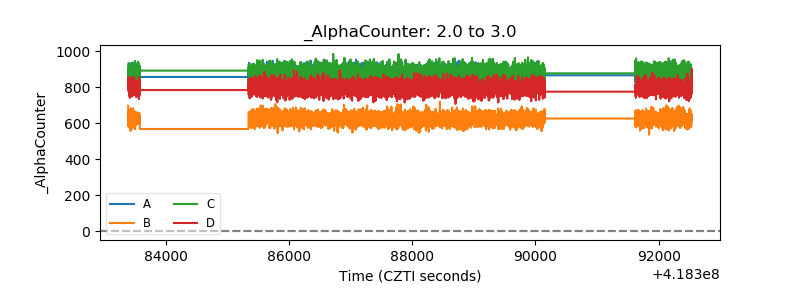 |
| _CPM_Rate | 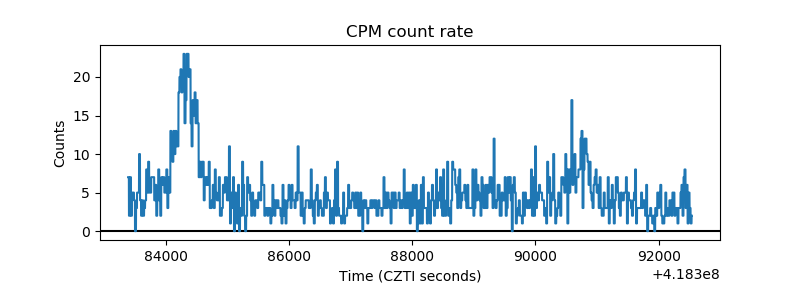 |
| CZT Counter | 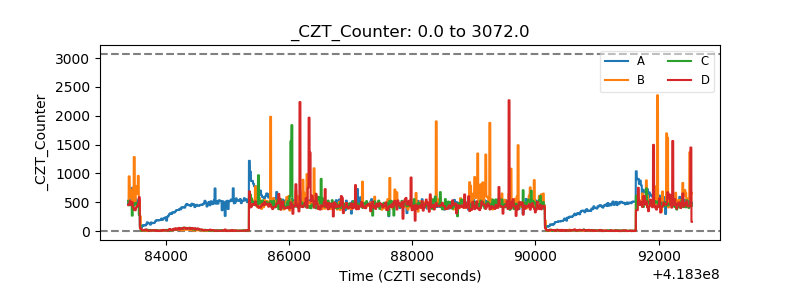 |
| +2.5 Volts monitor | 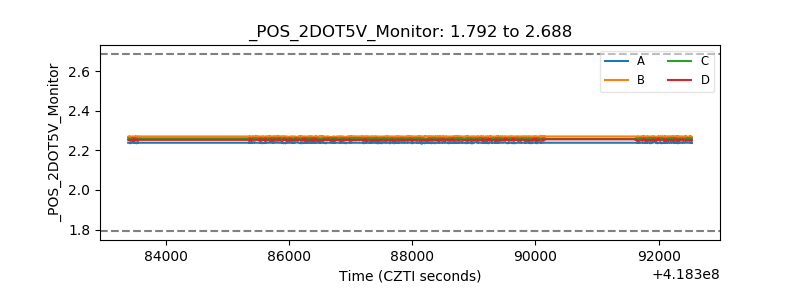 |
| +5 Volts monitor | 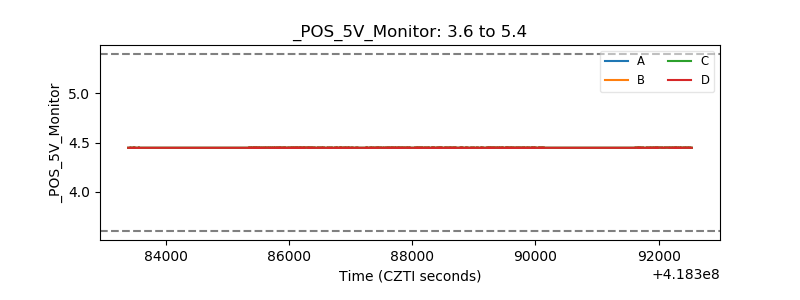 |
| _ROLL_ROT | 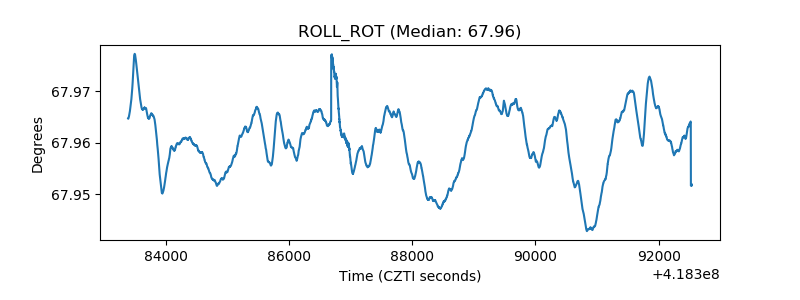 |
| _Roll_DEC | 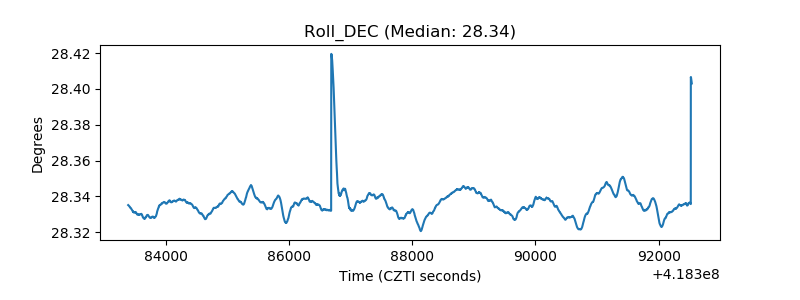 |
| _Roll_RA | 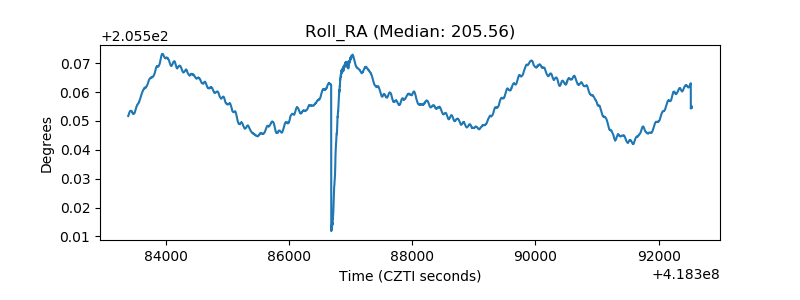 |
| Veto Counter | 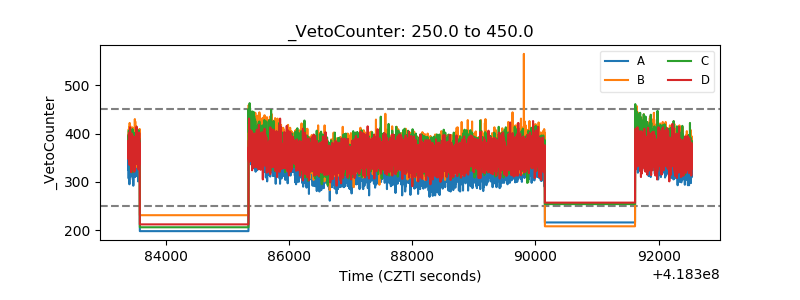 |