| Param | Original file | Final file |
|---|---|---|
| Filename | modeM0/AS1A12_029T01_9000005556_40657cztM0_level2.fits | modeM0/AS1A12_029T01_9000005556_40657cztM0_level2_quad_clean.evt |
| Size (bytes) | 954,967,680 | 255,139,200 |
| Size | 910.7 MB | 243.3 MB |
| Events in quadrant A | 8,088,651 | 1,736,520 |
| Events in quadrant B | 9,144,502 | 1,762,596 |
| Events in quadrant C | 7,576,734 | 1,702,593 |
| Events in quadrant D | 9,292,492 | 1,413,806 |
| Mode M0 | |||
|---|---|---|---|
| Quadrant | BADHDUFLAG | Total packets | Discarded packets |
| A | 0 | 34069 | 5 |
| B | 0 | 38029 | 4 |
| C | 0 | 32679 | 4 |
| D | 0 | 38927 | 4 |
| Mode M9 | |||
|---|---|---|---|
| Quadrant | BADHDUFLAG | Total packets | Discarded packets |
| A | 0 | 54 | 0 |
| B | 0 | 54 | 0 |
| C | 0 | 54 | 0 |
| D | 0 | 54 | 0 |
| Mode SS | |||
|---|---|---|---|
| Quadrant | BADHDUFLAG | Total packets | Discarded packets |
| A | 0 | 330 | 0 |
| B | 0 | 330 | 0 |
| C | 0 | 330 | 0 |
| D | 0 | 330 | 0 |
| Quadrant | Total seconds | Saturated seconds | Saturation percentage |
|---|---|---|---|
| A | 16078 | 24 | 0.149272% |
| B | 16078 | 314 | 1.952979% |
| C | 16078 | 21 | 0.130613% |
| D | 16078 | 1787 | 11.114566% |
Noise dominated data is calculated using 1-second bins in cleaned event files. If a bin has >2000 counts, and if more than 50% of those come from <1% of pixels, then it is considered to be noise-dominated and hence unusable.
| Quadrant | # 1 sec bins | Bins with >0 counts | Bins with >2000 counts | High rate bins dominated by noise | Noise dominated (total time) | Noise dominated (detector-on time) | Marked lightcurve |
|---|---|---|---|---|---|---|---|
| A | 21477 | 16082 | 6 | 6 | 0.03% | 0.04% | 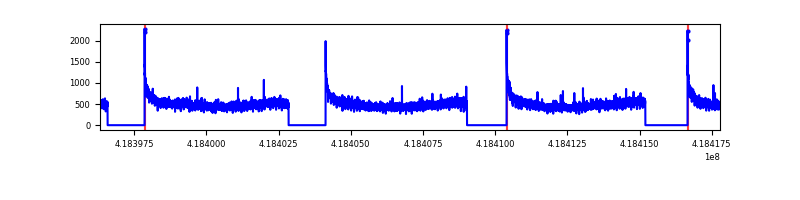 |
| B | 21477 | 16082 | 196 | 196 | 0.91% | 1.22% | 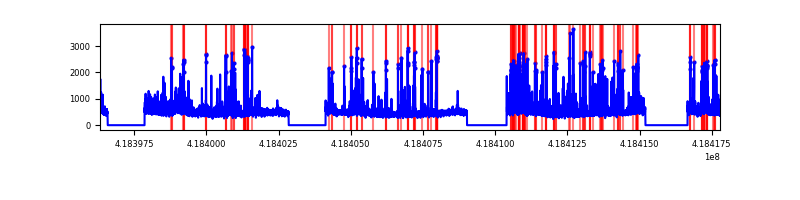 |
| C | 21477 | 16082 | 13 | 13 | 0.06% | 0.08% | 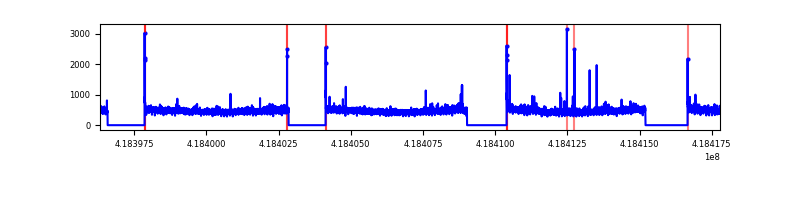 |
| D | 21477 | 16082 | 408 | 408 | 1.90% | 2.54% | 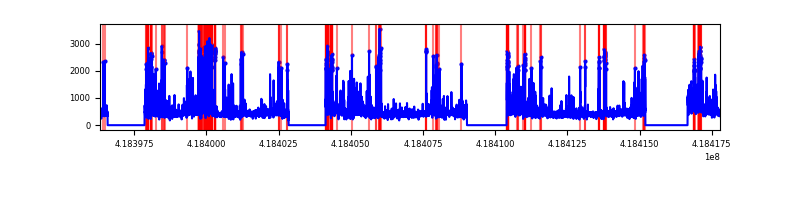 |
Top three noisy pixels from each quadrant. If the there are fewer than three noisy pixels in the level2.evt file, extra rows are filled as -1
| Pixel properties | Quadrant properties | ||||||
|---|---|---|---|---|---|---|---|
| Quadrant | DetID | PixID | Counts | Sigma | Mean | Median | Sigma |
| A | 10 | 83 | 1230539 | 3414.71 | 1762 | 1729 | 359.9 |
| A | 15 | 191 | 36365 | 96.25 | 1762 | 1729 | 359.9 |
| A | 3 | 137 | 20264 | 51.51 | 1762 | 1729 | 359.9 |
| B | 0 | 229 | 1133201 | 3341.57 | 1742 | 1690 | 338.6 |
| B | 0 | 190 | 670133 | 1974.04 | 1742 | 1690 | 338.6 |
| B | 5 | 255 | 242455 | 711.02 | 1742 | 1690 | 338.6 |
| C | 15 | 214 | 696993 | 1732.89 | 1728 | 1741 | 401.2 |
| C | 12 | 249 | 54760 | 132.15 | 1728 | 1741 | 401.2 |
| C | 0 | 10 | 41943 | 100.2 | 1728 | 1741 | 401.2 |
| D | 12 | 227 | 1363868 | 3383.77 | 1623 | 1576 | 402.6 |
| D | 2 | 250 | 625528 | 1549.82 | 1623 | 1576 | 402.6 |
| D | 12 | 191 | 458984 | 1136.15 | 1623 | 1576 | 402.6 |
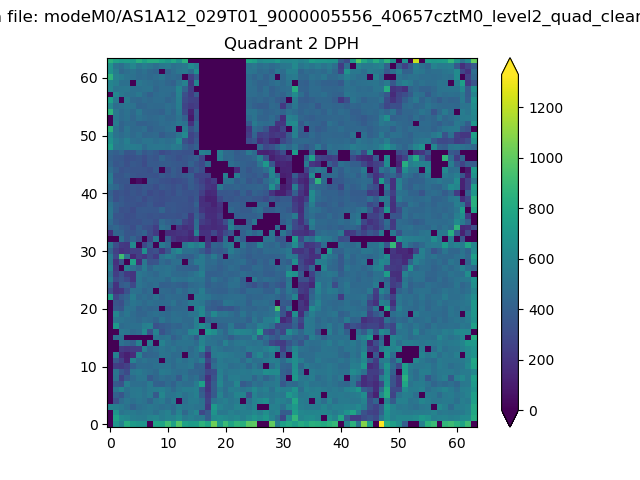
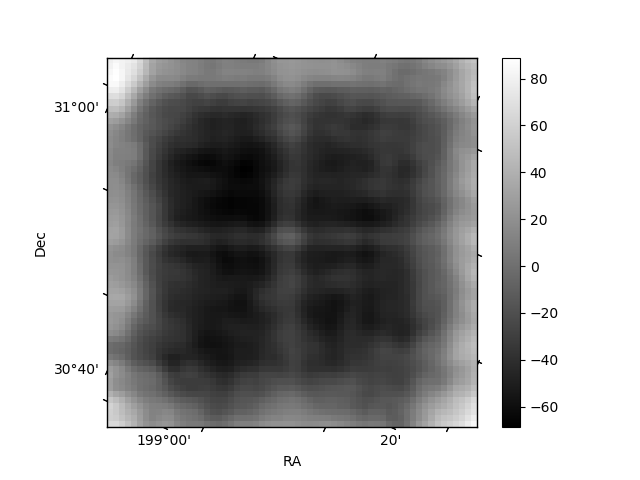
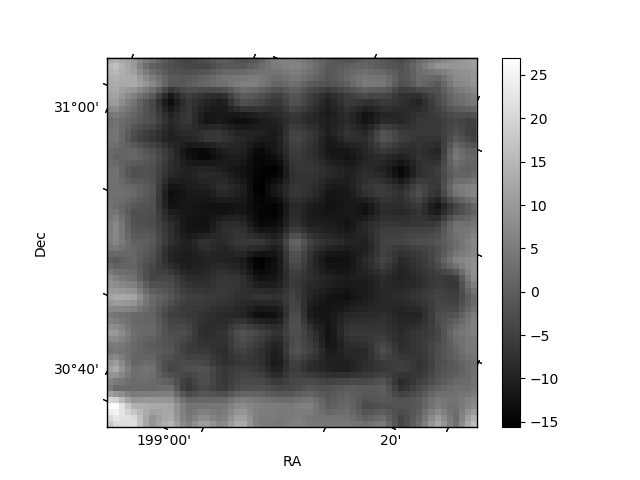
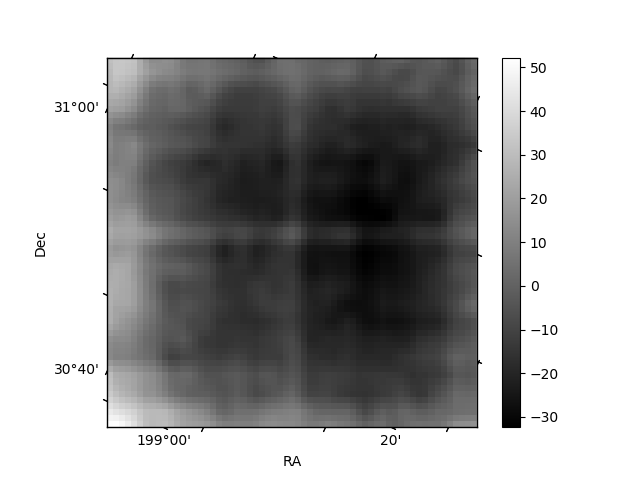
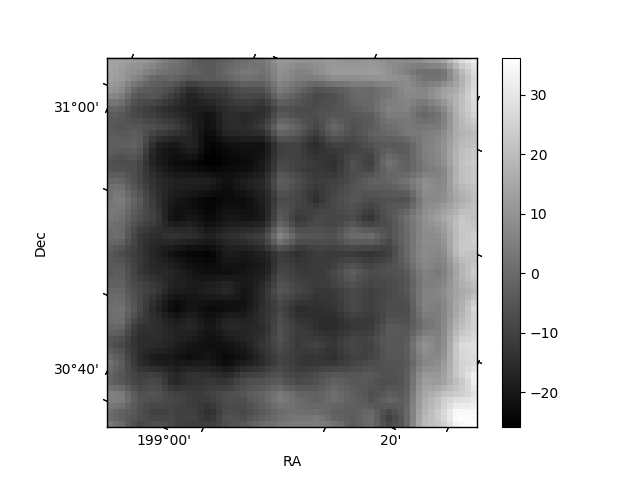
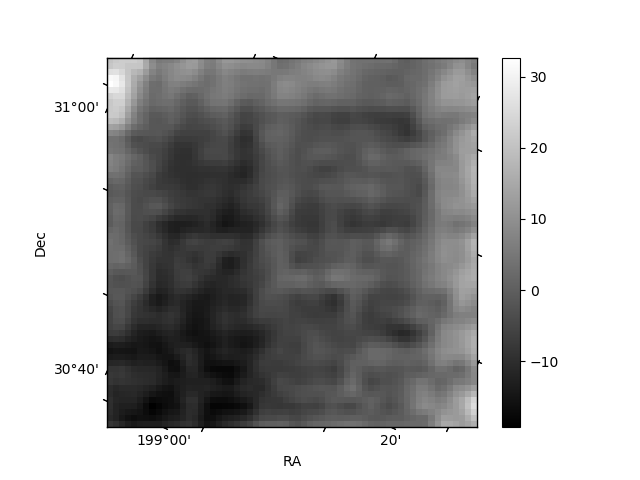
Histogram calculated using DETX and DETY for each event in the final _common_clean file
| Quadrant A | 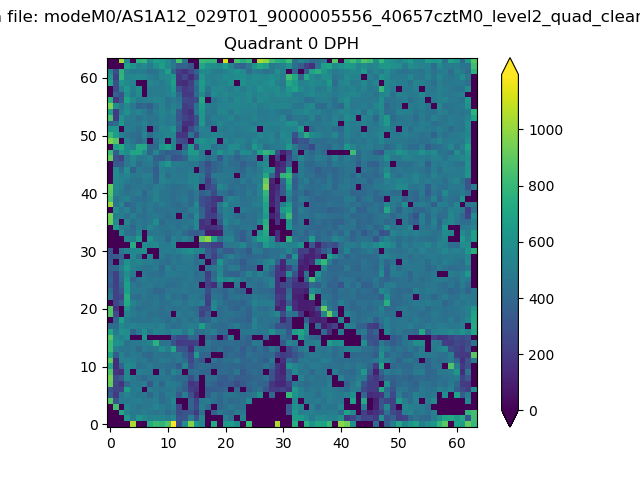 |
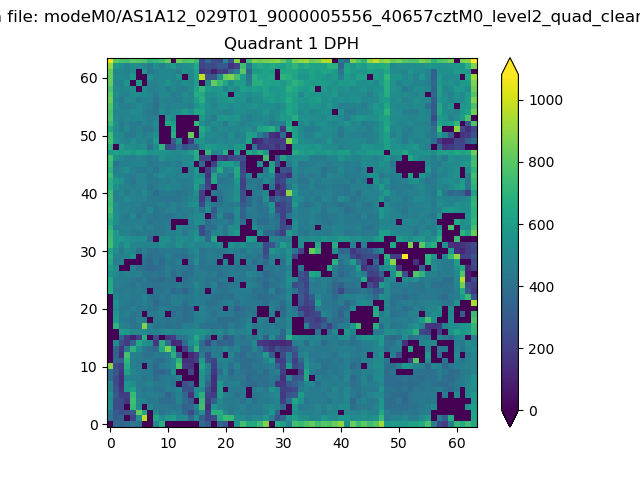 |
Quadrant B |
|---|---|---|---|
| Quadrant D | 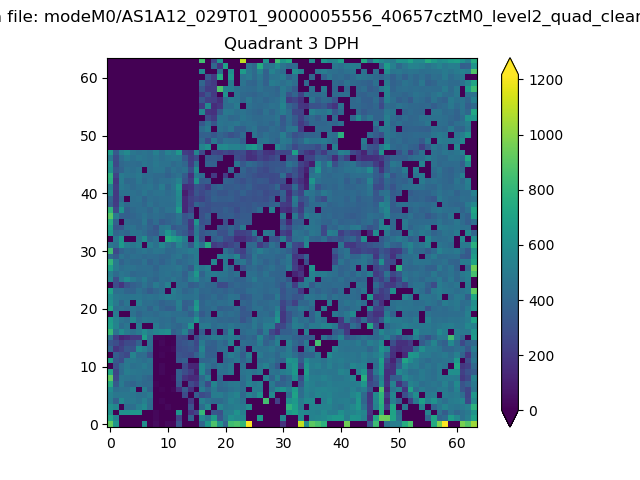 |
 |
Quadrant C |
| Plot type | Count rate plots | Images |
|---|---|---|
| Comparison with Poisson distribution Blue bars denote a histogram of data divided into 1 sec bins. Red curve is a Poisson curve with rate = median count rate of data. |
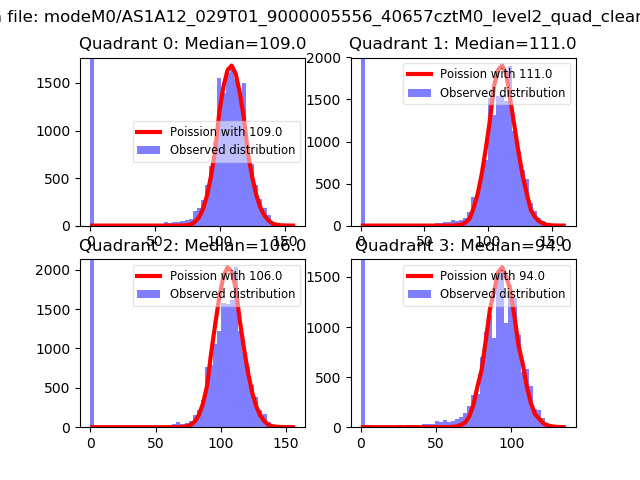 |
 |
| Quadrant-wise count rates Data is divided into 100 sec bins |
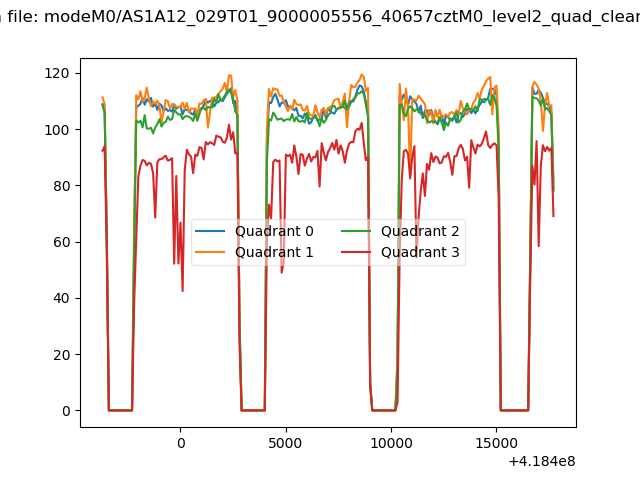 |
|
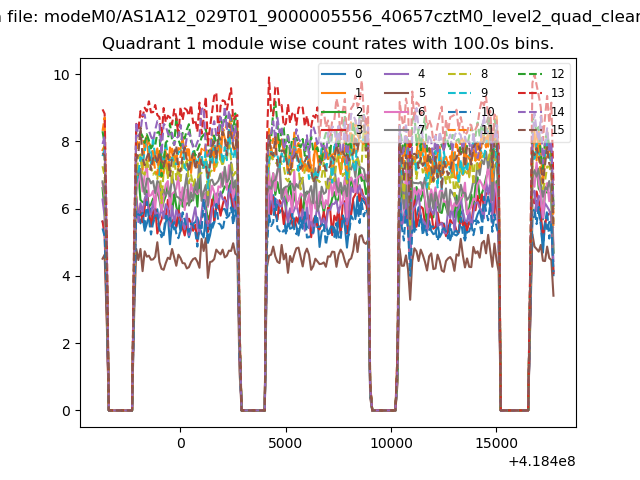
| Module-wise count rates for Quadrant A Data is divided into 100 sec bins |
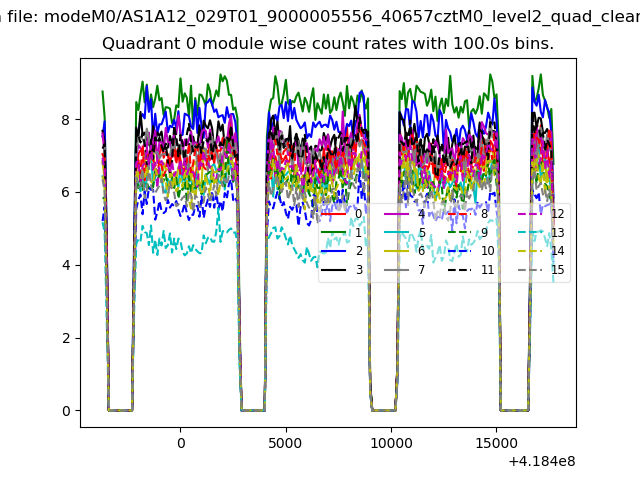 |
 |
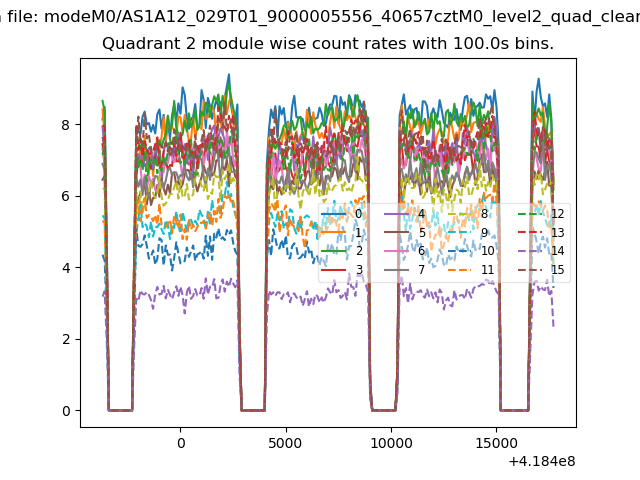
| Module-wise count rates for Quadrant B Data is divided into 100 sec bins |
 |
 |
| Module-wise count rates for Quadrant C Data is divided into 100 sec bins |
 |
 |
| Module-wise count rates for Quadrant D Data is divided into 100 sec bins |
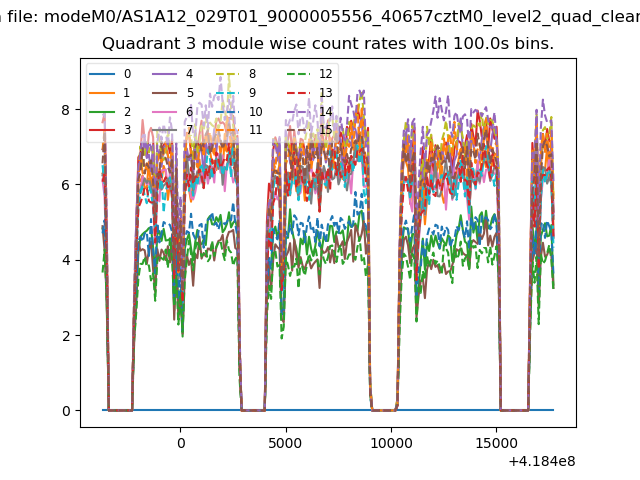 |
 |
| Parameter | Plot |
|---|---|
| CZT HV Monitor | 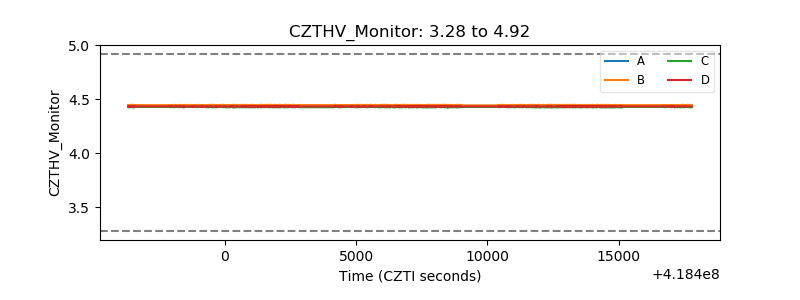 |
| D_VDD | 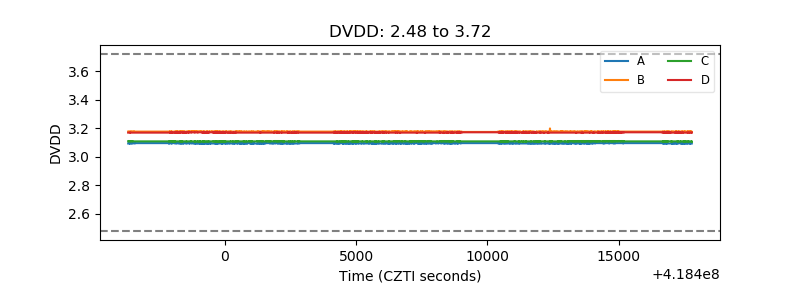 |
| Temperature 1 | 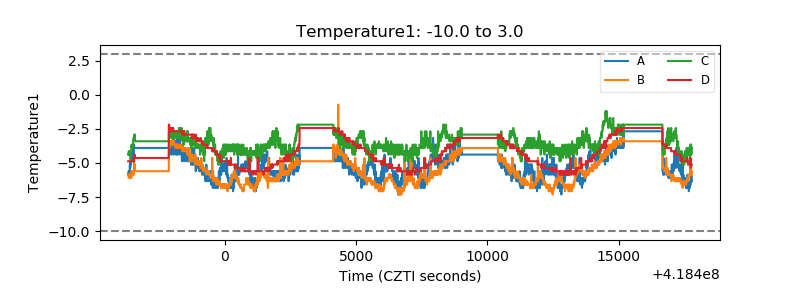 |
| Veto HV Monitor | 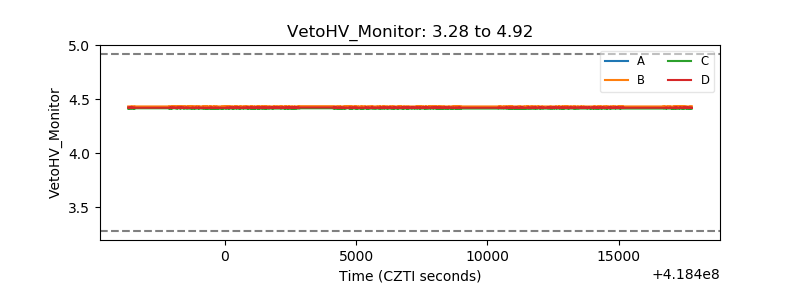 |
| Veto LLD | 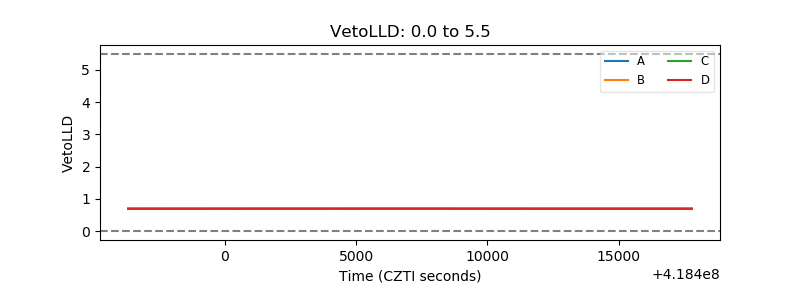 |
| Alpha Counter | 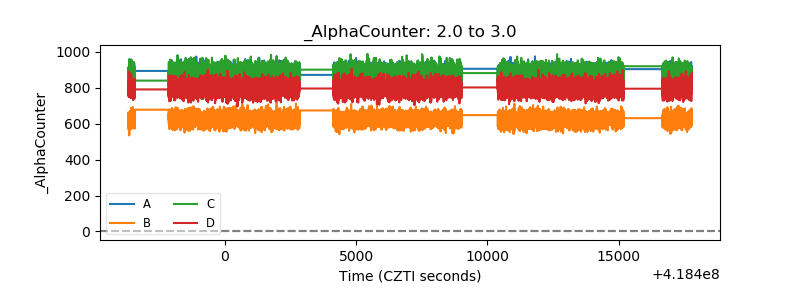 |
| _CPM_Rate | 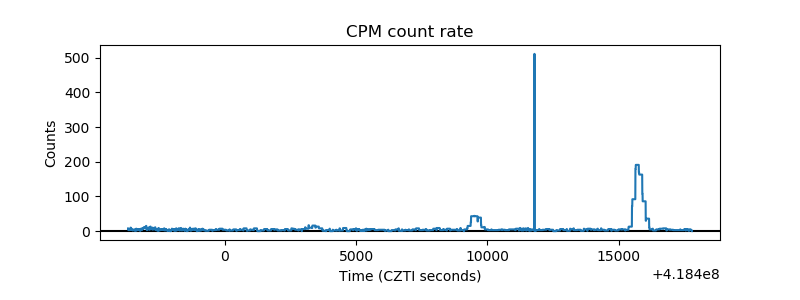 |
| CZT Counter | 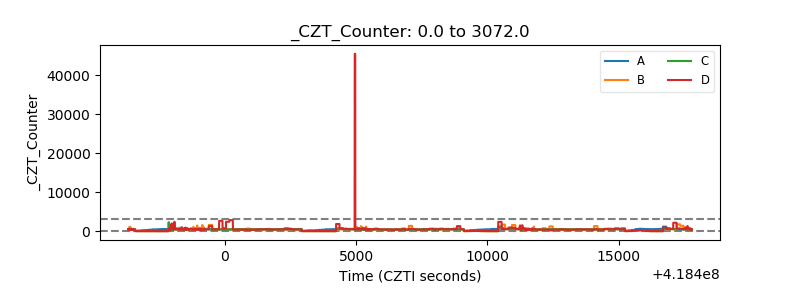 |
| +2.5 Volts monitor | 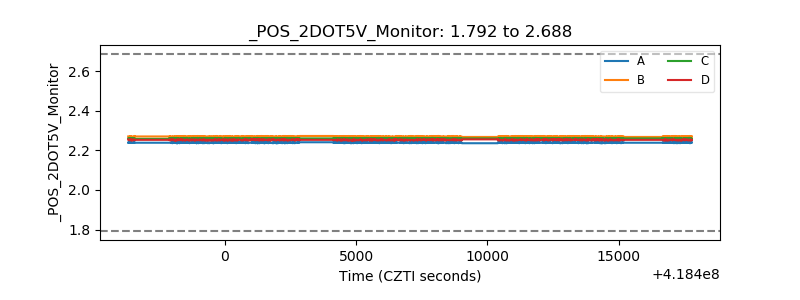 |
| +5 Volts monitor | 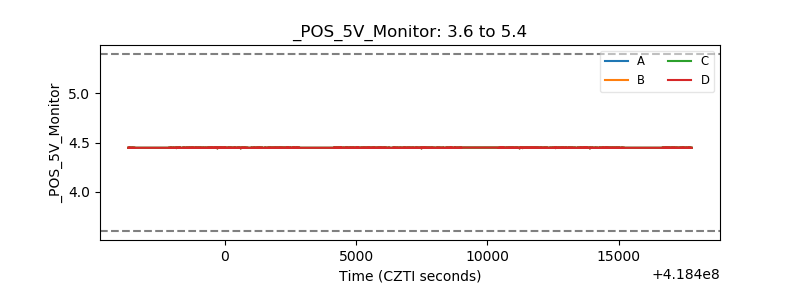 |
| _ROLL_ROT | 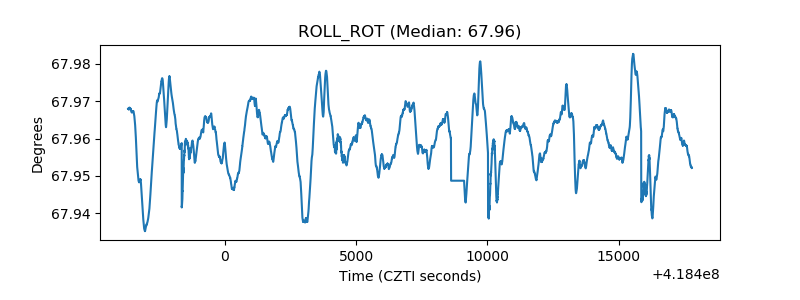 |
| _Roll_DEC | 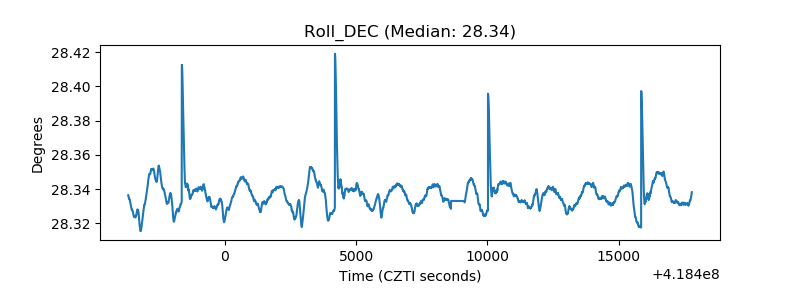 |
| _Roll_RA | 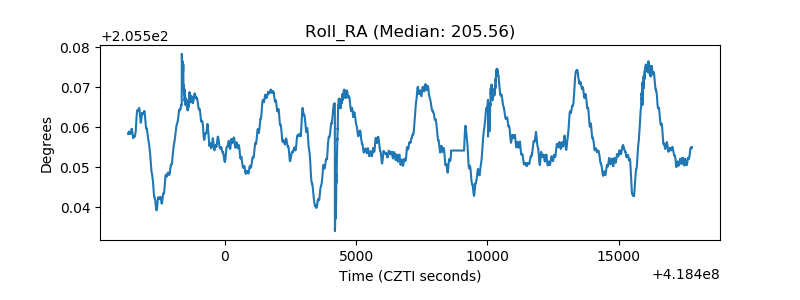 |
| Veto Counter | 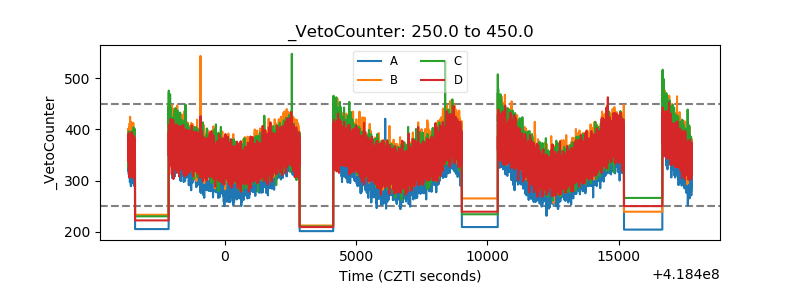 |