| Param | Original file | Final file |
|---|---|---|
| Filename | modeM0/AS1A12_029T01_9000005556_40658cztM0_level2.fits | modeM0/AS1A12_029T01_9000005556_40658cztM0_level2_quad_clean.evt |
| Size (bytes) | 417,625,920 | 86,927,040 |
| Size | 398.3 MB | 82.9 MB |
| Events in quadrant A | 2,860,058 | 609,540 |
| Events in quadrant B | 3,142,366 | 624,535 |
| Events in quadrant C | 2,723,791 | 604,112 |
| Events in quadrant D | 6,295,970 | 401,484 |
| Mode M0 | |||
|---|---|---|---|
| Quadrant | BADHDUFLAG | Total packets | Discarded packets |
| A | 0 | 12113 | 3 |
| B | 0 | 13186 | 2 |
| C | 0 | 11674 | 2 |
| D | 0 | 22612 | 2 |
| Mode M9 | |||
|---|---|---|---|
| Quadrant | BADHDUFLAG | Total packets | Discarded packets |
| A | 0 | 31 | 0 |
| B | 0 | 31 | 0 |
| C | 0 | 31 | 0 |
| D | 0 | 31 | 0 |
| Mode SS | |||
|---|---|---|---|
| Quadrant | BADHDUFLAG | Total packets | Discarded packets |
| A | 0 | 116 | 0 |
| B | 0 | 116 | 0 |
| C | 0 | 116 | 0 |
| D | 0 | 116 | 0 |
| Quadrant | Total seconds | Saturated seconds | Saturation percentage |
|---|---|---|---|
| A | 5607 | 13 | 0.231853% |
| B | 5607 | 94 | 1.676476% |
| C | 5607 | 20 | 0.356697% |
| D | 5607 | 1678 | 29.926877% |
Noise dominated data is calculated using 1-second bins in cleaned event files. If a bin has >2000 counts, and if more than 50% of those come from <1% of pixels, then it is considered to be noise-dominated and hence unusable.
| Quadrant | # 1 sec bins | Bins with >0 counts | Bins with >2000 counts | High rate bins dominated by noise | Noise dominated (total time) | Noise dominated (detector-on time) | Marked lightcurve |
|---|---|---|---|---|---|---|---|
| A | 8683 | 5609 | 8 | 8 | 0.09% | 0.14% | 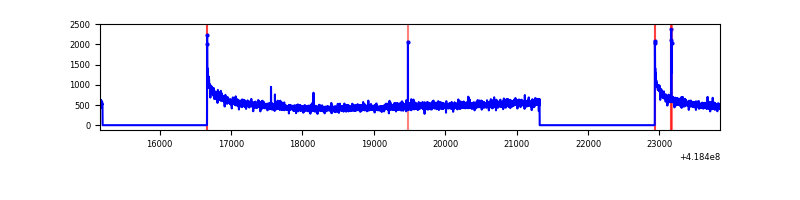 |
| B | 8683 | 5609 | 50 | 50 | 0.58% | 0.89% | 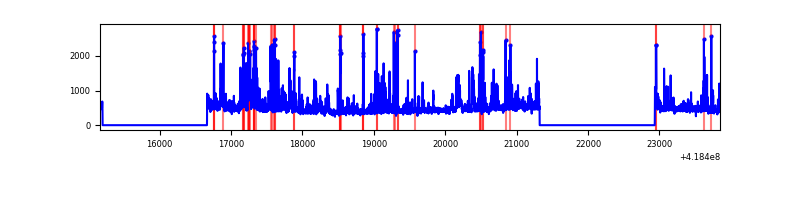 |
| C | 8683 | 5609 | 17 | 17 | 0.20% | 0.30% | 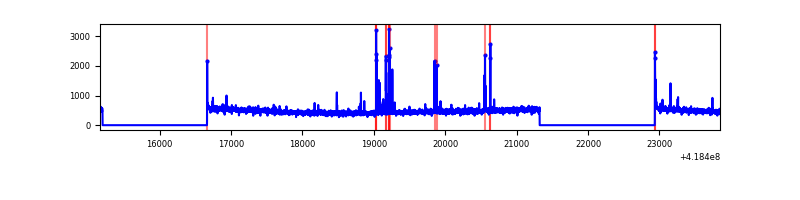 |
| D | 8683 | 5609 | 1352 | 1352 | 15.57% | 24.10% | 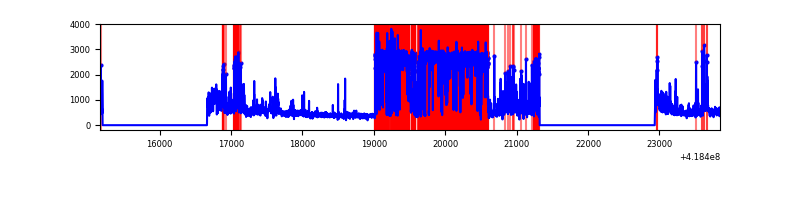 |
Top three noisy pixels from each quadrant. If the there are fewer than three noisy pixels in the level2.evt file, extra rows are filled as -1
| Pixel properties | Quadrant properties | ||||||
|---|---|---|---|---|---|---|---|
| Quadrant | DetID | PixID | Counts | Sigma | Mean | Median | Sigma |
| A | 10 | 83 | 484076 | 3827.09 | 608 | 595 | 126.3 |
| A | 15 | 191 | 14414 | 109.39 | 608 | 595 | 126.3 |
| A | 9 | 191 | 8989 | 66.44 | 608 | 595 | 126.3 |
| B | 0 | 229 | 390300 | 3305.74 | 603 | 586 | 117.9 |
| B | 0 | 190 | 314567 | 2663.34 | 603 | 586 | 117.9 |
| B | 4 | 171 | 29227 | 242.95 | 603 | 586 | 117.9 |
| C | 15 | 214 | 246470 | 1738.68 | 600 | 603 | 141.4 |
| C | 14 | 254 | 77396 | 543.05 | 600 | 603 | 141.4 |
| C | 12 | 249 | 32324 | 224.32 | 600 | 603 | 141.4 |
| D | 12 | 227 | 4019335 | 32840.28 | 486 | 472 | 122.4 |
| D | 12 | 191 | 118077 | 961.01 | 486 | 472 | 122.4 |
| D | 2 | 250 | 92005 | 747.97 | 486 | 472 | 122.4 |
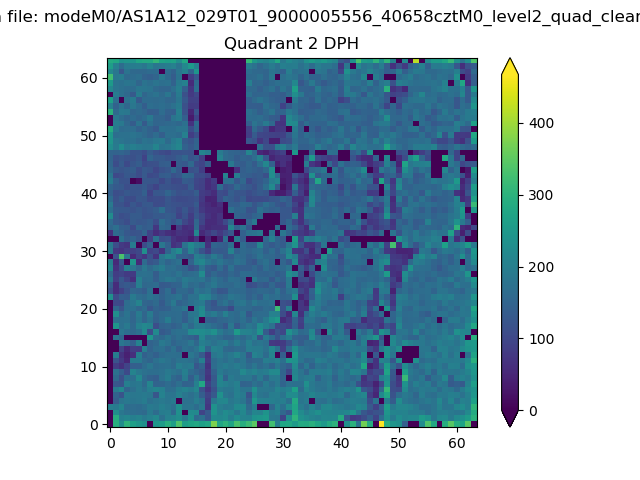
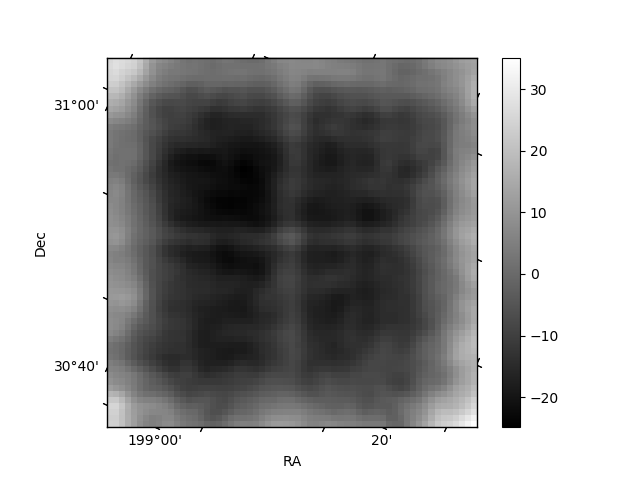
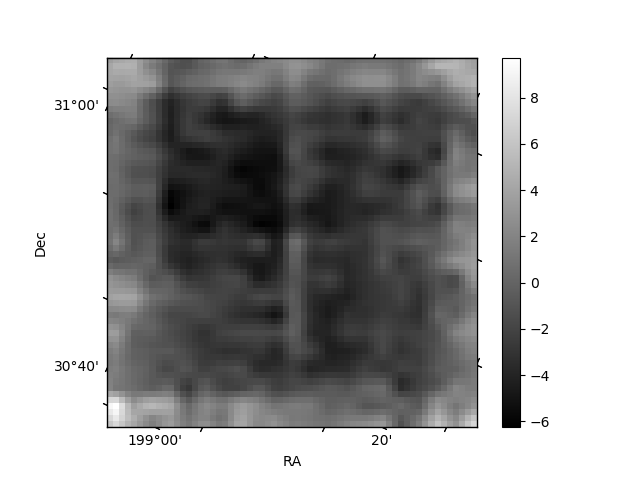
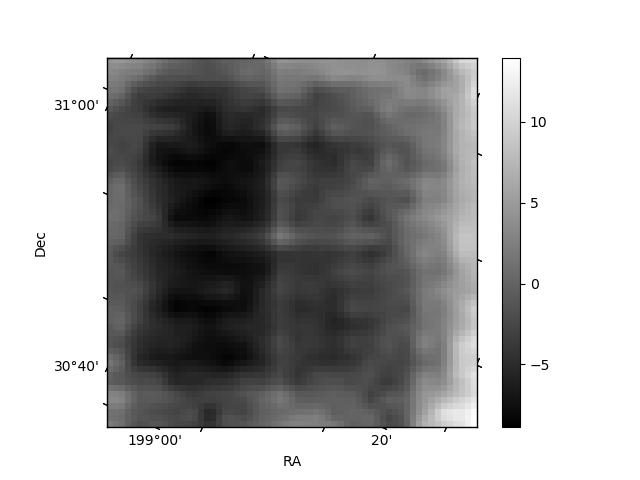
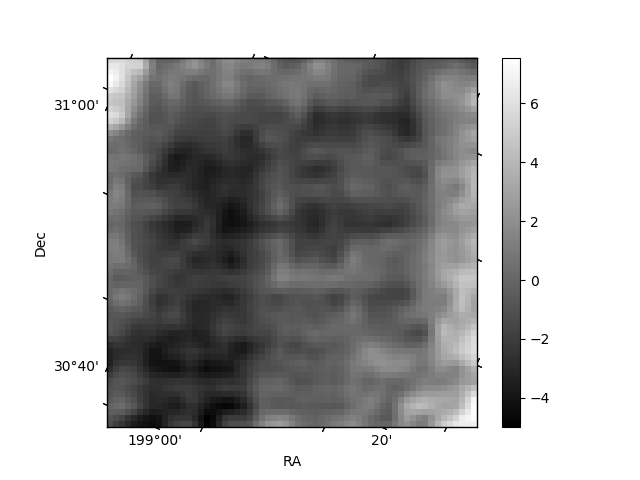
Histogram calculated using DETX and DETY for each event in the final _common_clean file
| Quadrant A | 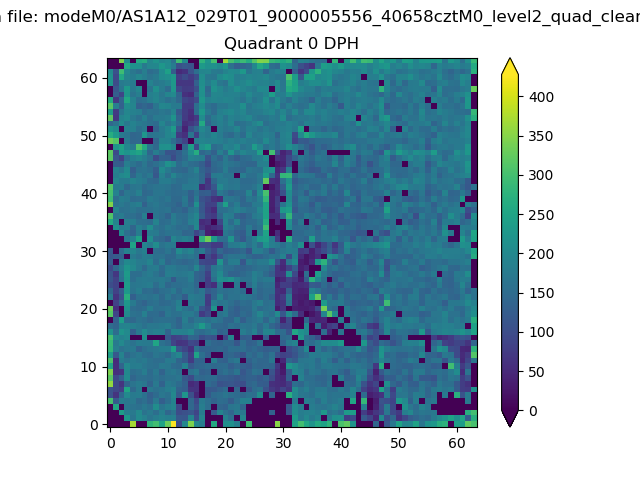 |
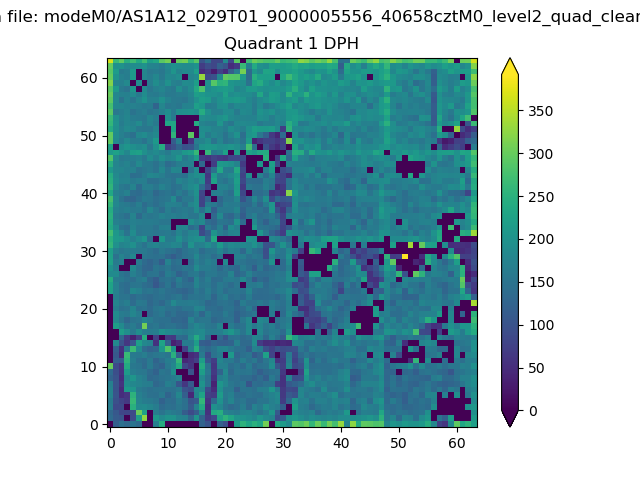 |
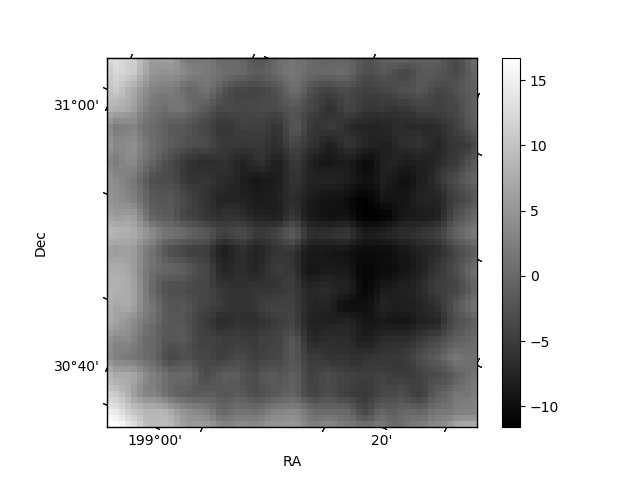
Quadrant B |
|---|---|---|---|
| Quadrant D | 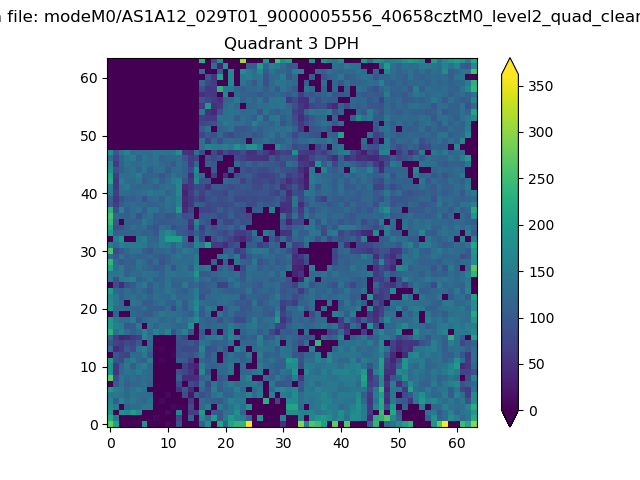 |
 |
Quadrant C |
| Plot type | Count rate plots | Images |
|---|---|---|
| Comparison with Poisson distribution Blue bars denote a histogram of data divided into 1 sec bins. Red curve is a Poisson curve with rate = median count rate of data. |
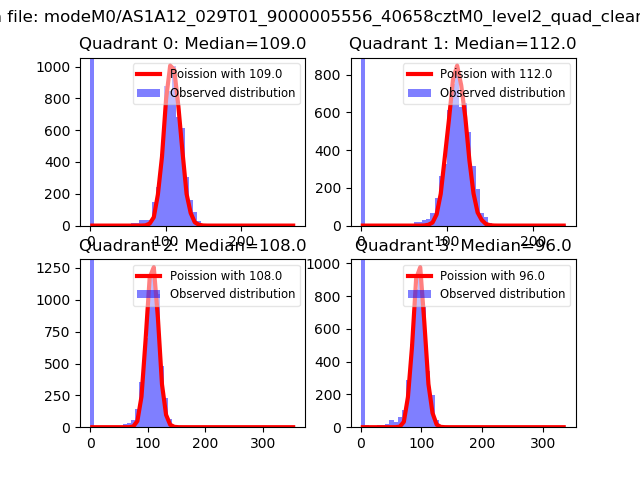 |
 |
| Quadrant-wise count rates Data is divided into 100 sec bins |
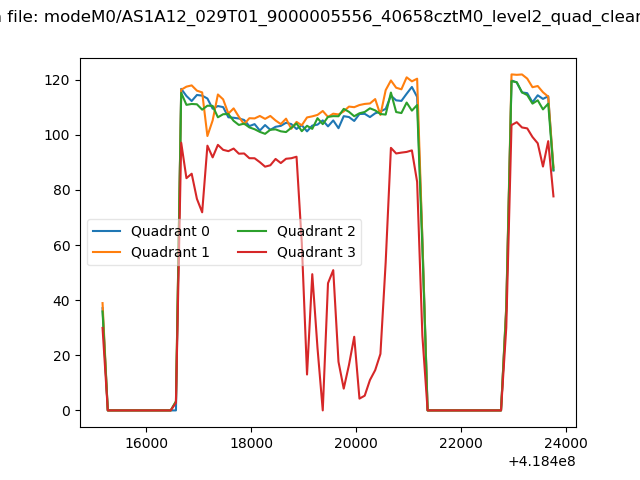 |
|
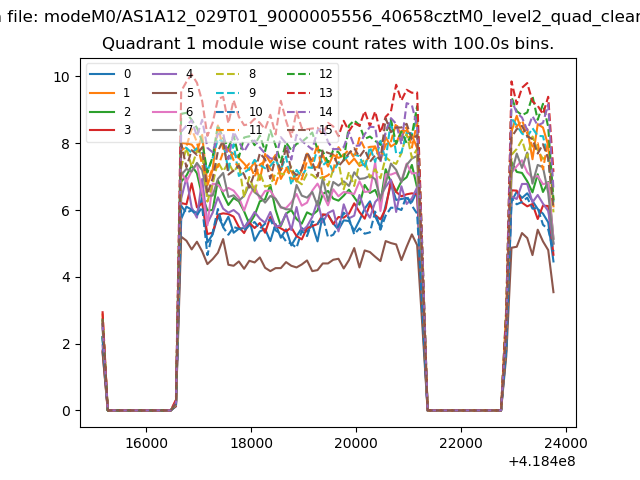
| Module-wise count rates for Quadrant A Data is divided into 100 sec bins |
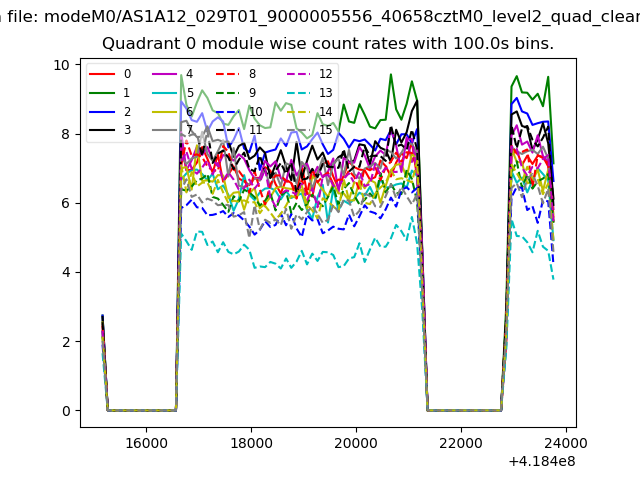 |
 |
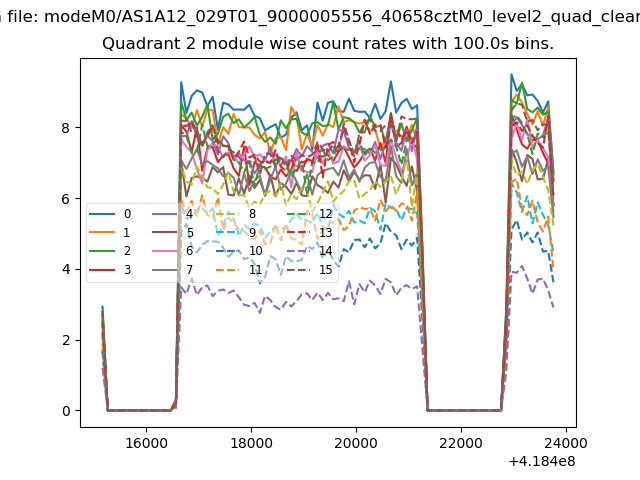
| Module-wise count rates for Quadrant B Data is divided into 100 sec bins |
 |
 |
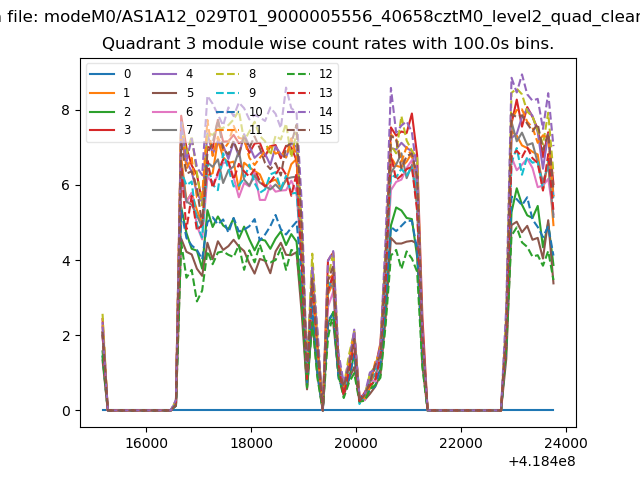
| Module-wise count rates for Quadrant C Data is divided into 100 sec bins |
 |
 |
| Module-wise count rates for Quadrant D Data is divided into 100 sec bins |
 |
 |
| Parameter | Plot |
|---|---|
| CZT HV Monitor | 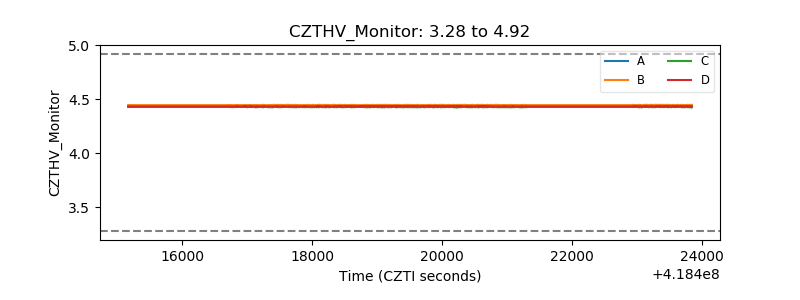 |
| D_VDD | 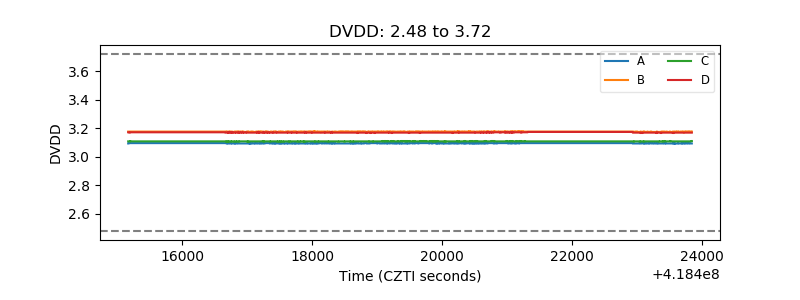 |
| Temperature 1 | 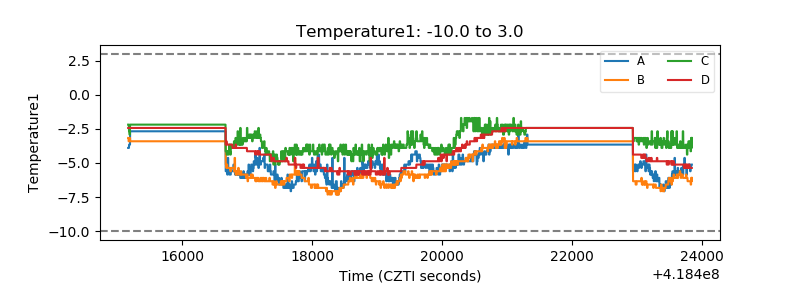 |
| Veto HV Monitor | 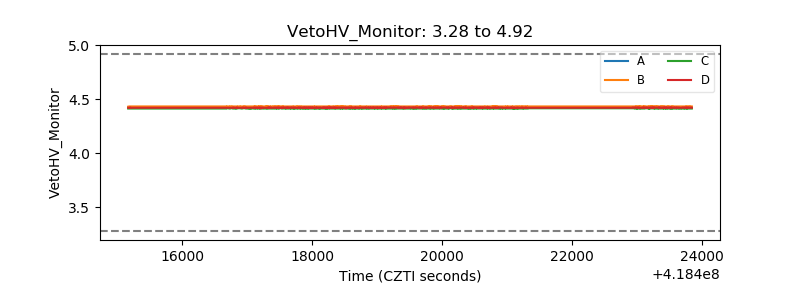 |
| Veto LLD | 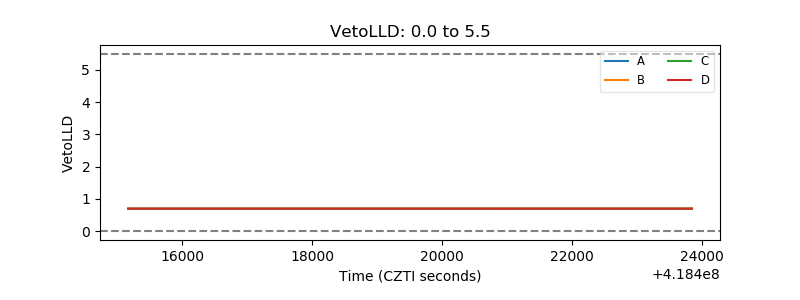 |
| Alpha Counter | 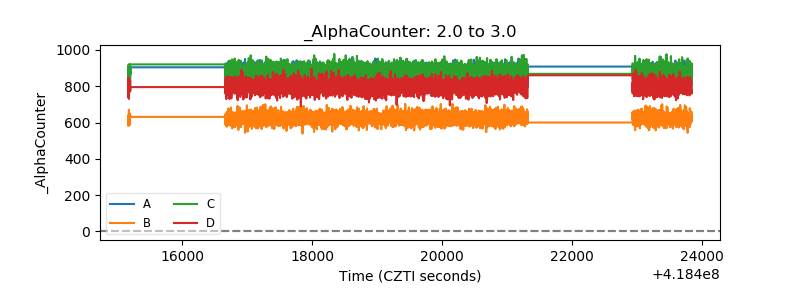 |
| _CPM_Rate | 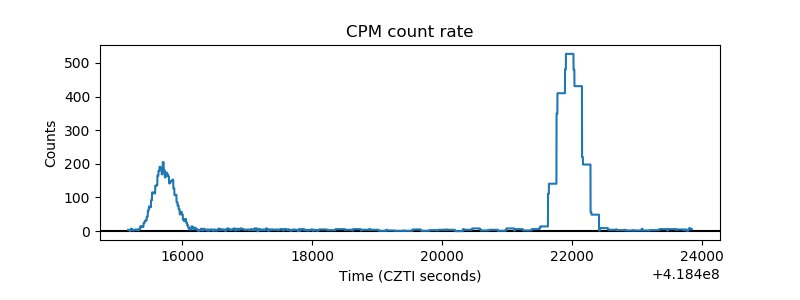 |
| CZT Counter | 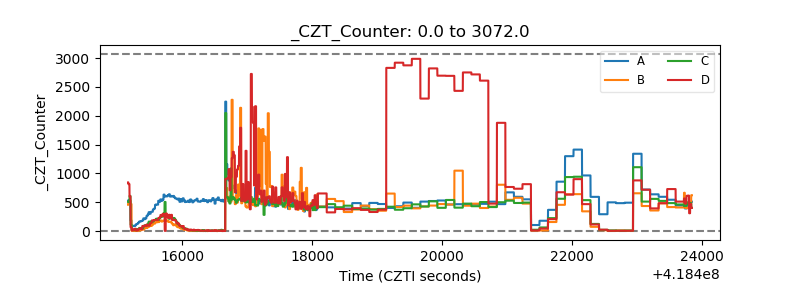 |
| +2.5 Volts monitor | 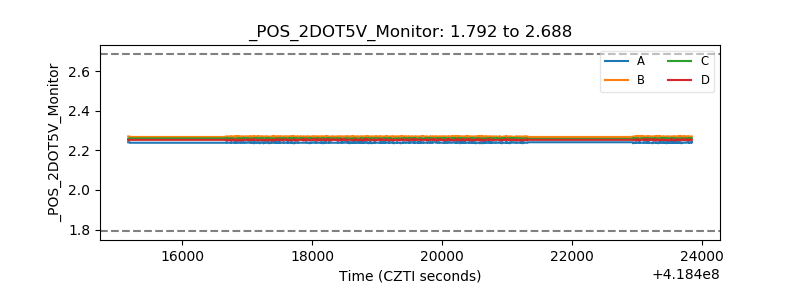 |
| +5 Volts monitor | 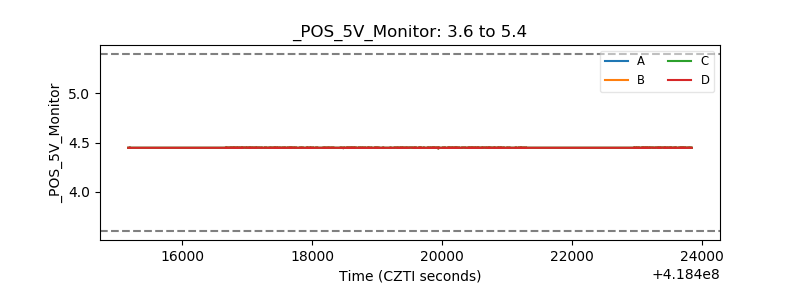 |
| _ROLL_ROT | 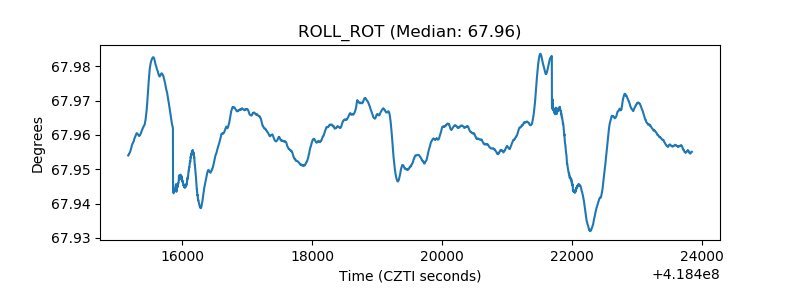 |
| _Roll_DEC | 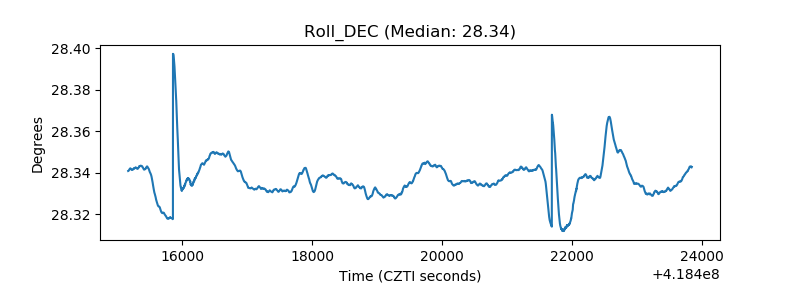 |
| _Roll_RA | 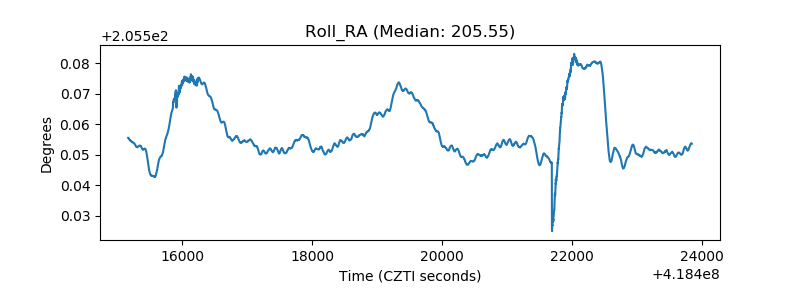 |
| Veto Counter | 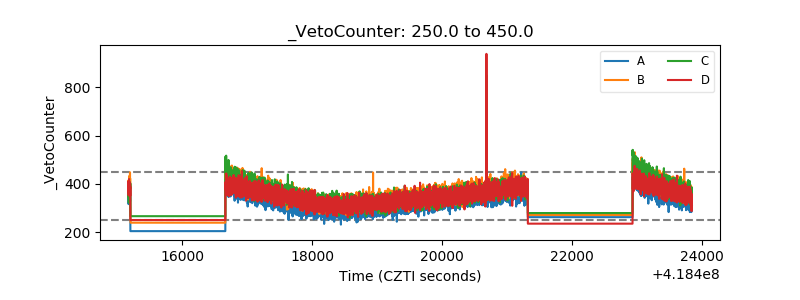 |