| Param | Original file | Final file |
|---|---|---|
| Filename | modeM0/AS1A12_029T01_9000005556_40660cztM0_level2.fits | modeM0/AS1A12_029T01_9000005556_40660cztM0_level2_quad_clean.evt |
| Size (bytes) | 314,153,280 | 86,054,400 |
| Size | 299.6 MB | 82.1 MB |
| Events in quadrant A | 2,670,679 | 580,164 |
| Events in quadrant B | 2,729,342 | 596,131 |
| Events in quadrant C | 2,534,915 | 574,126 |
| Events in quadrant D | 3,280,236 | 483,944 |
| Mode M0 | |||
|---|---|---|---|
| Quadrant | BADHDUFLAG | Total packets | Discarded packets |
| A | 0 | 11211 | 1 |
| B | 0 | 11691 | 1 |
| C | 0 | 10901 | 1 |
| D | 0 | 13483 | 1 |
| Mode M9 | |||
|---|---|---|---|
| Quadrant | BADHDUFLAG | Total packets | Discarded packets |
| A | 0 | 18 | 0 |
| B | 0 | 18 | 0 |
| C | 0 | 18 | 0 |
| D | 0 | 18 | 0 |
| Mode SS | |||
|---|---|---|---|
| Quadrant | BADHDUFLAG | Total packets | Discarded packets |
| A | 0 | 110 | 0 |
| B | 0 | 110 | 0 |
| C | 0 | 110 | 0 |
| D | 0 | 110 | 0 |
| Quadrant | Total seconds | Saturated seconds | Saturation percentage |
|---|---|---|---|
| A | 5302 | 8 | 0.150886% |
| B | 5302 | 80 | 1.508865% |
| C | 5302 | 8 | 0.150886% |
| D | 5302 | 515 | 9.713316% |
Noise dominated data is calculated using 1-second bins in cleaned event files. If a bin has >2000 counts, and if more than 50% of those come from <1% of pixels, then it is considered to be noise-dominated and hence unusable.
| Quadrant | # 1 sec bins | Bins with >0 counts | Bins with >2000 counts | High rate bins dominated by noise | Noise dominated (total time) | Noise dominated (detector-on time) | Marked lightcurve |
|---|---|---|---|---|---|---|---|
| A | 6915 | 5303 | 5 | 5 | 0.07% | 0.09% | 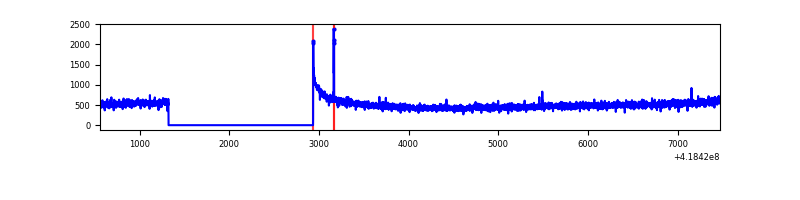 |
| B | 6915 | 5303 | 35 | 35 | 0.51% | 0.66% | 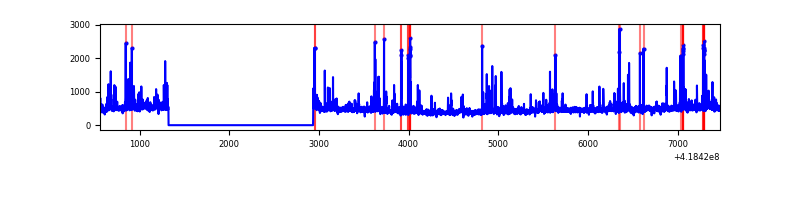 |
| C | 6915 | 5303 | 5 | 5 | 0.07% | 0.09% | 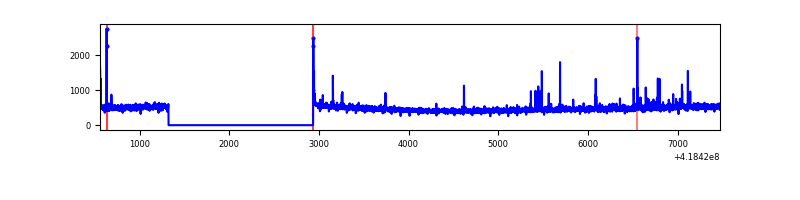 |
| D | 6915 | 5303 | 126 | 126 | 1.82% | 2.38% | 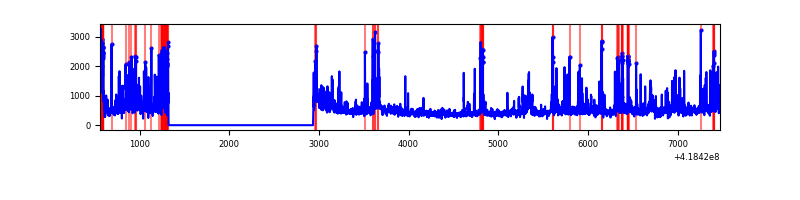 |
Top three noisy pixels from each quadrant. If the there are fewer than three noisy pixels in the level2.evt file, extra rows are filled as -1
| Pixel properties | Quadrant properties | ||||||
|---|---|---|---|---|---|---|---|
| Quadrant | DetID | PixID | Counts | Sigma | Mean | Median | Sigma |
| A | 10 | 83 | 373717 | 3091.71 | 585 | 573 | 120.7 |
| A | 13 | 28 | 15261 | 121.7 | 585 | 573 | 120.7 |
| A | 15 | 191 | 14847 | 118.27 | 585 | 573 | 120.7 |
| B | 0 | 229 | 345020 | 3027.1 | 580 | 563 | 113.8 |
| B | 0 | 190 | 40094 | 347.4 | 580 | 563 | 113.8 |
| B | 5 | 255 | 26288 | 226.07 | 580 | 563 | 113.8 |
| C | 15 | 214 | 225804 | 1680.91 | 571 | 574 | 134.0 |
| C | 12 | 249 | 46798 | 344.97 | 571 | 574 | 134.0 |
| C | 14 | 254 | 16298 | 117.35 | 571 | 574 | 134.0 |
| D | 12 | 227 | 612236 | 4579.15 | 539 | 522 | 133.6 |
| D | 2 | 250 | 251668 | 1880.02 | 539 | 522 | 133.6 |
| D | 12 | 191 | 141515 | 1055.44 | 539 | 522 | 133.6 |
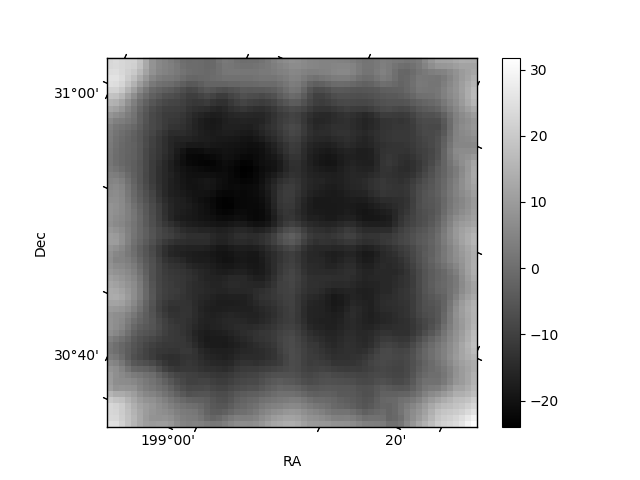
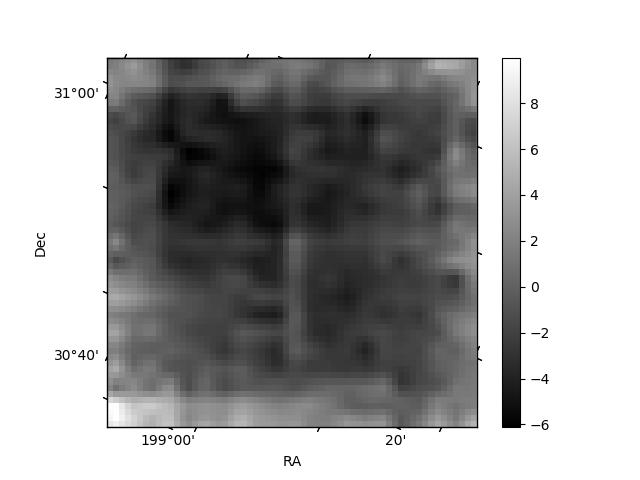
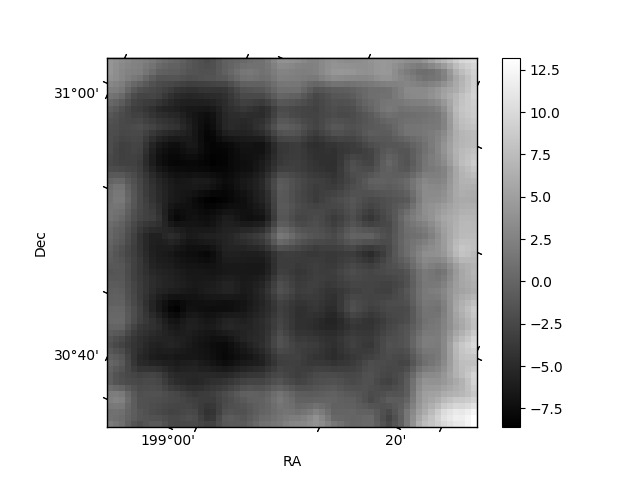
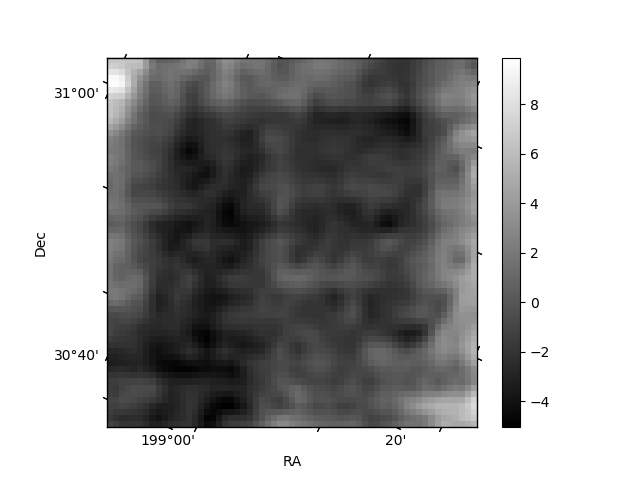
Histogram calculated using DETX and DETY for each event in the final _common_clean file
| Quadrant A | 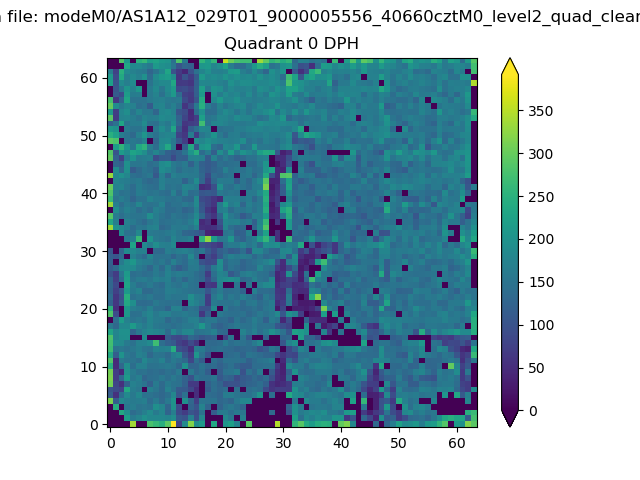 |
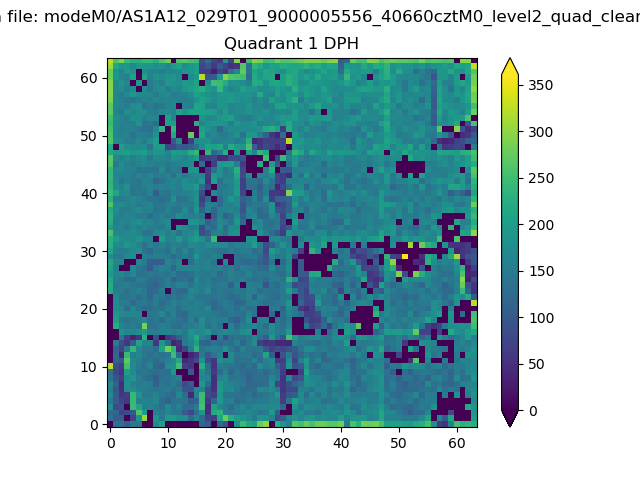 |
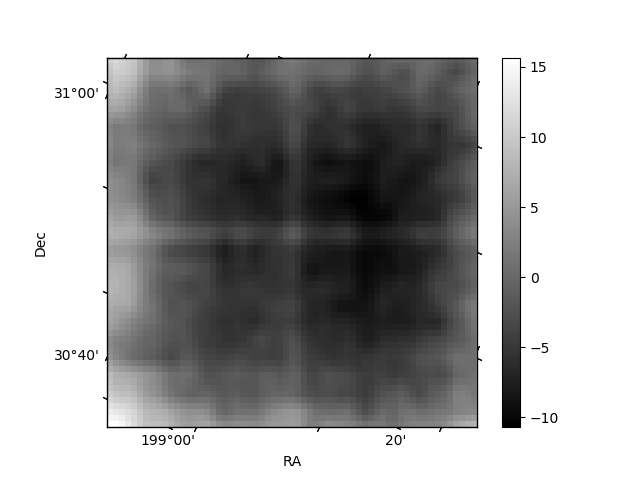
Quadrant B |
|---|---|---|---|
| Quadrant D | 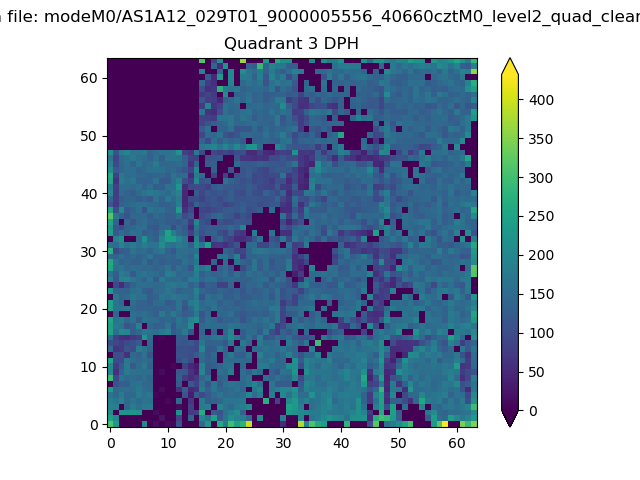 |
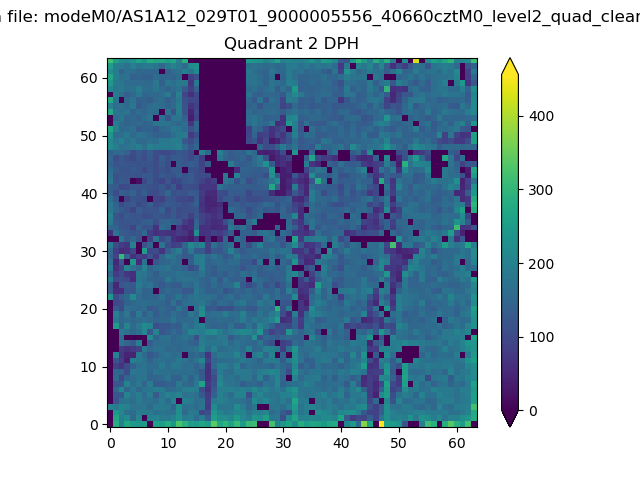 |
Quadrant C |
| Plot type | Count rate plots | Images |
|---|---|---|
| Comparison with Poisson distribution Blue bars denote a histogram of data divided into 1 sec bins. Red curve is a Poisson curve with rate = median count rate of data. |
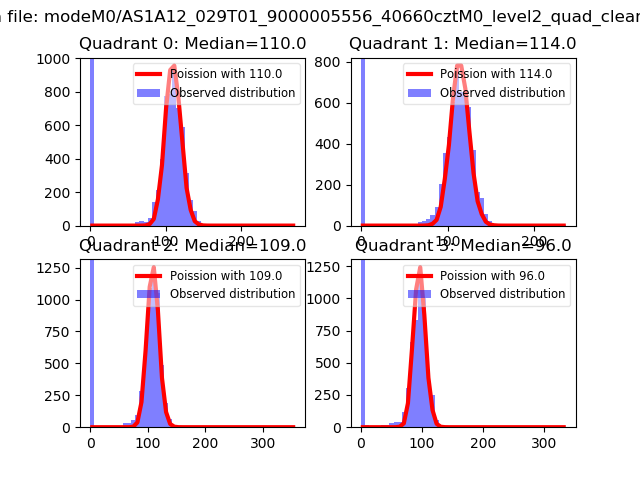 |
 |
| Quadrant-wise count rates Data is divided into 100 sec bins |
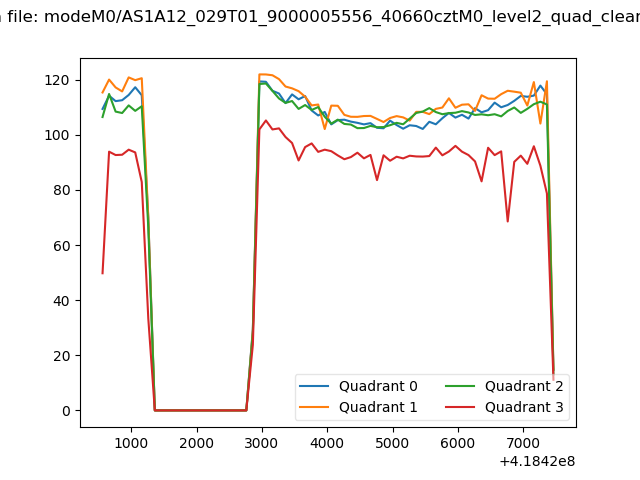 |
|
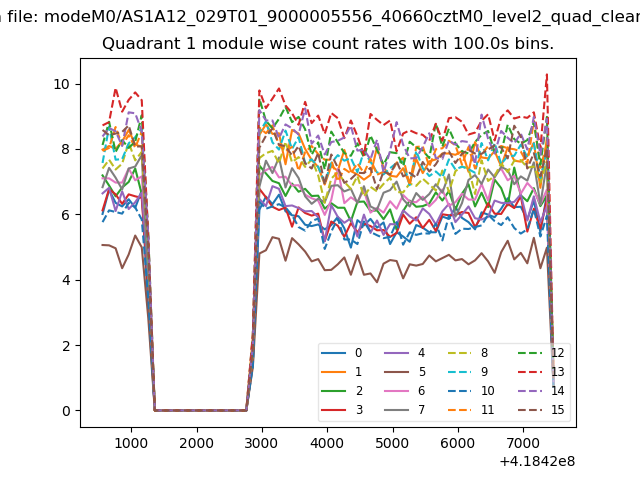
| Module-wise count rates for Quadrant A Data is divided into 100 sec bins |
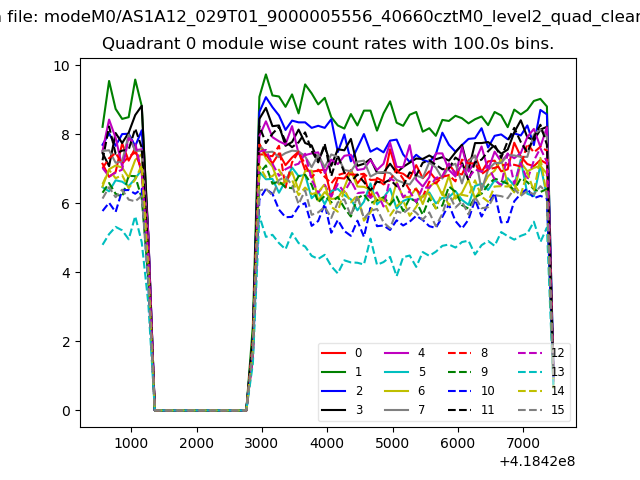 |
 |
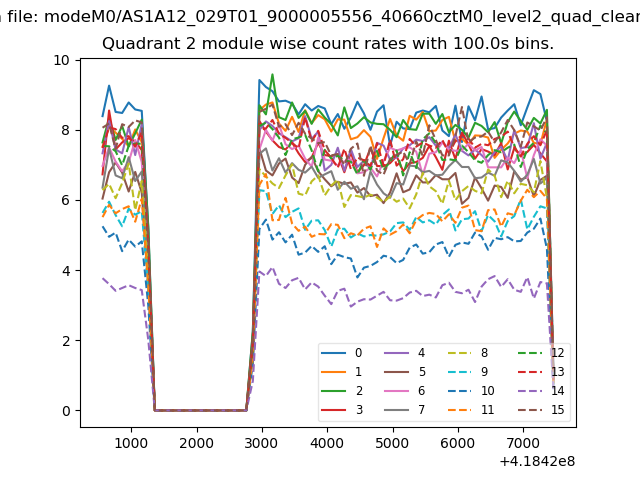
| Module-wise count rates for Quadrant B Data is divided into 100 sec bins |
 |
 |
| Module-wise count rates for Quadrant C Data is divided into 100 sec bins |
 |
 |
| Module-wise count rates for Quadrant D Data is divided into 100 sec bins |
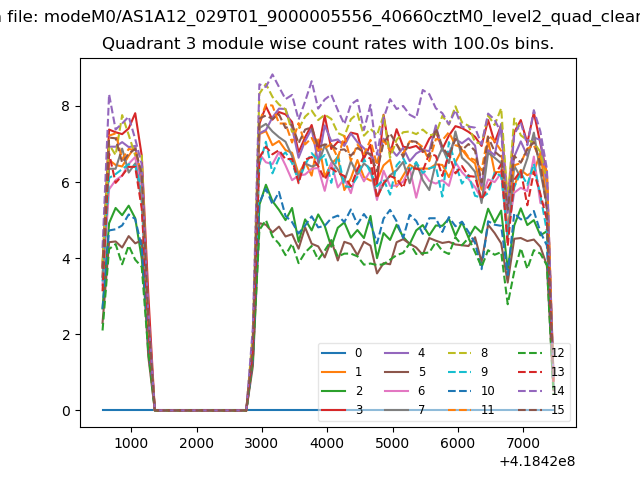 |
 |
| Parameter | Plot |
|---|---|
| CZT HV Monitor | 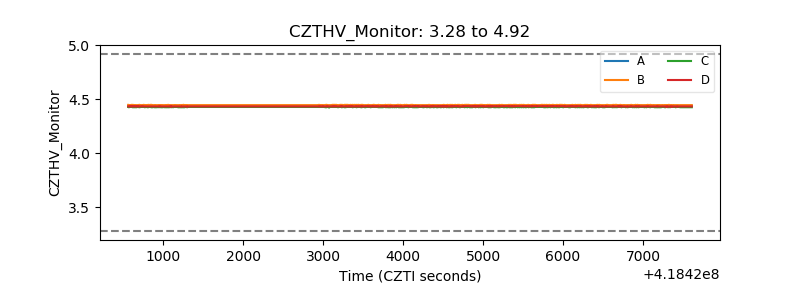 |
| D_VDD |  |
| Temperature 1 | 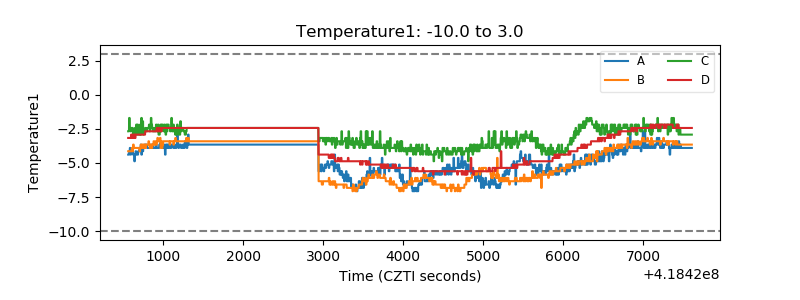 |
| Veto HV Monitor |  |
| Veto LLD | 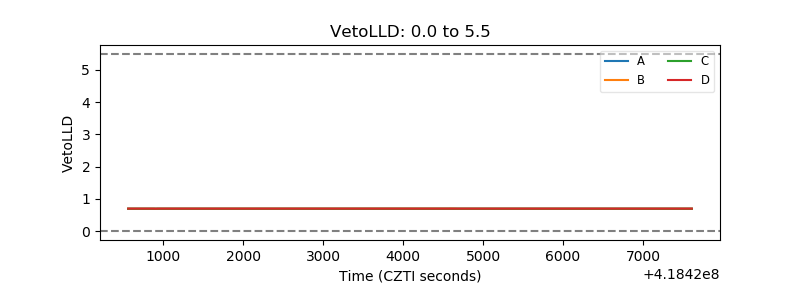 |
| Alpha Counter | 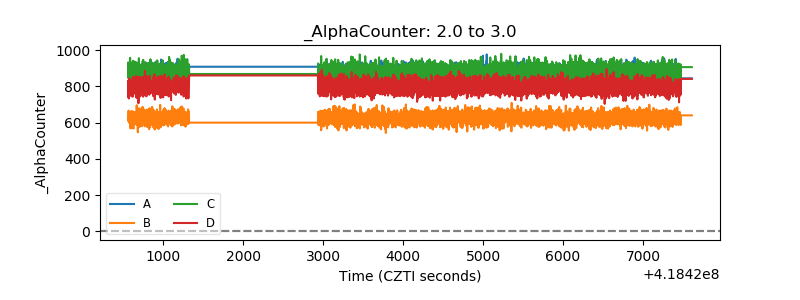 |
| _CPM_Rate | 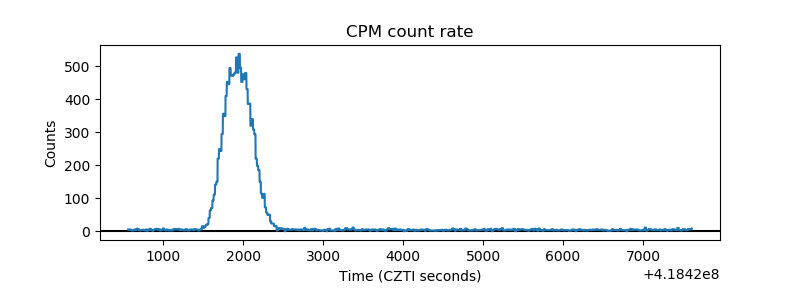 |
| CZT Counter | 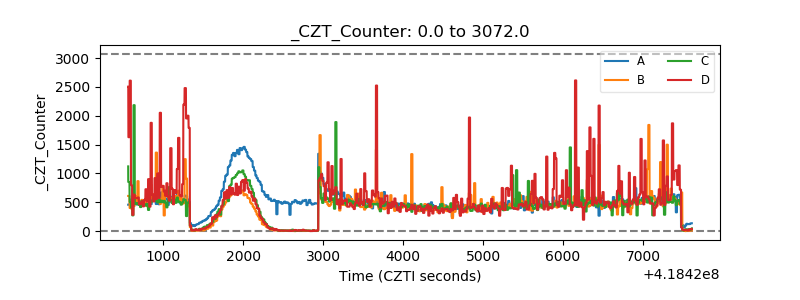 |
| +2.5 Volts monitor | 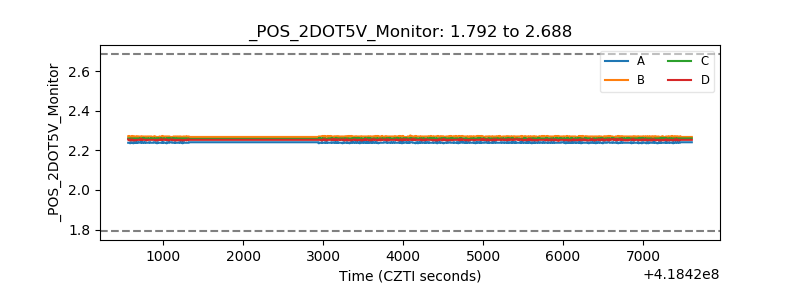 |
| +5 Volts monitor | 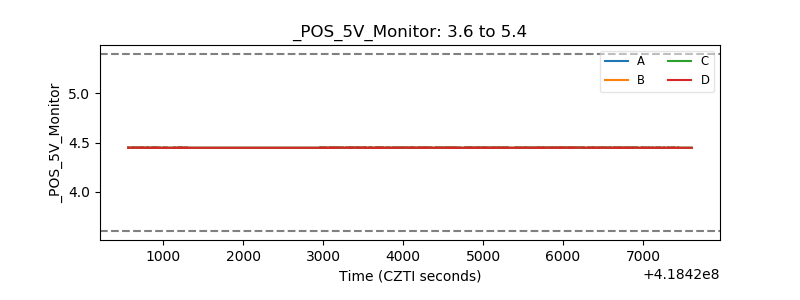 |
| _ROLL_ROT | 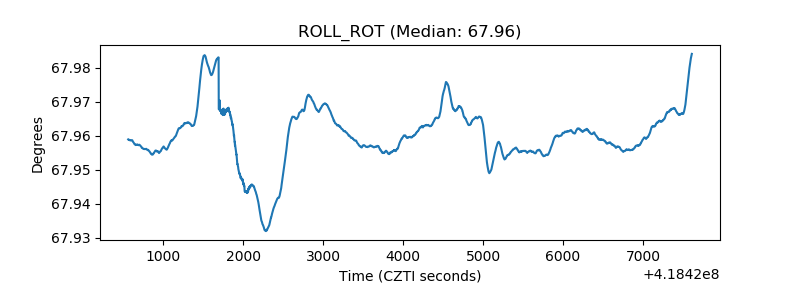 |
| _Roll_DEC | 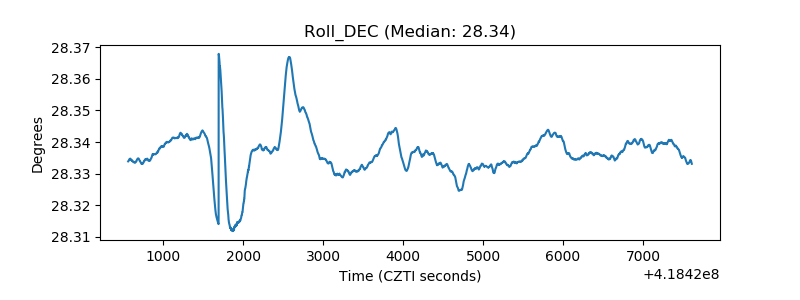 |
| _Roll_RA | 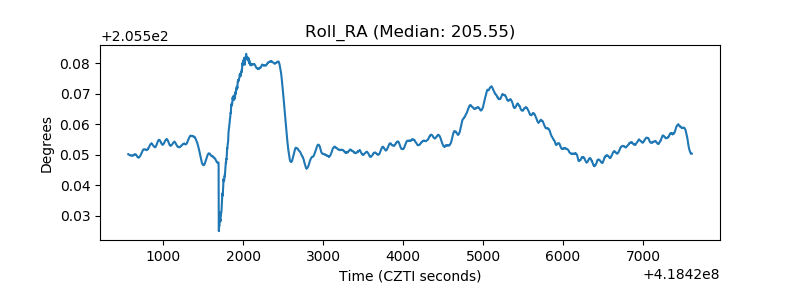 |
| Veto Counter | 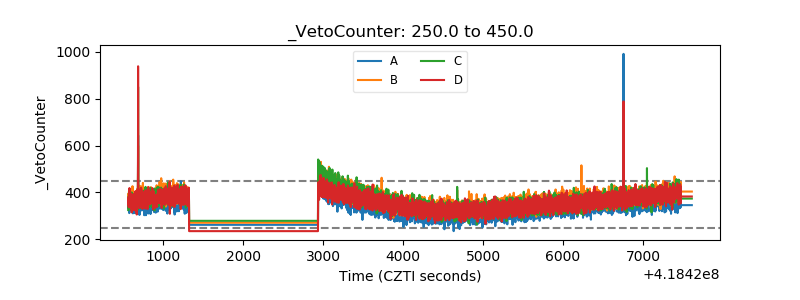 |