| Param | Original file | Final file |
|---|---|---|
| Filename | modeM0/AS1A12_029T02_9000005558_40660cztM0_level2.fits | modeM0/AS1A12_029T02_9000005558_40660cztM0_level2_quad_clean.evt |
| Size (bytes) | 55,152,000 | 16,430,400 |
| Size | 52.6 MB | 15.7 MB |
| Events in quadrant A | 565,169 | 109,737 |
| Events in quadrant B | 489,974 | 113,820 |
| Events in quadrant C | 486,566 | 109,631 |
| Events in quadrant D | 425,297 | 93,141 |
| Mode M0 | |||
|---|---|---|---|
| Quadrant | BADHDUFLAG | Total packets | Discarded packets |
| A | 0 | 2288 | 2 |
| B | 0 | 2051 | 1 |
| C | 0 | 1983 | 1 |
| D | 0 | 1869 | 1 |
| Mode M9 | |||
|---|---|---|---|
| Quadrant | BADHDUFLAG | Total packets | Discarded packets |
| A | 0 | 8 | 0 |
| B | 0 | 8 | 0 |
| C | 0 | 8 | 0 |
| D | 0 | 8 | 0 |
| Mode SS | |||
|---|---|---|---|
| Quadrant | BADHDUFLAG | Total packets | Discarded packets |
| A | 0 | 20 | 0 |
| B | 0 | 20 | 0 |
| C | 0 | 20 | 0 |
| D | 0 | 20 | 0 |
| Quadrant | Total seconds | Saturated seconds | Saturation percentage |
|---|---|---|---|
| A | 914 | 4 | 0.437637% |
| B | 914 | 5 | 0.547046% |
| C | 914 | 5 | 0.547046% |
| D | 914 | 70 | 7.658643% |
Noise dominated data is calculated using 1-second bins in cleaned event files. If a bin has >2000 counts, and if more than 50% of those come from <1% of pixels, then it is considered to be noise-dominated and hence unusable.
| Quadrant | # 1 sec bins | Bins with >0 counts | Bins with >2000 counts | High rate bins dominated by noise | Noise dominated (total time) | Noise dominated (detector-on time) | Marked lightcurve |
|---|---|---|---|---|---|---|---|
| A | 914 | 914 | 2 | 2 | 0.22% | 0.22% | 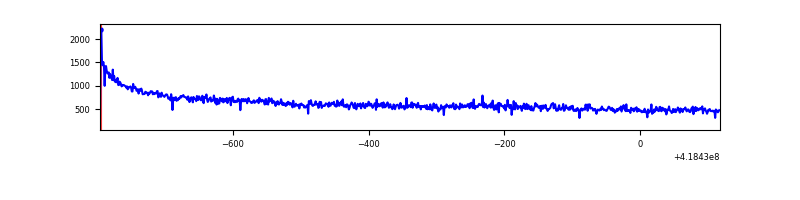 |
| B | 914 | 914 | 3 | 3 | 0.33% | 0.33% | 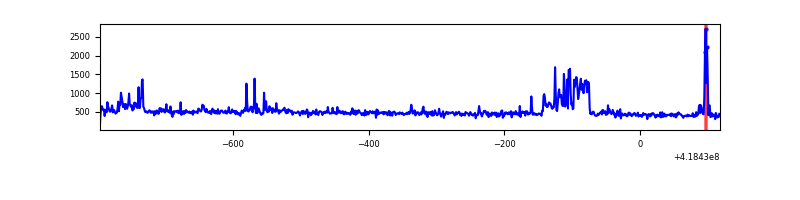 |
| C | 914 | 914 | 4 | 4 | 0.44% | 0.44% | 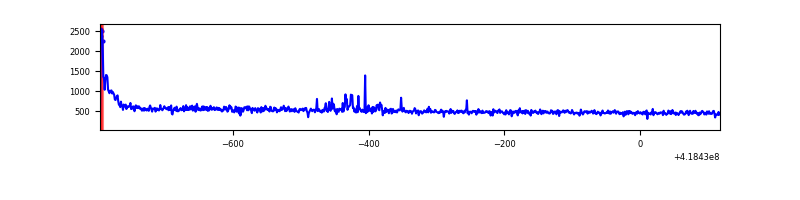 |
| D | 914 | 914 | 0 | 0 | 0.00% | 0.00% | 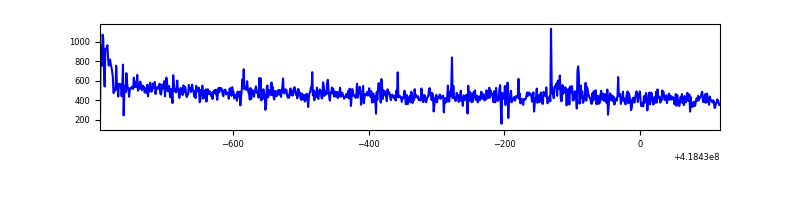 |
Top three noisy pixels from each quadrant. If the there are fewer than three noisy pixels in the level2.evt file, extra rows are filled as -1
| Pixel properties | Quadrant properties | ||||||
|---|---|---|---|---|---|---|---|
| Quadrant | DetID | PixID | Counts | Sigma | Mean | Median | Sigma |
| A | 10 | 83 | 141386 | 6056.25 | 103 | 101 | 23.3 |
| A | 13 | 28 | 19259 | 821.22 | 103 | 101 | 23.3 |
| A | 13 | 6 | 2670 | 110.12 | 103 | 101 | 23.3 |
| B | 0 | 229 | 58613 | 2601.53 | 105 | 102 | 22.5 |
| B | 5 | 255 | 11032 | 485.97 | 105 | 102 | 22.5 |
| B | 4 | 171 | 3425 | 147.75 | 105 | 102 | 22.5 |
| C | 15 | 214 | 44219 | 1654.62 | 105 | 106 | 26.7 |
| C | 0 | 10 | 19444 | 725.34 | 105 | 106 | 26.7 |
| C | 14 | 254 | 7610 | 281.46 | 105 | 106 | 26.7 |
| D | 12 | 191 | 30452 | 1164.43 | 98 | 94 | 26.1 |
| D | 5 | 51 | 5514 | 207.89 | 98 | 94 | 26.1 |
| D | 3 | 14 | 4308 | 161.63 | 98 | 94 | 26.1 |
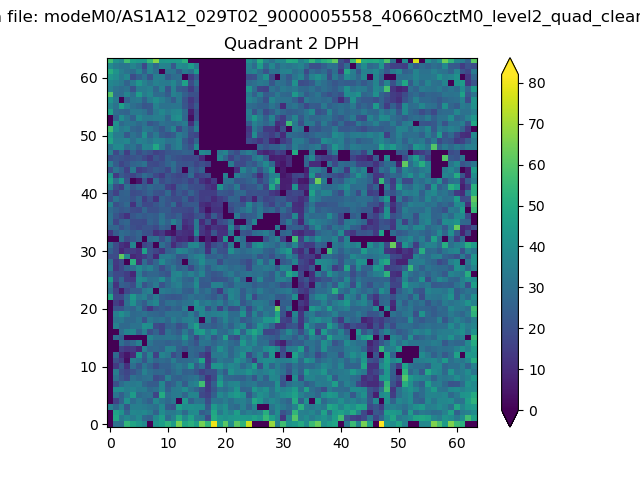
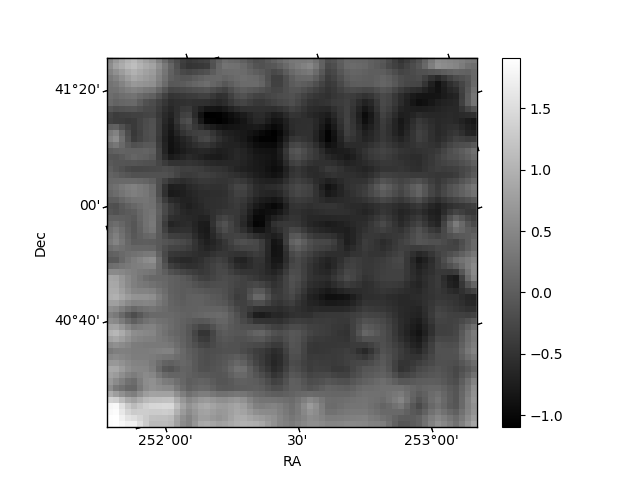
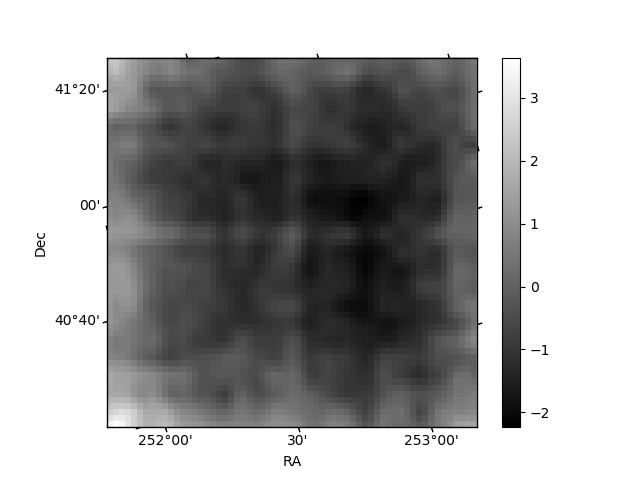
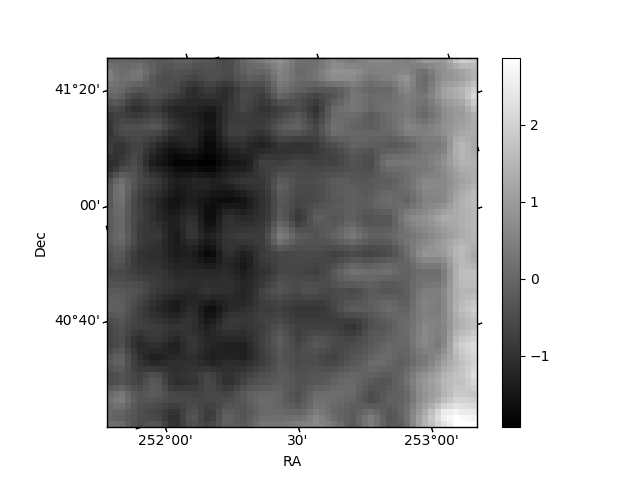
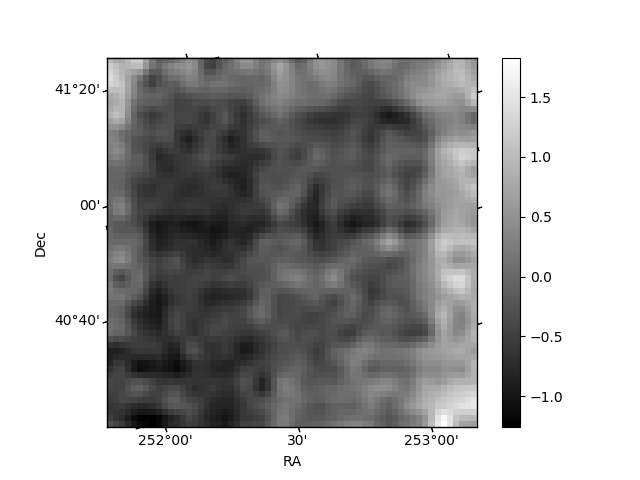
Histogram calculated using DETX and DETY for each event in the final _common_clean file
| Quadrant A | 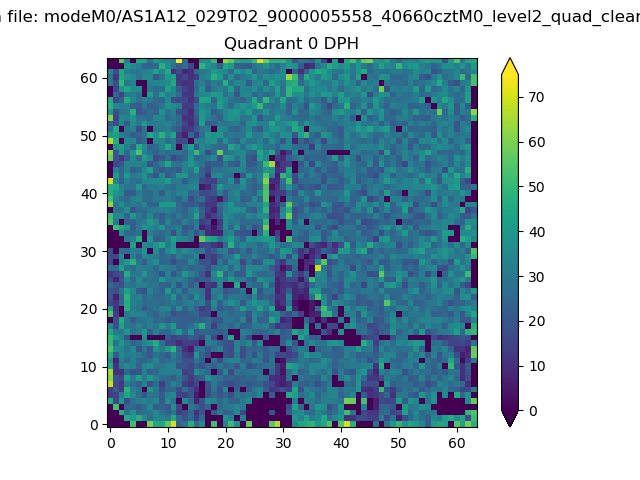 |
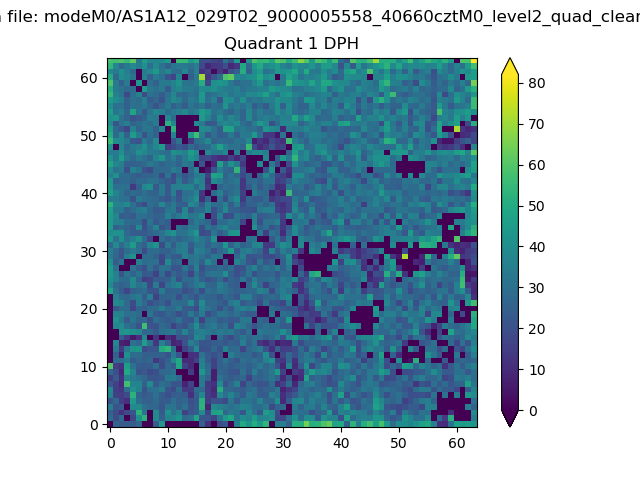 |
Quadrant B |
|---|---|---|---|
| Quadrant D | 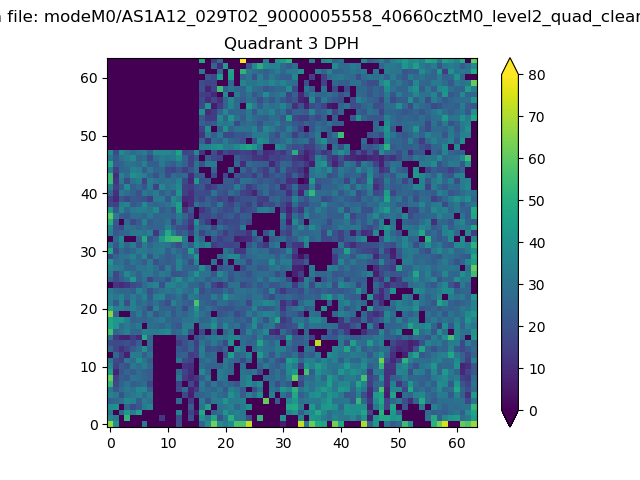 |
 |
Quadrant C |
| Plot type | Count rate plots | Images |
|---|---|---|
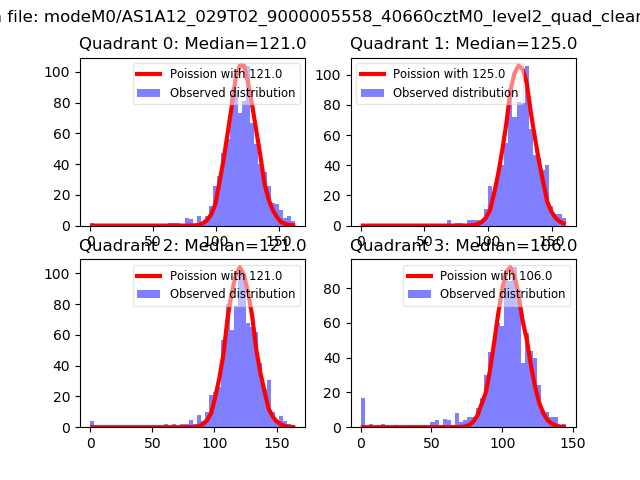
| Comparison with Poisson distribution Blue bars denote a histogram of data divided into 1 sec bins. Red curve is a Poisson curve with rate = median count rate of data. |
 |
 |
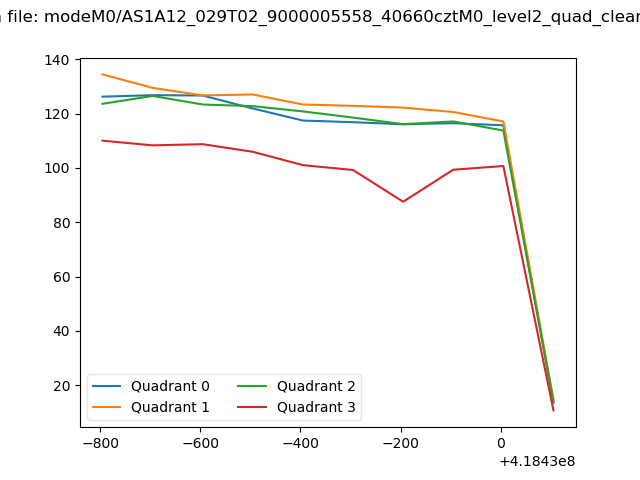
| Quadrant-wise count rates Data is divided into 100 sec bins |
 |
|
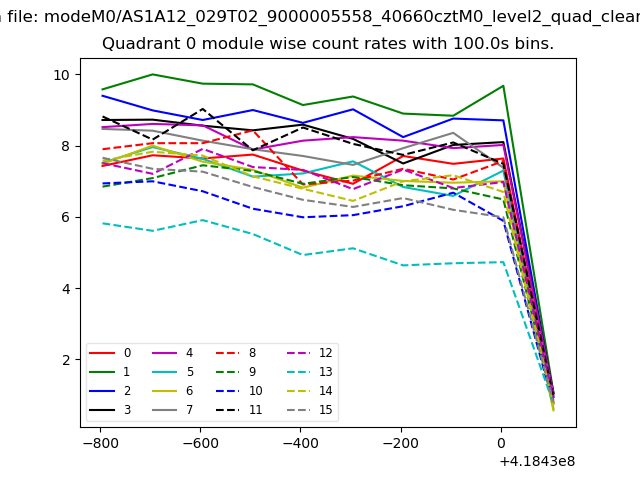
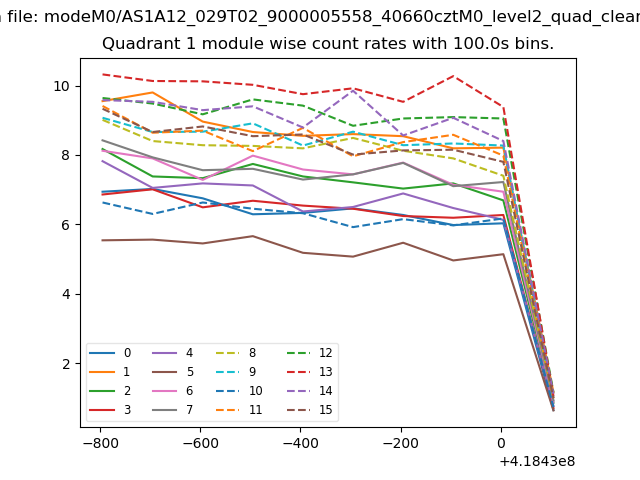
| Module-wise count rates for Quadrant A Data is divided into 100 sec bins |
 |
 |
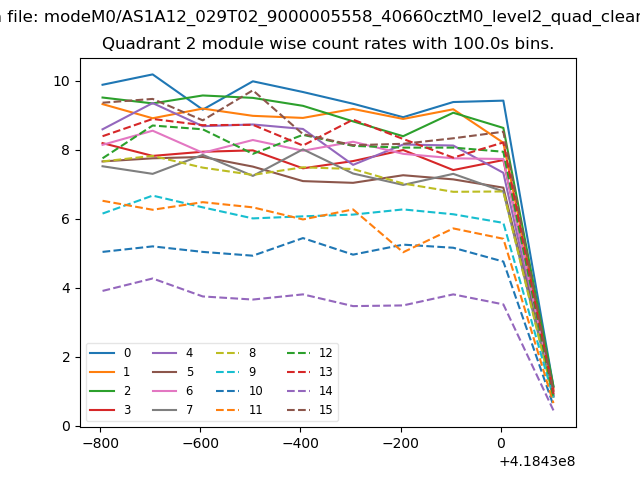
| Module-wise count rates for Quadrant B Data is divided into 100 sec bins |
 |
 |
| Module-wise count rates for Quadrant C Data is divided into 100 sec bins |
 |
 |
| Module-wise count rates for Quadrant D Data is divided into 100 sec bins |
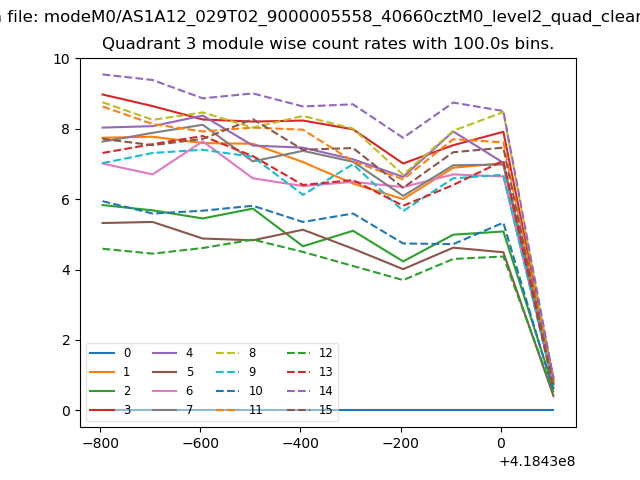 |
 |
| Parameter | Plot |
|---|---|
| CZT HV Monitor | 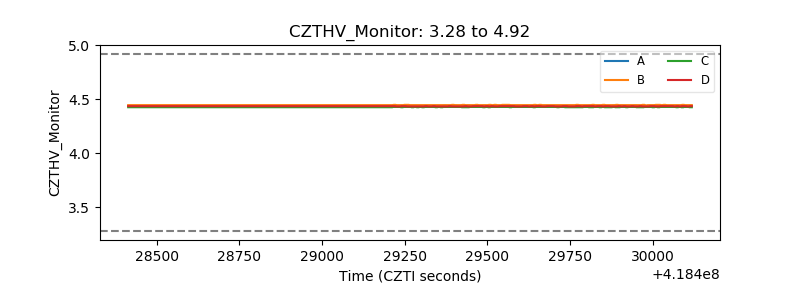 |
| D_VDD | 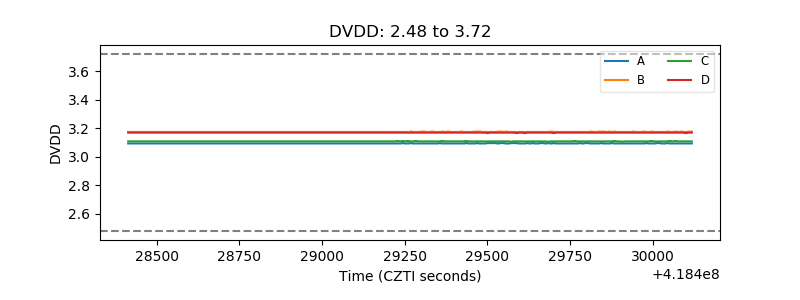 |
| Temperature 1 | 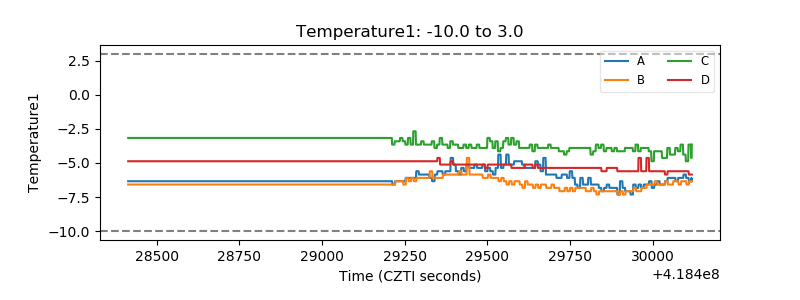 |
| Veto HV Monitor | 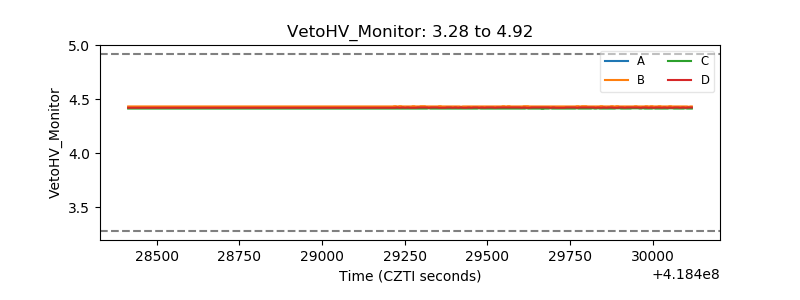 |
| Veto LLD | 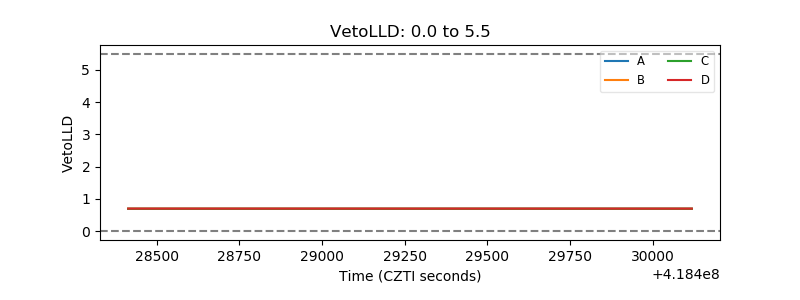 |
| Alpha Counter | 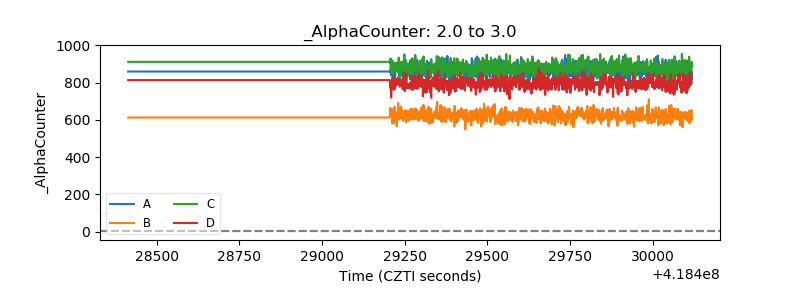 |
| _CPM_Rate | 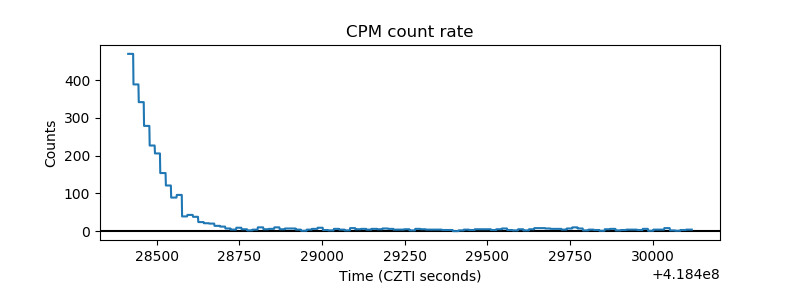 |
| CZT Counter | 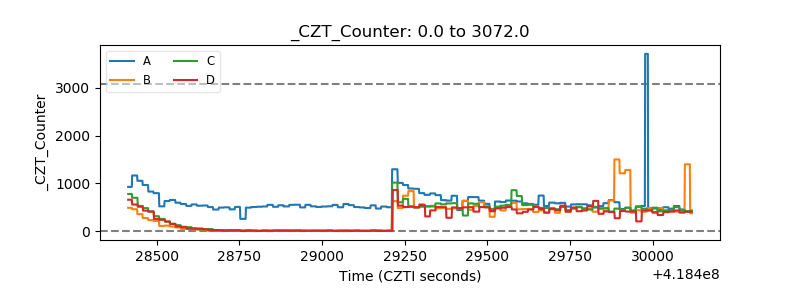 |
| +2.5 Volts monitor | 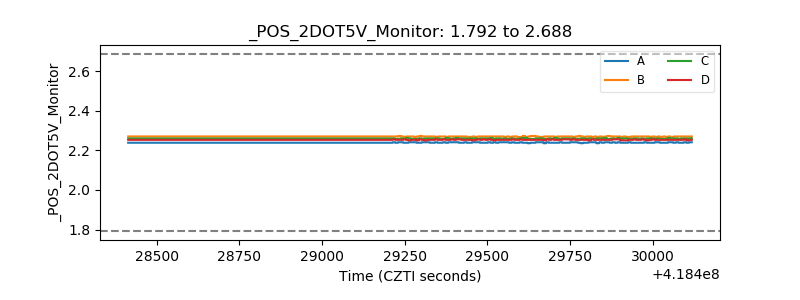 |
| +5 Volts monitor | 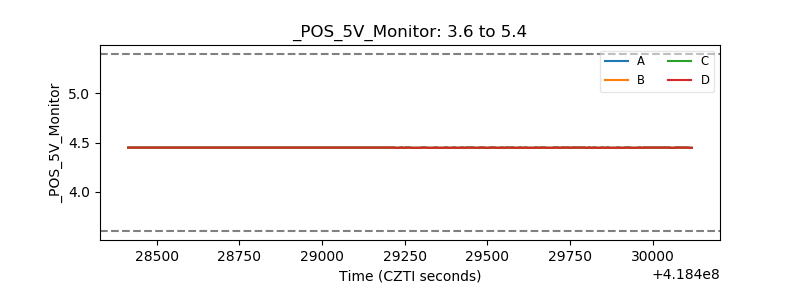 |
| _ROLL_ROT | 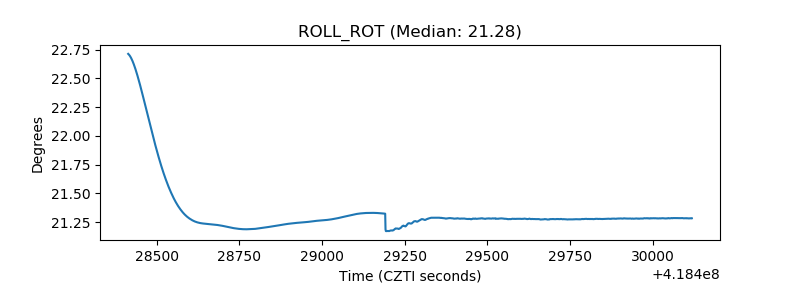 |
| _Roll_DEC | 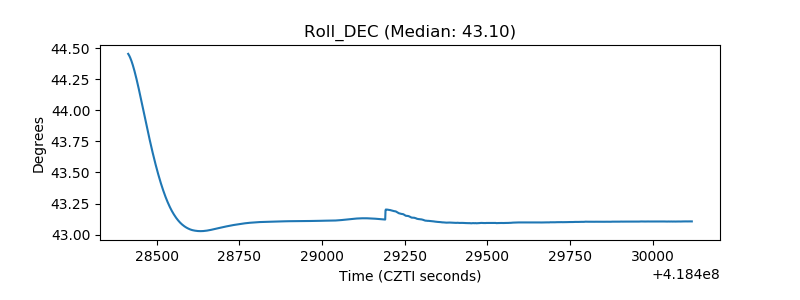 |
| _Roll_RA | 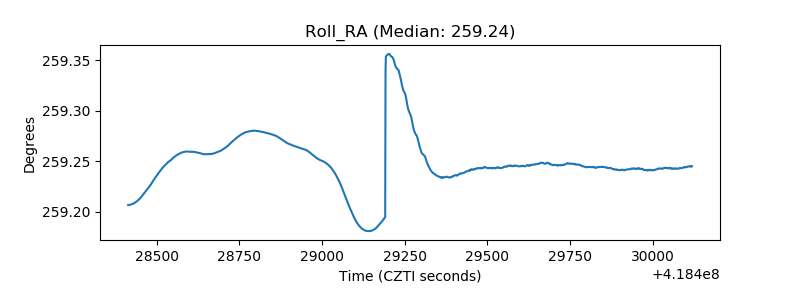 |
| Veto Counter | 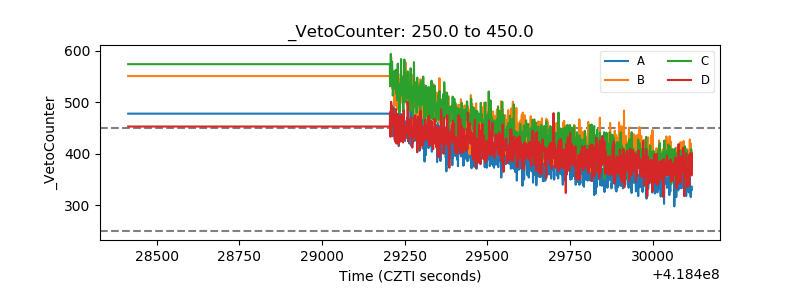 |