| Param | Original file | Final file |
|---|---|---|
| Filename | modeM0/AS1A12_029T02_9000005558_40662cztM0_level2.fits | modeM0/AS1A12_029T02_9000005558_40662cztM0_level2_quad_clean.evt |
| Size (bytes) | 290,954,880 | 87,649,920 |
| Size | 277.5 MB | 83.6 MB |
| Events in quadrant A | 2,717,419 | 600,509 |
| Events in quadrant B | 2,617,159 | 621,814 |
| Events in quadrant C | 2,451,350 | 595,653 |
| Events in quadrant D | 2,587,357 | 480,077 |
| Mode M0 | |||
|---|---|---|---|
| Quadrant | BADHDUFLAG | Total packets | Discarded packets |
| A | 0 | 11148 | 3 |
| B | 0 | 11201 | 2 |
| C | 0 | 10400 | 2 |
| D | 0 | 11412 | 2 |
| Mode M9 | |||
|---|---|---|---|
| Quadrant | BADHDUFLAG | Total packets | Discarded packets |
| A | 0 | 34 | 0 |
| B | 0 | 34 | 0 |
| C | 0 | 34 | 0 |
| D | 0 | 35 | 0 |
| Mode SS | |||
|---|---|---|---|
| Quadrant | BADHDUFLAG | Total packets | Discarded packets |
| A | 0 | 104 | 0 |
| B | 0 | 104 | 0 |
| C | 0 | 104 | 0 |
| D | 0 | 104 | 0 |
| Quadrant | Total seconds | Saturated seconds | Saturation percentage |
|---|---|---|---|
| A | 5080 | 8 | 0.157480% |
| B | 5080 | 49 | 0.964567% |
| C | 5080 | 7 | 0.137795% |
| D | 5080 | 642 | 12.637795% |
Noise dominated data is calculated using 1-second bins in cleaned event files. If a bin has >2000 counts, and if more than 50% of those come from <1% of pixels, then it is considered to be noise-dominated and hence unusable.
| Quadrant | # 1 sec bins | Bins with >0 counts | Bins with >2000 counts | High rate bins dominated by noise | Noise dominated (total time) | Noise dominated (detector-on time) | Marked lightcurve |
|---|---|---|---|---|---|---|---|
| A | 7052 | 5081 | 3 | 3 | 0.04% | 0.06% | 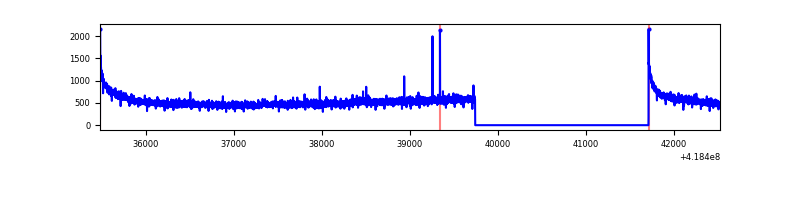 |
| B | 7052 | 5081 | 13 | 13 | 0.18% | 0.26% | 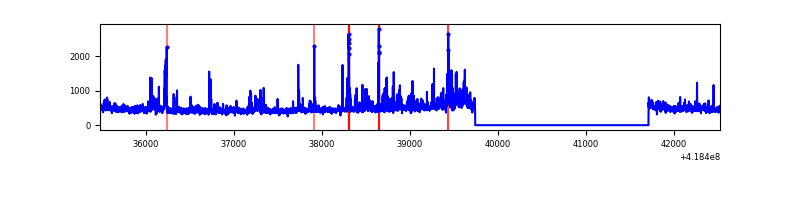 |
| C | 7052 | 5081 | 4 | 4 | 0.06% | 0.08% | 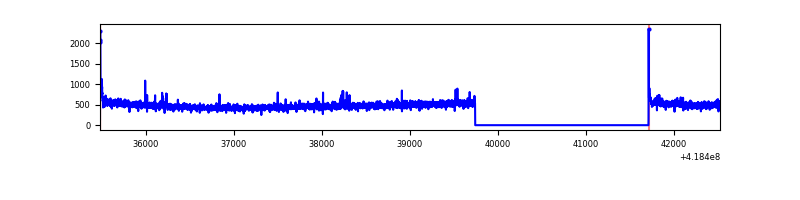 |
| D | 7052 | 5081 | 40 | 40 | 0.57% | 0.79% | 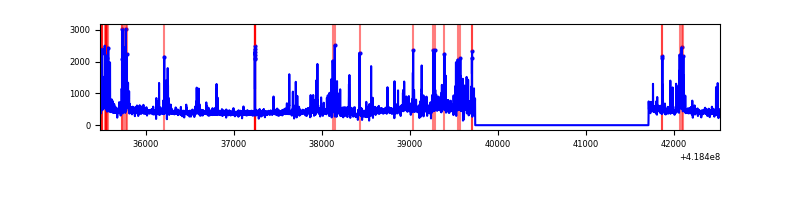 |
Top three noisy pixels from each quadrant. If the there are fewer than three noisy pixels in the level2.evt file, extra rows are filled as -1
| Pixel properties | Quadrant properties | ||||||
|---|---|---|---|---|---|---|---|
| Quadrant | DetID | PixID | Counts | Sigma | Mean | Median | Sigma |
| A | 10 | 83 | 470893 | 4081.08 | 567 | 556 | 115.2 |
| A | 15 | 191 | 34981 | 298.7 | 567 | 556 | 115.2 |
| A | 13 | 6 | 10078 | 82.62 | 567 | 556 | 115.2 |
| B | 0 | 229 | 216109 | 1953.33 | 568 | 551 | 110.4 |
| B | 0 | 190 | 94555 | 851.84 | 568 | 551 | 110.4 |
| B | 4 | 171 | 56673 | 508.56 | 568 | 551 | 110.4 |
| C | 15 | 214 | 223204 | 1728.66 | 555 | 559 | 128.8 |
| C | 0 | 10 | 22163 | 167.74 | 555 | 559 | 128.8 |
| C | 3 | 233 | 19685 | 148.5 | 555 | 559 | 128.8 |
| D | 2 | 250 | 218234 | 1739.99 | 508 | 494 | 125.1 |
| D | 12 | 191 | 178056 | 1418.92 | 508 | 494 | 125.1 |
| D | 12 | 227 | 82067 | 651.86 | 508 | 494 | 125.1 |
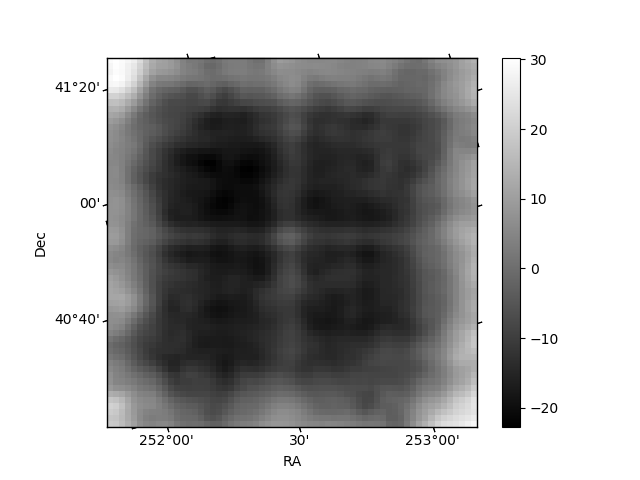
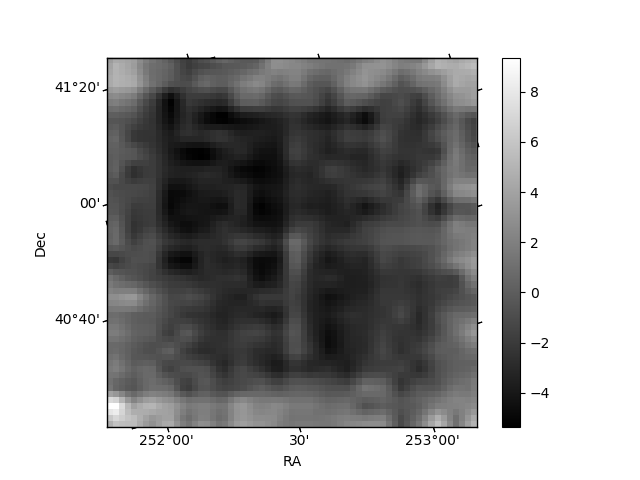
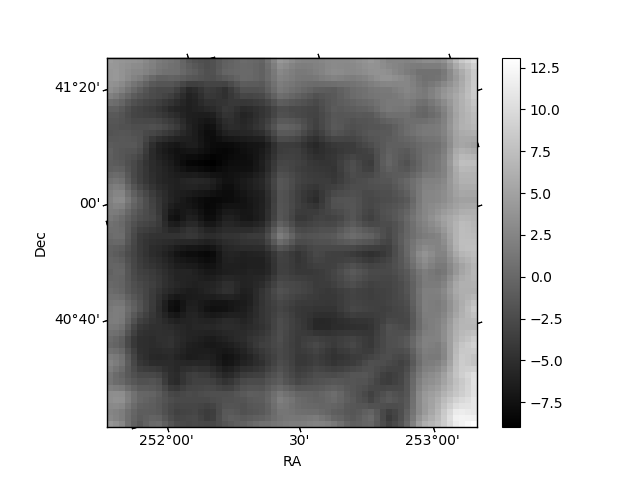
Histogram calculated using DETX and DETY for each event in the final _common_clean file
| Quadrant A | 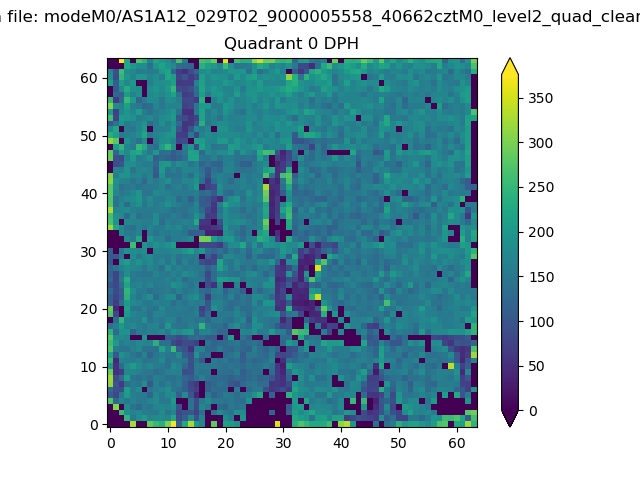 |
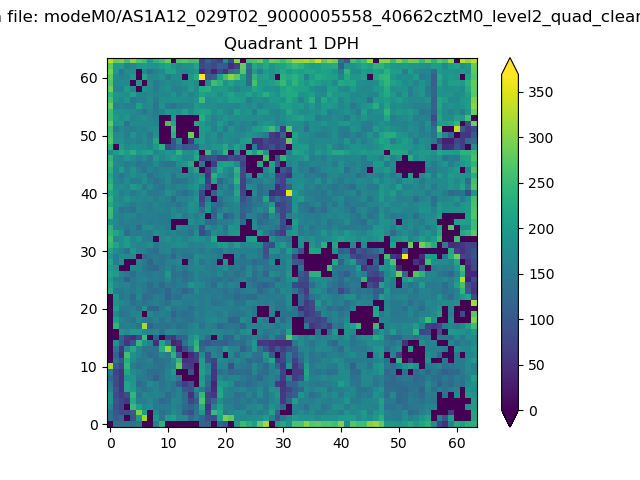 |
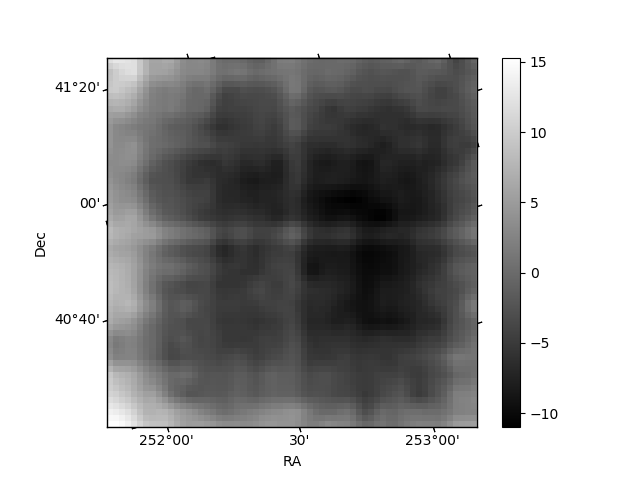
Quadrant B |
|---|---|---|---|
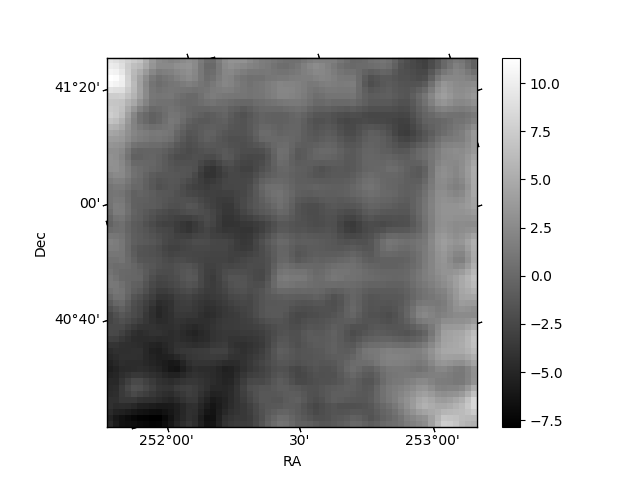
| Quadrant D | 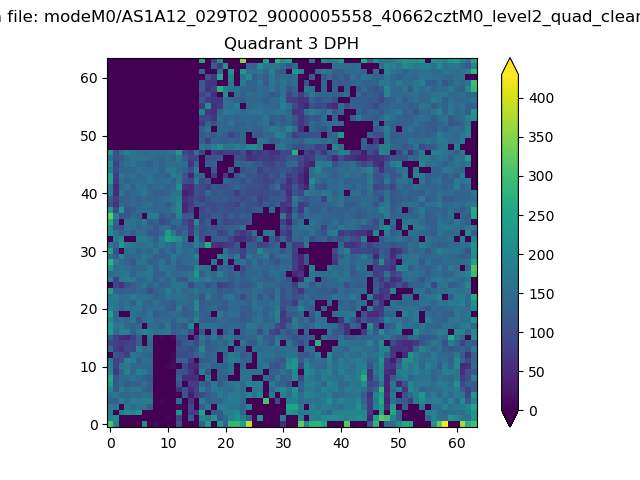 |
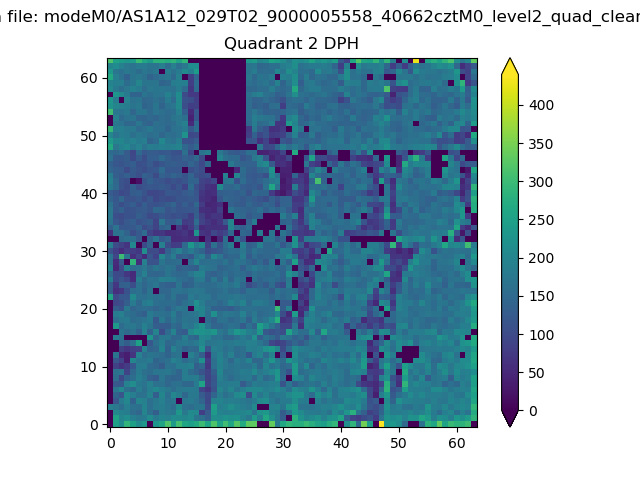 |
Quadrant C |
| Plot type | Count rate plots | Images |
|---|---|---|
| Comparison with Poisson distribution Blue bars denote a histogram of data divided into 1 sec bins. Red curve is a Poisson curve with rate = median count rate of data. |
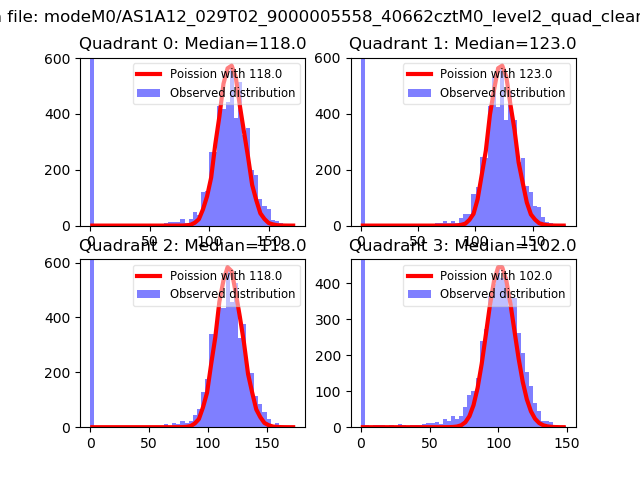 |
 |
| Quadrant-wise count rates Data is divided into 100 sec bins |
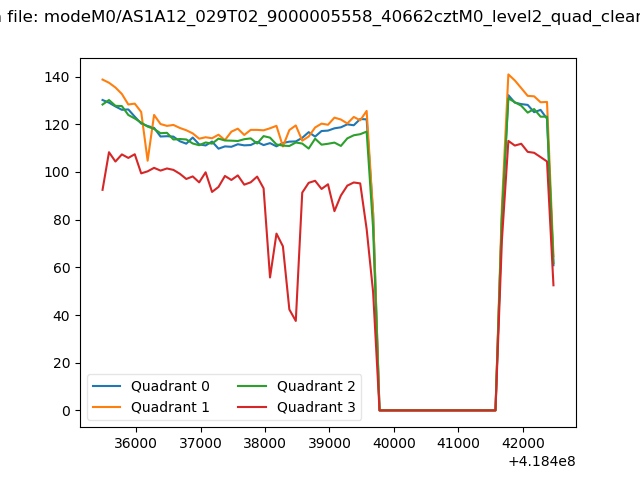 |
|
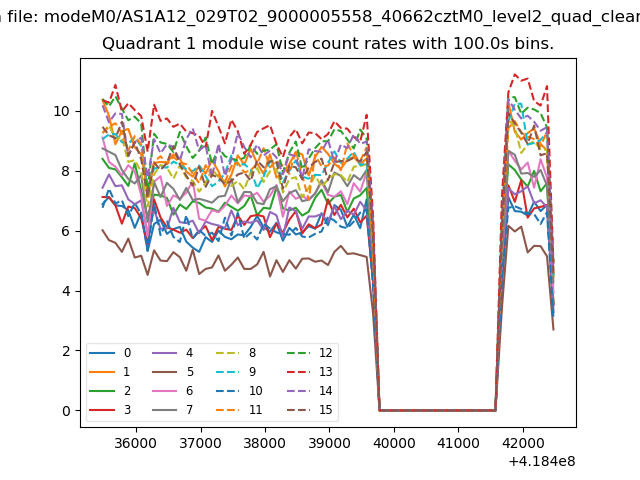
| Module-wise count rates for Quadrant A Data is divided into 100 sec bins |
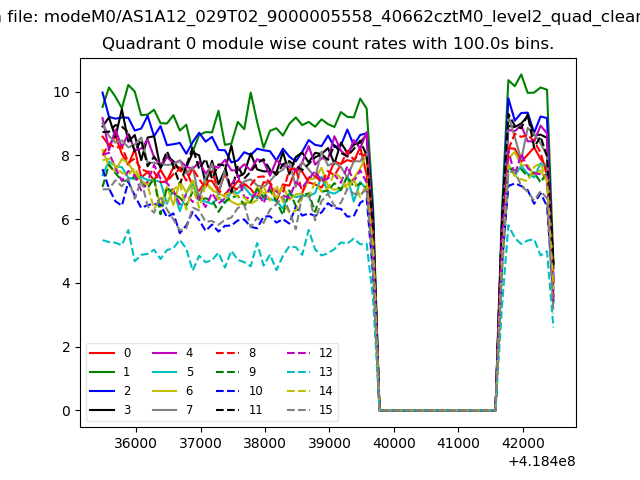 |
 |
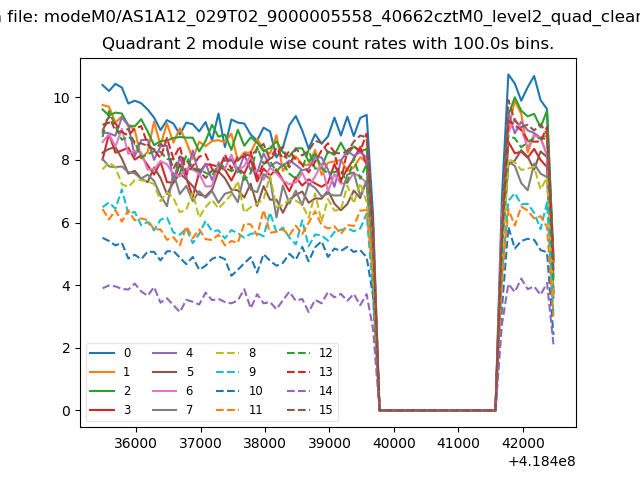
| Module-wise count rates for Quadrant B Data is divided into 100 sec bins |
 |
 |
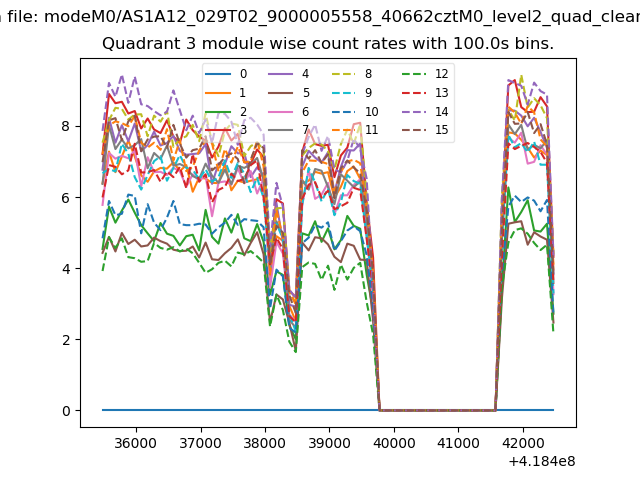
| Module-wise count rates for Quadrant C Data is divided into 100 sec bins |
 |
 |
| Module-wise count rates for Quadrant D Data is divided into 100 sec bins |
 |
 |
| Parameter | Plot |
|---|---|
| CZT HV Monitor | 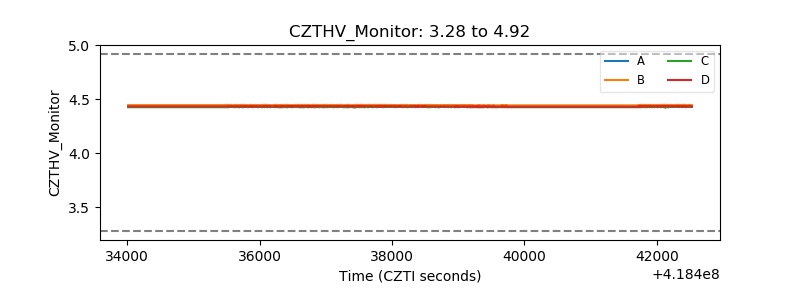 |
| D_VDD | 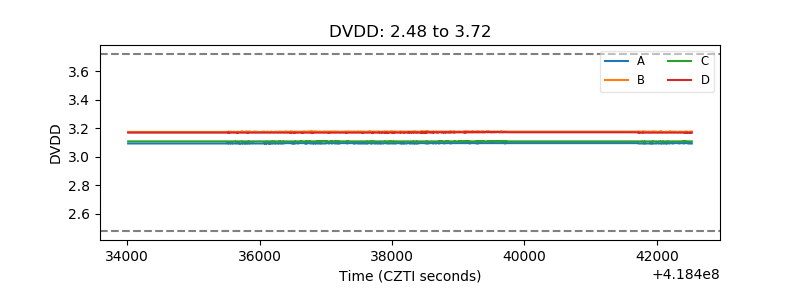 |
| Temperature 1 | 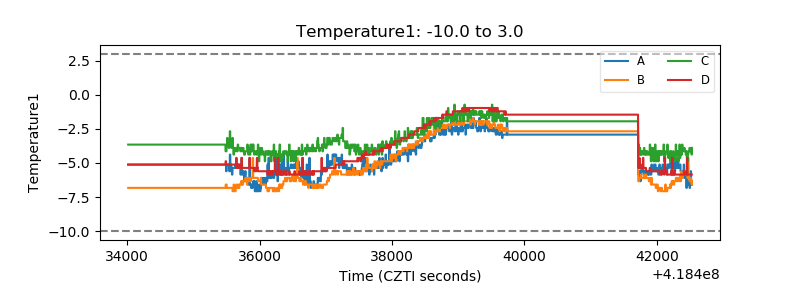 |
| Veto HV Monitor | 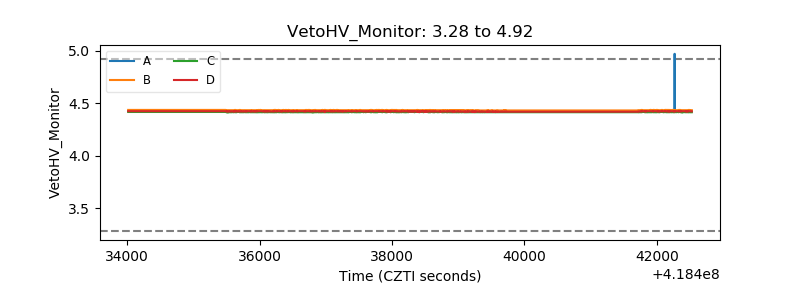 |
| Veto LLD | 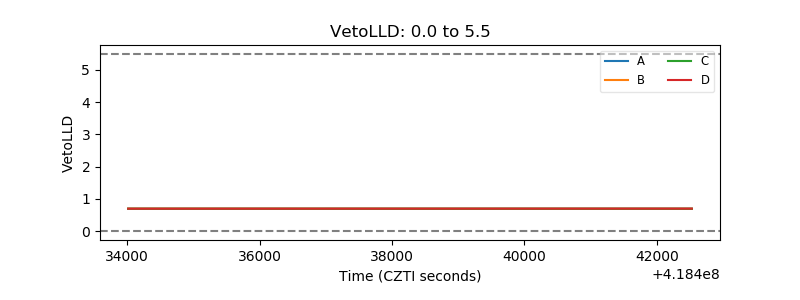 |
| Alpha Counter | 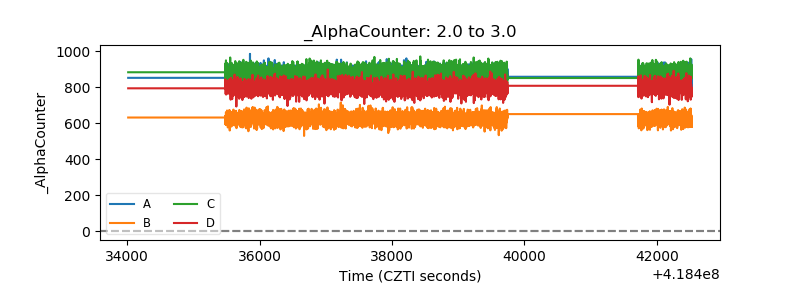 |
| _CPM_Rate | 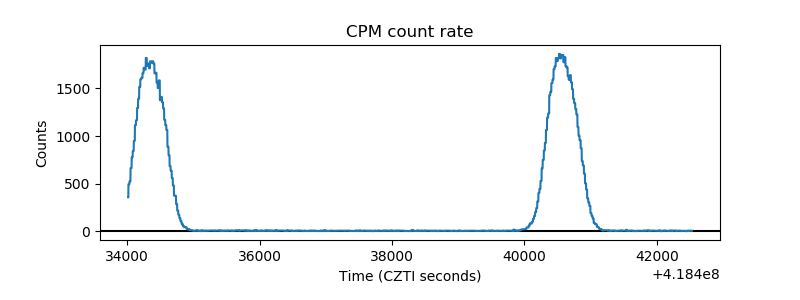 |
| CZT Counter | 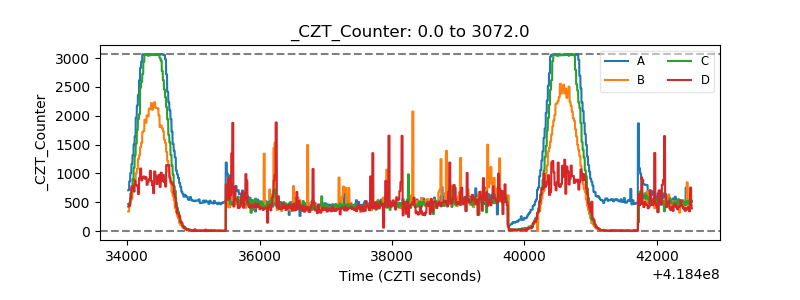 |
| +2.5 Volts monitor | 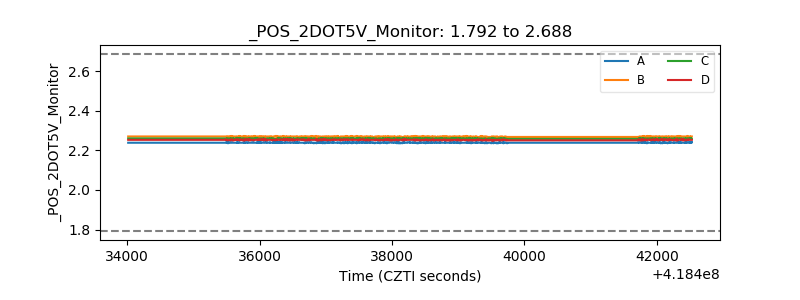 |
| +5 Volts monitor | 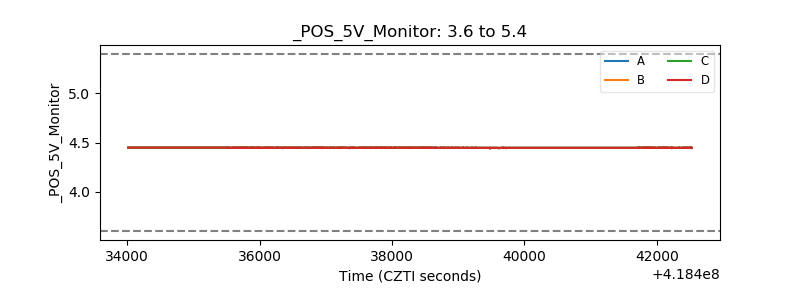 |
| _ROLL_ROT | 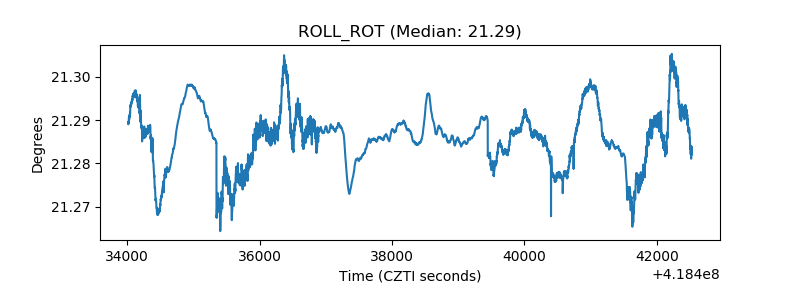 |
| _Roll_DEC | 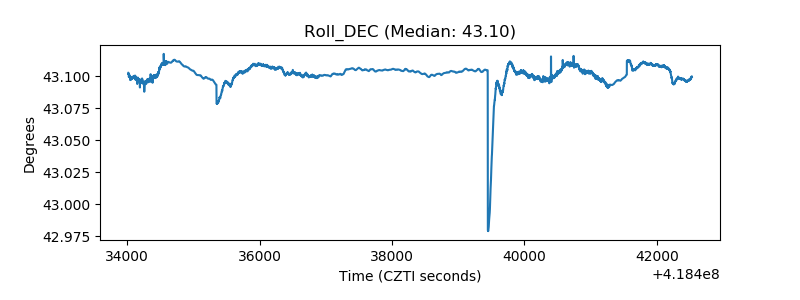 |
| _Roll_RA | 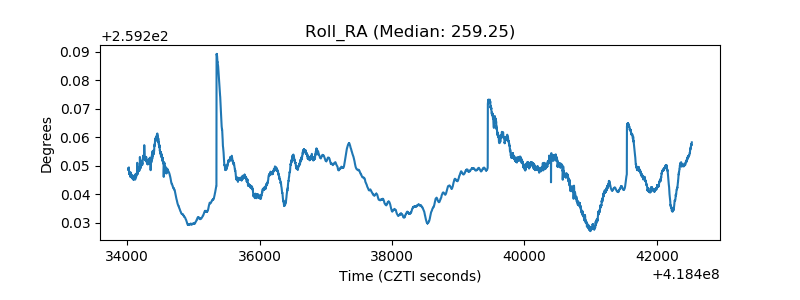 |
| Veto Counter | 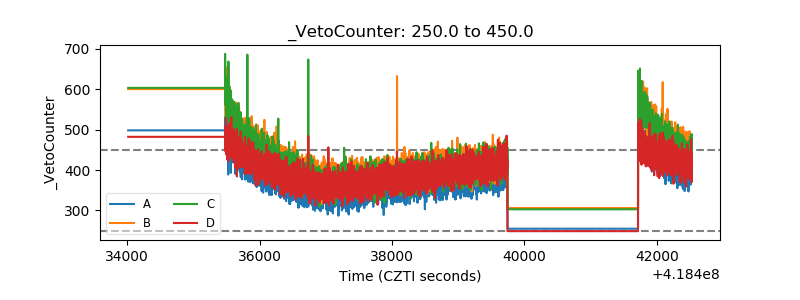 |