| Param | Original file | Final file |
|---|---|---|
| Filename | modeM0/AS1A12_029T02_9000005558_40663cztM0_level2.fits | modeM0/AS1A12_029T02_9000005558_40663cztM0_level2_quad_clean.evt |
| Size (bytes) | 307,437,120 | 86,653,440 |
| Size | 293.2 MB | 82.6 MB |
| Events in quadrant A | 2,702,867 | 599,005 |
| Events in quadrant B | 2,632,279 | 620,050 |
| Events in quadrant C | 2,419,047 | 587,644 |
| Events in quadrant D | 3,236,671 | 467,476 |
| Mode M0 | |||
|---|---|---|---|
| Quadrant | BADHDUFLAG | Total packets | Discarded packets |
| A | 0 | 11024 | 3 |
| B | 0 | 11077 | 2 |
| C | 0 | 10191 | 2 |
| D | 0 | 13105 | 2 |
| Mode M9 | |||
|---|---|---|---|
| Quadrant | BADHDUFLAG | Total packets | Discarded packets |
| A | 0 | 29 | 0 |
| B | 0 | 29 | 0 |
| C | 0 | 29 | 0 |
| D | 0 | 30 | 0 |
| Mode SS | |||
|---|---|---|---|
| Quadrant | BADHDUFLAG | Total packets | Discarded packets |
| A | 0 | 102 | 0 |
| B | 0 | 102 | 0 |
| C | 0 | 102 | 0 |
| D | 0 | 102 | 0 |
| Quadrant | Total seconds | Saturated seconds | Saturation percentage |
|---|---|---|---|
| A | 4988 | 7 | 0.140337% |
| B | 4988 | 42 | 0.842021% |
| C | 4988 | 7 | 0.140337% |
| D | 4988 | 679 | 13.612670% |
Noise dominated data is calculated using 1-second bins in cleaned event files. If a bin has >2000 counts, and if more than 50% of those come from <1% of pixels, then it is considered to be noise-dominated and hence unusable.
| Quadrant | # 1 sec bins | Bins with >0 counts | Bins with >2000 counts | High rate bins dominated by noise | Noise dominated (total time) | Noise dominated (detector-on time) | Marked lightcurve |
|---|---|---|---|---|---|---|---|
| A | 7050 | 4989 | 3 | 3 | 0.04% | 0.06% | 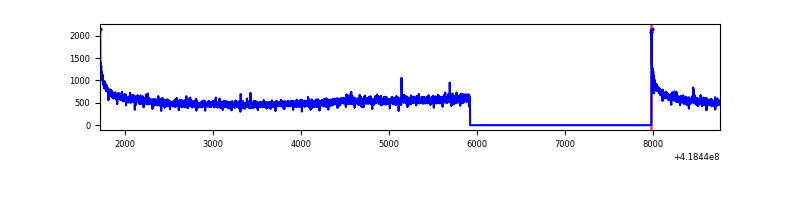 |
| B | 7050 | 4989 | 32 | 32 | 0.45% | 0.64% | 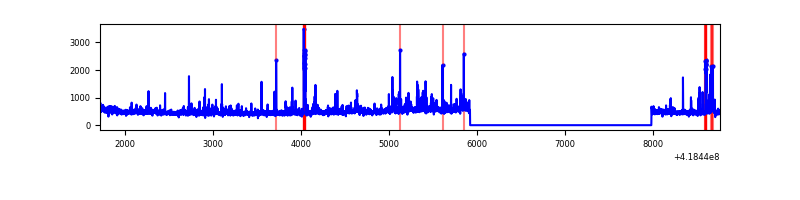 |
| C | 7050 | 4989 | 2 | 2 | 0.03% | 0.04% | 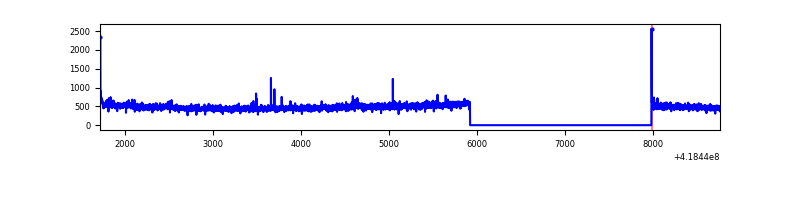 |
| D | 7049 | 4988 | 280 | 280 | 3.97% | 5.61% | 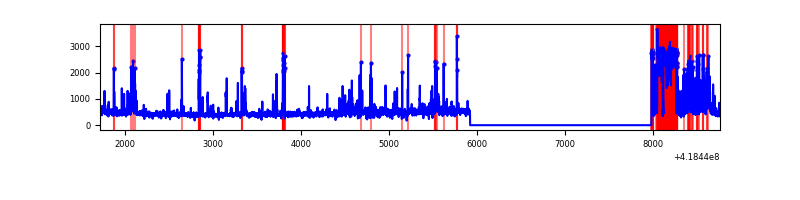 |
Top three noisy pixels from each quadrant. If the there are fewer than three noisy pixels in the level2.evt file, extra rows are filled as -1
| Pixel properties | Quadrant properties | ||||||
|---|---|---|---|---|---|---|---|
| Quadrant | DetID | PixID | Counts | Sigma | Mean | Median | Sigma |
| A | 10 | 83 | 471090 | 4080.31 | 565 | 554 | 115.3 |
| A | 15 | 191 | 20826 | 175.79 | 565 | 554 | 115.3 |
| A | 13 | 6 | 15092 | 126.06 | 565 | 554 | 115.3 |
| B | 0 | 229 | 278573 | 2530.06 | 565 | 549 | 109.9 |
| B | 0 | 190 | 81114 | 733.15 | 565 | 549 | 109.9 |
| B | 4 | 171 | 26697 | 237.95 | 565 | 549 | 109.9 |
| C | 15 | 214 | 218779 | 1708.76 | 550 | 553 | 127.7 |
| C | 3 | 233 | 27394 | 210.17 | 550 | 553 | 127.7 |
| C | 0 | 10 | 14487 | 109.11 | 550 | 553 | 127.7 |
| D | 12 | 227 | 763150 | 6146.98 | 503 | 489 | 124.1 |
| D | 2 | 250 | 150891 | 1212.23 | 503 | 489 | 124.1 |
| D | 12 | 191 | 141396 | 1135.7 | 503 | 489 | 124.1 |
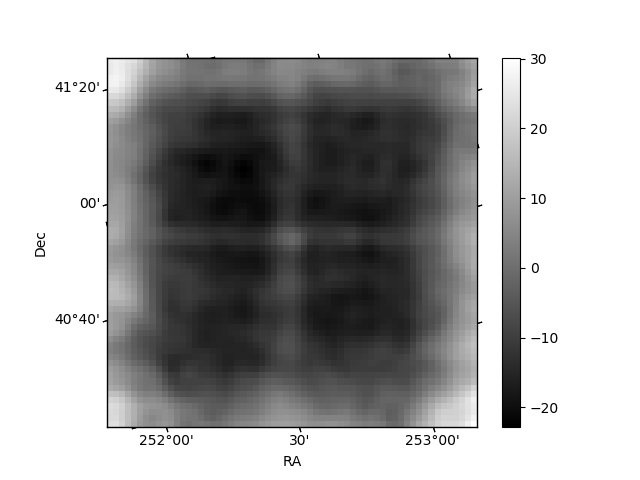
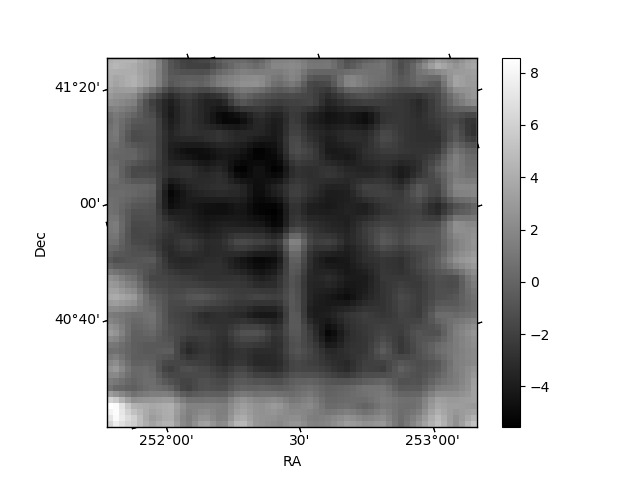
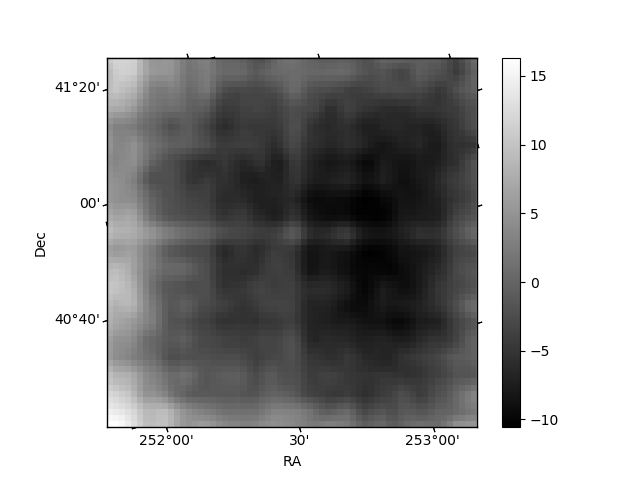
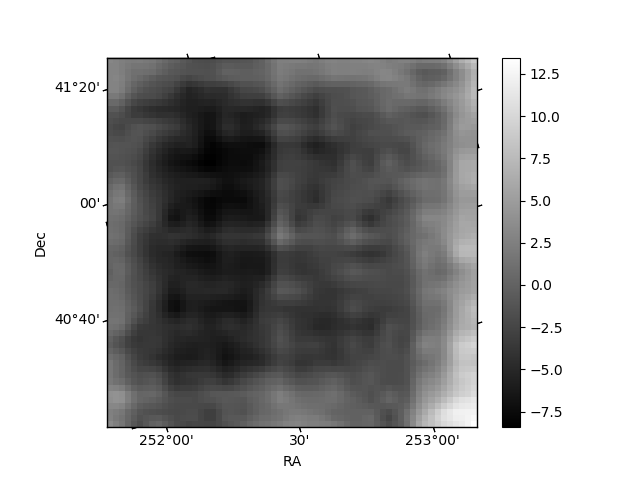
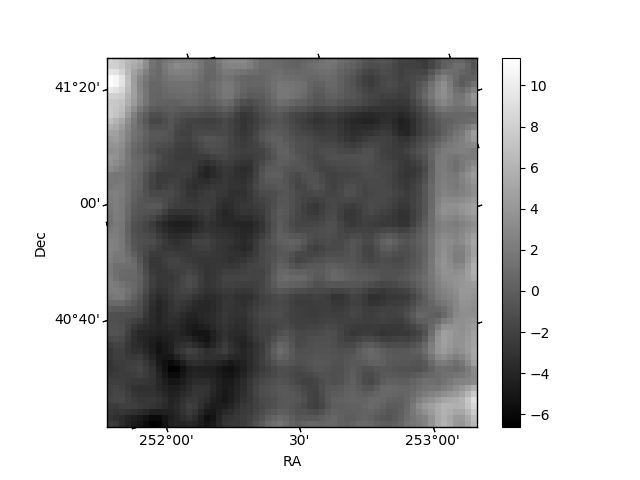
Histogram calculated using DETX and DETY for each event in the final _common_clean file
| Quadrant A | 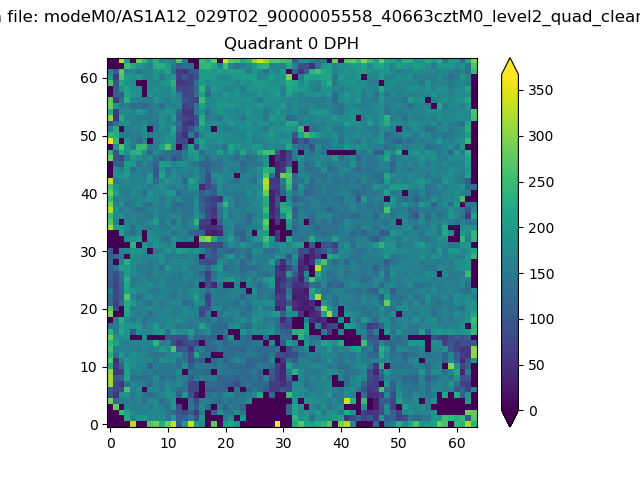 |
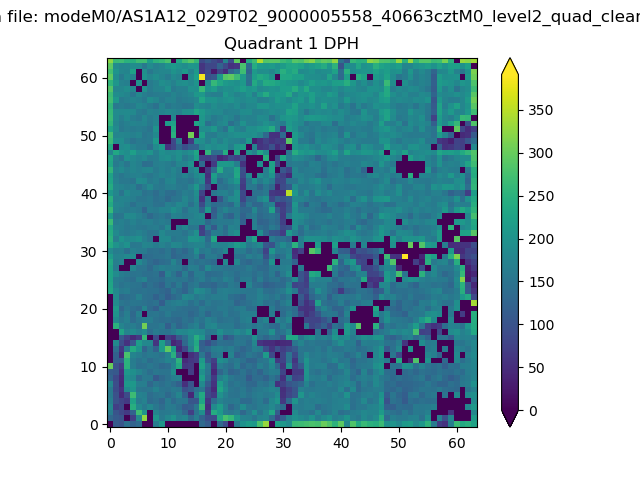 |
Quadrant B |
|---|---|---|---|
| Quadrant D | 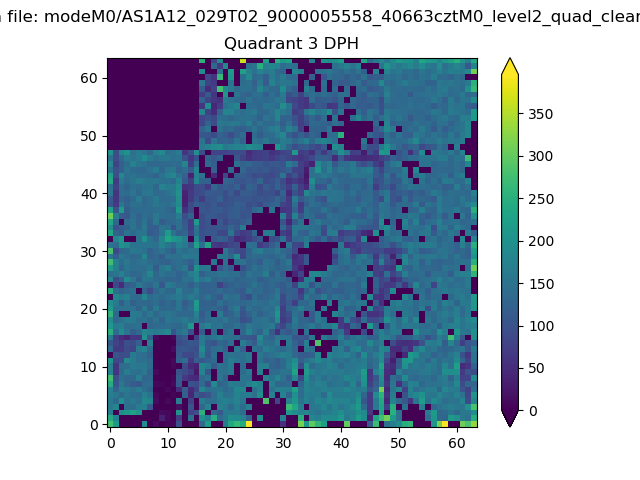 |
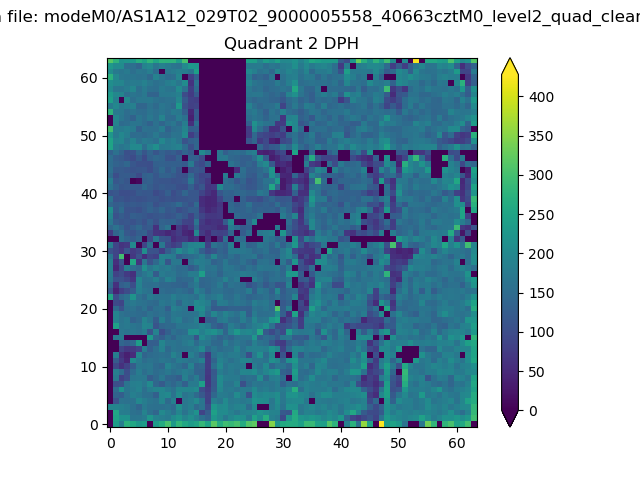 |
Quadrant C |
| Plot type | Count rate plots | Images |
|---|---|---|
| Comparison with Poisson distribution Blue bars denote a histogram of data divided into 1 sec bins. Red curve is a Poisson curve with rate = median count rate of data. |
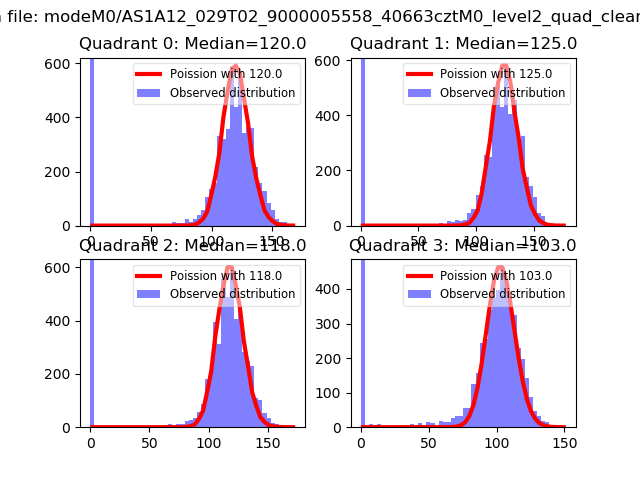 |
 |
| Quadrant-wise count rates Data is divided into 100 sec bins |
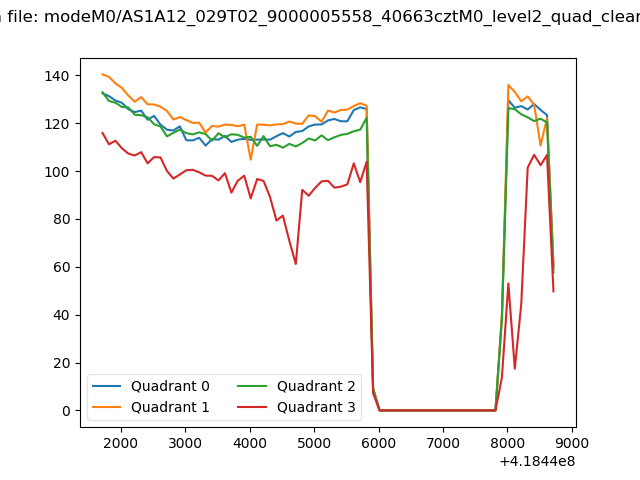 |
|
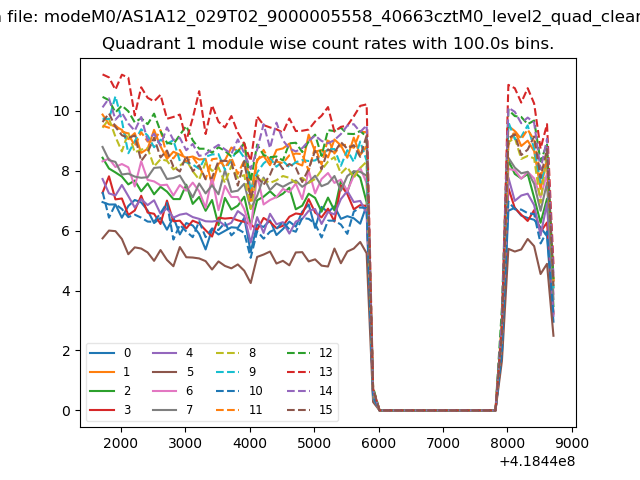
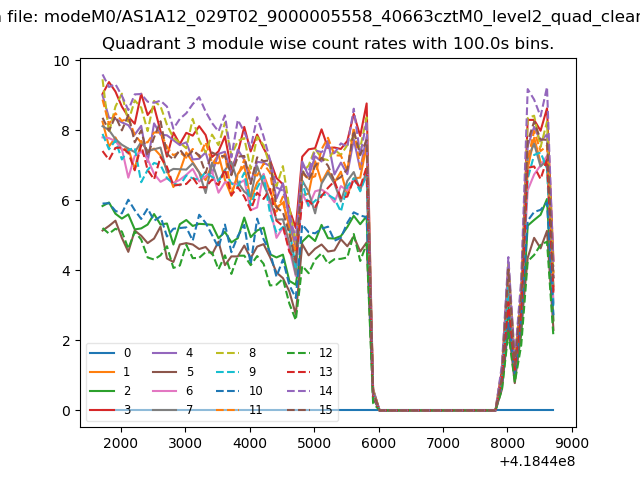
| Module-wise count rates for Quadrant A Data is divided into 100 sec bins |
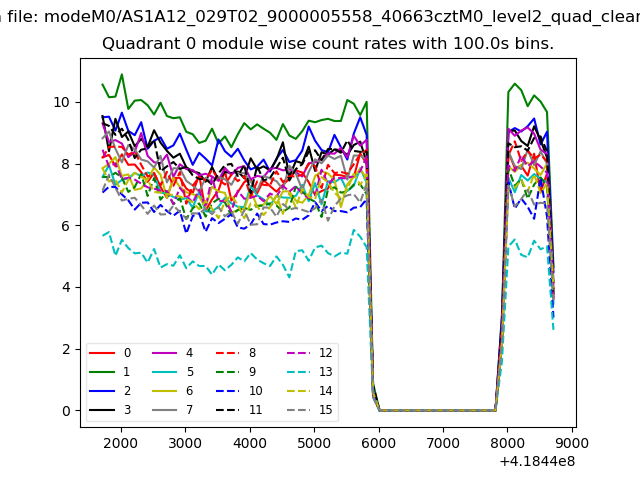 |
 |
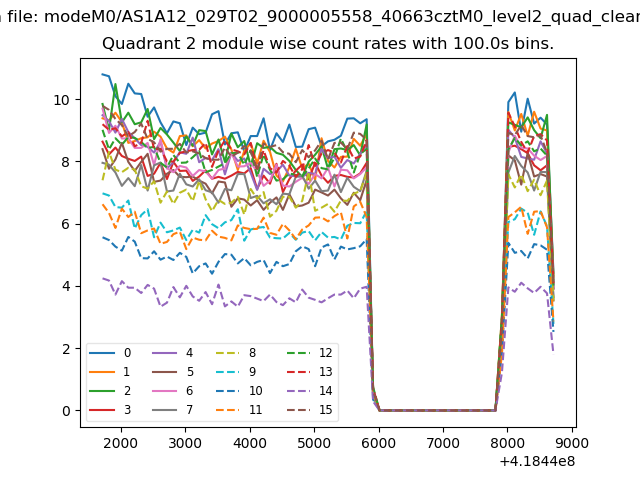
| Module-wise count rates for Quadrant B Data is divided into 100 sec bins |
 |
 |
| Module-wise count rates for Quadrant C Data is divided into 100 sec bins |
 |
 |
| Module-wise count rates for Quadrant D Data is divided into 100 sec bins |
 |
 |
| Parameter | Plot |
|---|---|
| CZT HV Monitor | 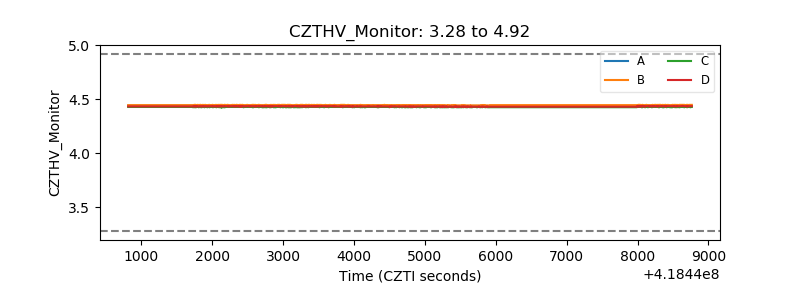 |
| D_VDD | 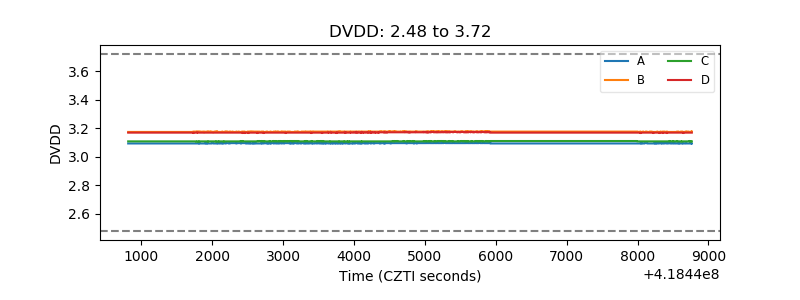 |
| Temperature 1 | 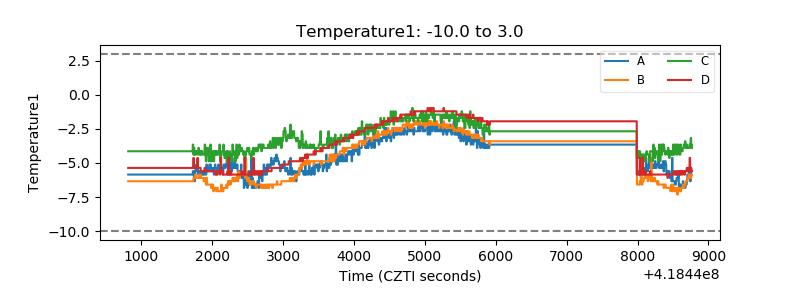 |
| Veto HV Monitor | 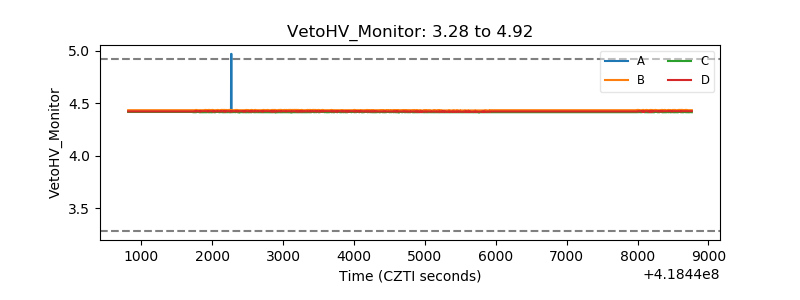 |
| Veto LLD | 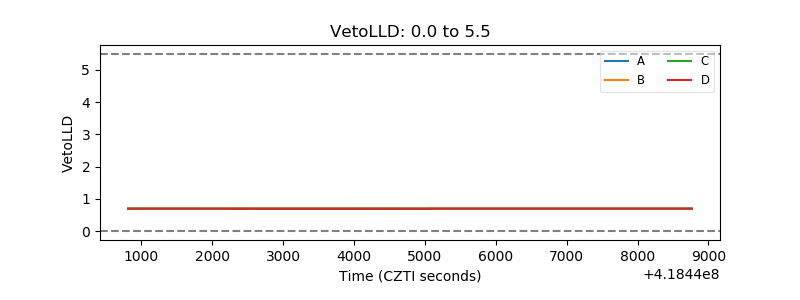 |
| Alpha Counter | 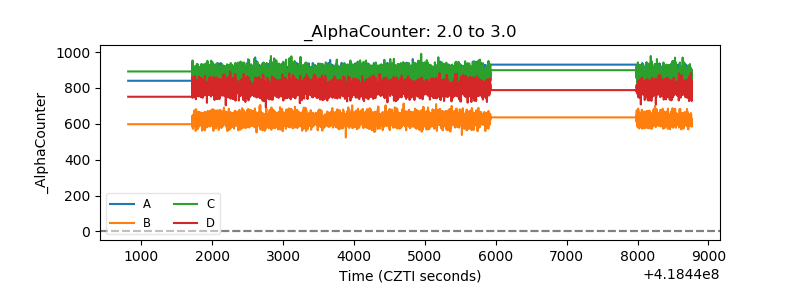 |
| _CPM_Rate | 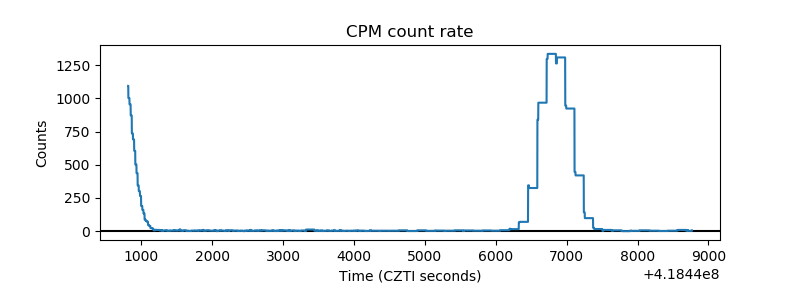 |
| CZT Counter | 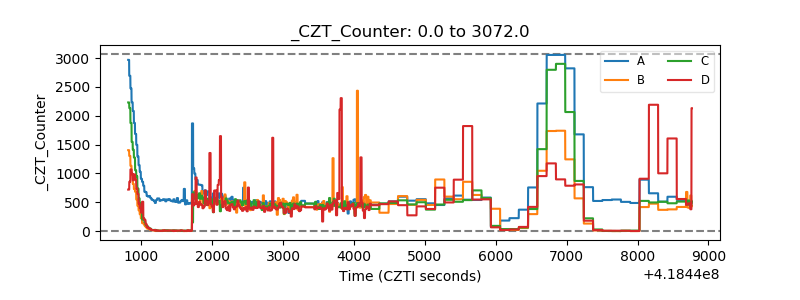 |
| +2.5 Volts monitor | 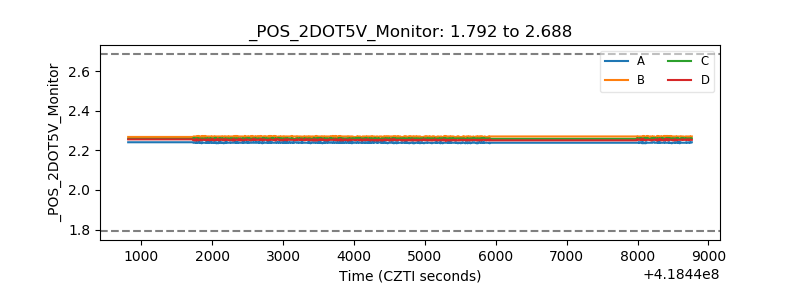 |
| +5 Volts monitor | 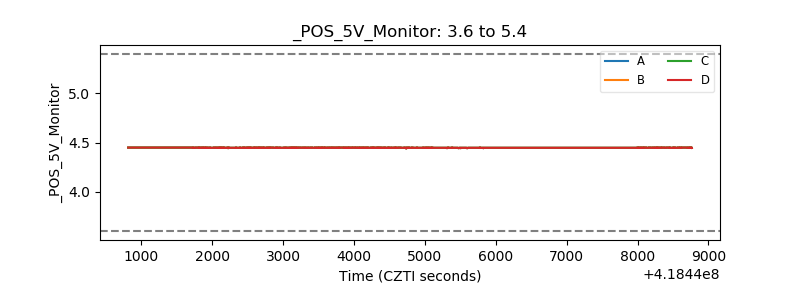 |
| _ROLL_ROT | 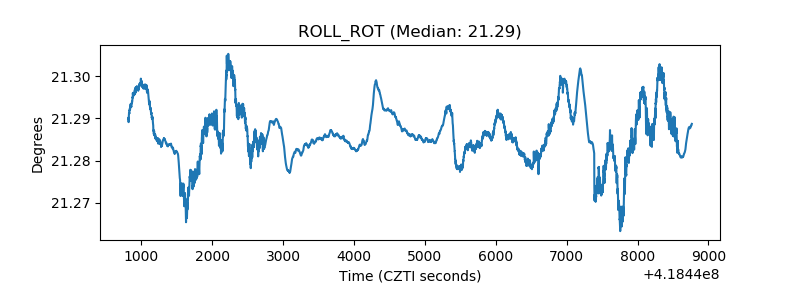 |
| _Roll_DEC | 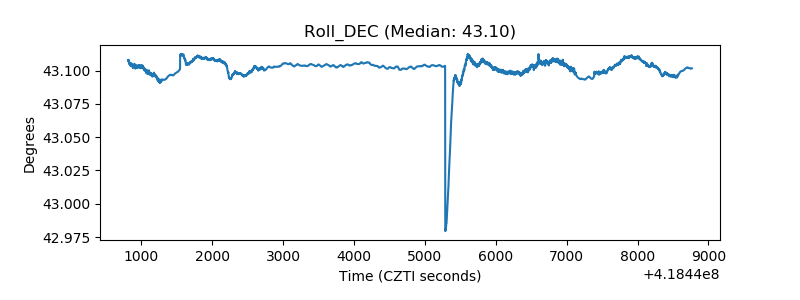 |
| _Roll_RA | 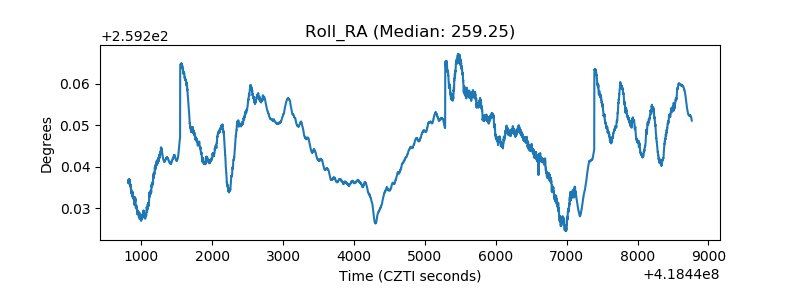 |
| Veto Counter | 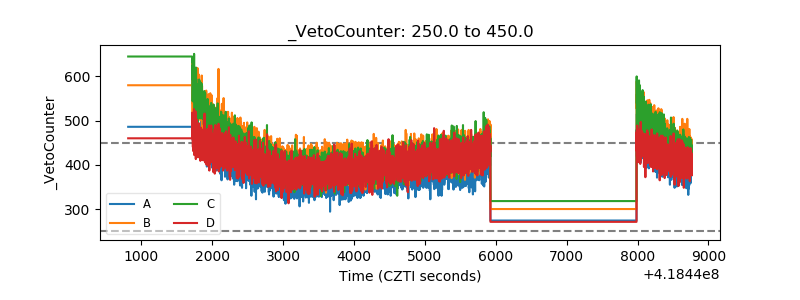 |