| Param | Original file | Final file |
|---|---|---|
| Filename | modeM0/AS1A12_029T02_9000005558_40665cztM0_level2.fits | modeM0/AS1A12_029T02_9000005558_40665cztM0_level2_quad_clean.evt |
| Size (bytes) | 324,990,720 | 85,584,960 |
| Size | 309.9 MB | 81.6 MB |
| Events in quadrant A | 2,840,488 | 591,327 |
| Events in quadrant B | 2,684,439 | 611,485 |
| Events in quadrant C | 2,517,316 | 579,555 |
| Events in quadrant D | 3,580,841 | 443,891 |
| Mode M0 | |||
|---|---|---|---|
| Quadrant | BADHDUFLAG | Total packets | Discarded packets |
| A | 0 | 11382 | 3 |
| B | 0 | 11413 | 2 |
| C | 0 | 10720 | 2 |
| D | 0 | 14269 | 2 |
| Mode M9 | |||
|---|---|---|---|
| Quadrant | BADHDUFLAG | Total packets | Discarded packets |
| A | 0 | 31 | 0 |
| B | 0 | 31 | 0 |
| C | 0 | 31 | 0 |
| D | 0 | 32 | 0 |
| Mode SS | |||
|---|---|---|---|
| Quadrant | BADHDUFLAG | Total packets | Discarded packets |
| A | 0 | 106 | 0 |
| B | 0 | 106 | 0 |
| C | 0 | 106 | 0 |
| D | 0 | 106 | 0 |
| Quadrant | Total seconds | Saturated seconds | Saturation percentage |
|---|---|---|---|
| A | 5214 | 9 | 0.172612% |
| B | 5214 | 25 | 0.479478% |
| C | 5214 | 19 | 0.364404% |
| D | 5214 | 934 | 17.913310% |
Noise dominated data is calculated using 1-second bins in cleaned event files. If a bin has >2000 counts, and if more than 50% of those come from <1% of pixels, then it is considered to be noise-dominated and hence unusable.
| Quadrant | # 1 sec bins | Bins with >0 counts | Bins with >2000 counts | High rate bins dominated by noise | Noise dominated (total time) | Noise dominated (detector-on time) | Marked lightcurve |
|---|---|---|---|---|---|---|---|
| A | 7307 | 5215 | 5 | 5 | 0.07% | 0.10% | 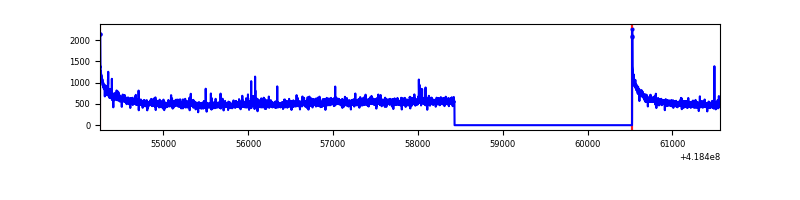 |
| B | 7307 | 5215 | 9 | 9 | 0.12% | 0.17% | 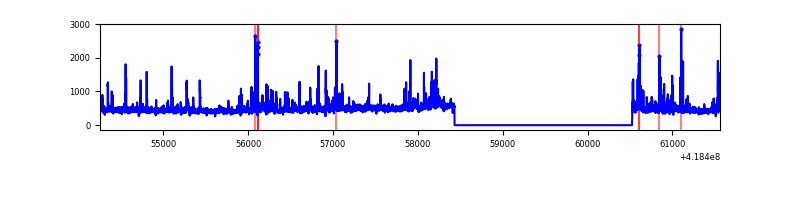 |
| C | 7307 | 5215 | 15 | 15 | 0.21% | 0.29% | 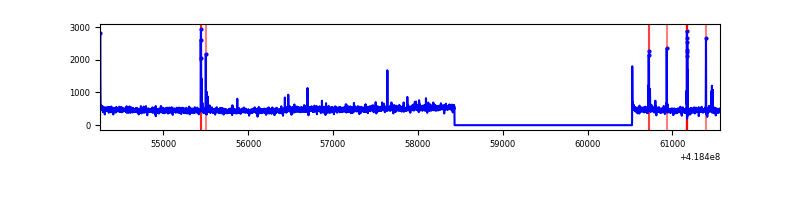 |
| D | 7307 | 5215 | 270 | 270 | 3.70% | 5.18% | 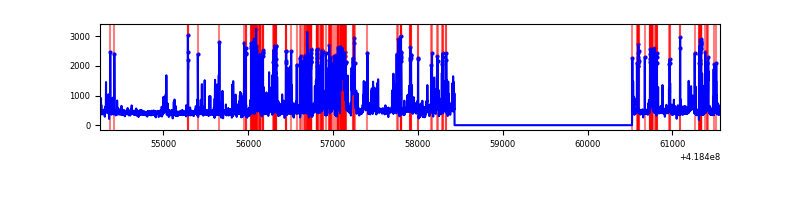 |
Top three noisy pixels from each quadrant. If the there are fewer than three noisy pixels in the level2.evt file, extra rows are filled as -1
| Pixel properties | Quadrant properties | ||||||
|---|---|---|---|---|---|---|---|
| Quadrant | DetID | PixID | Counts | Sigma | Mean | Median | Sigma |
| A | 10 | 83 | 491502 | 4127.45 | 584 | 572 | 118.9 |
| A | 15 | 191 | 32234 | 266.2 | 584 | 572 | 118.9 |
| A | 12 | 189 | 25590 | 210.34 | 584 | 572 | 118.9 |
| B | 0 | 229 | 242692 | 2187.7 | 576 | 560 | 110.7 |
| B | 0 | 190 | 64479 | 577.52 | 576 | 560 | 110.7 |
| B | 0 | 230 | 47004 | 419.63 | 576 | 560 | 110.7 |
| C | 15 | 214 | 227675 | 1722.06 | 561 | 566 | 131.9 |
| C | 14 | 254 | 57124 | 428.85 | 561 | 566 | 131.9 |
| C | 12 | 251 | 15794 | 115.47 | 561 | 566 | 131.9 |
| D | 2 | 153 | 467097 | 3714.12 | 508 | 493 | 125.6 |
| D | 12 | 227 | 461637 | 3670.66 | 508 | 493 | 125.6 |
| D | 13 | 249 | 191596 | 1521.16 | 508 | 493 | 125.6 |
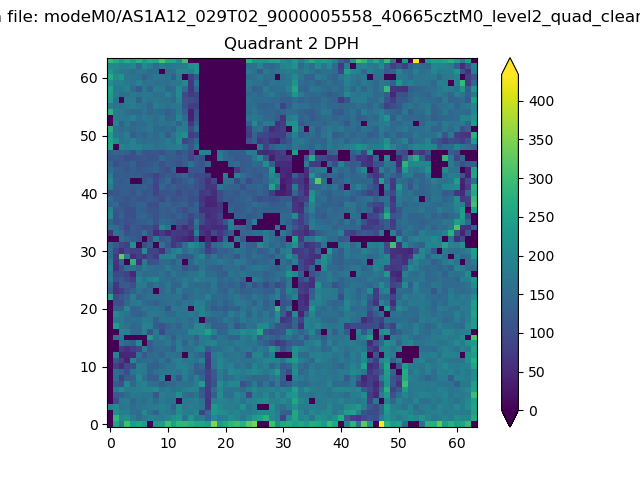
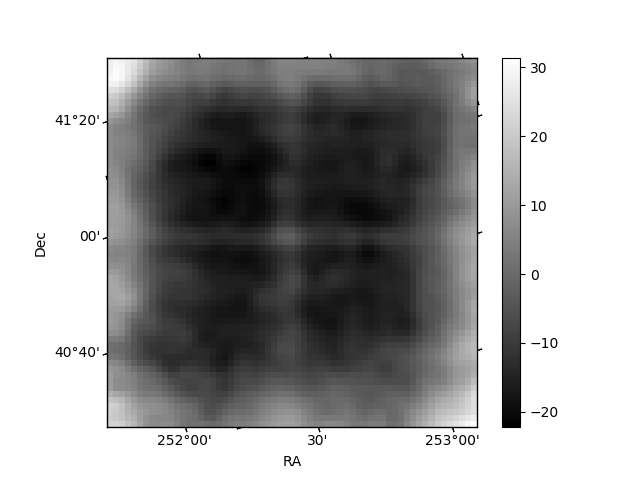
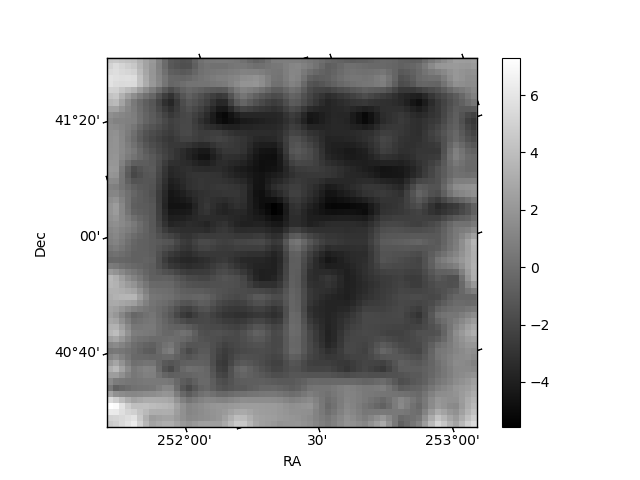
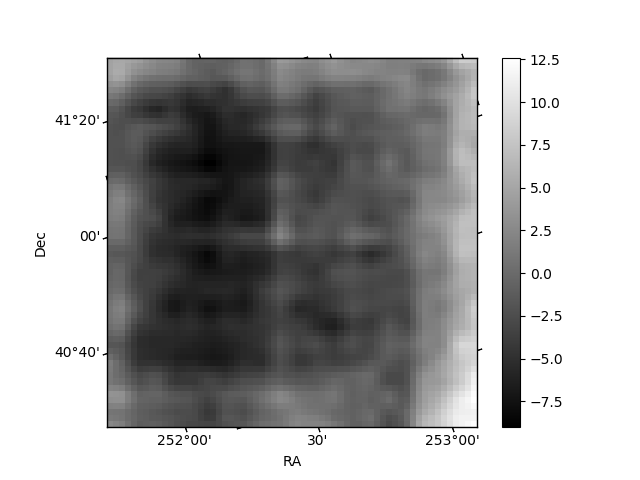
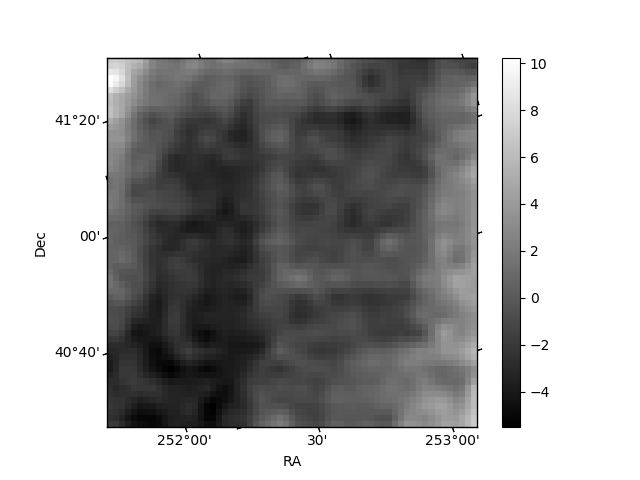
Histogram calculated using DETX and DETY for each event in the final _common_clean file
| Quadrant A | 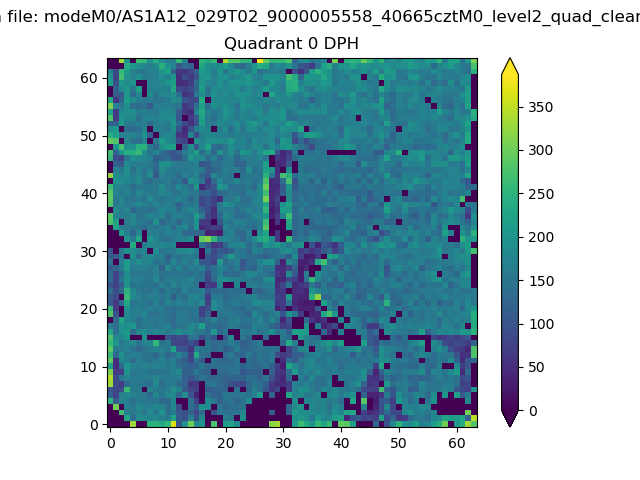 |
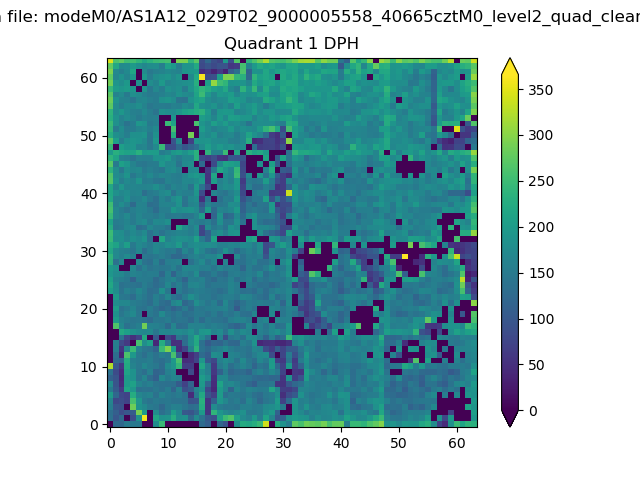 |
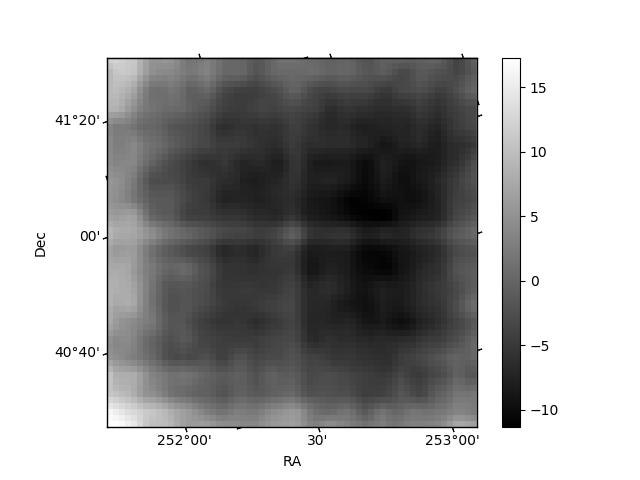
Quadrant B |
|---|---|---|---|
| Quadrant D | 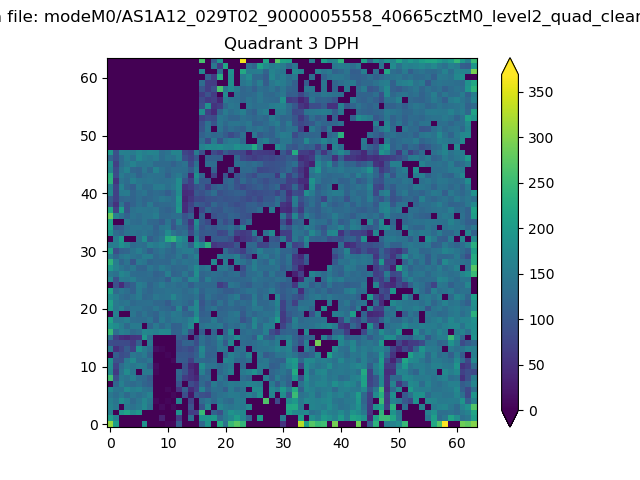 |
 |
Quadrant C |
| Plot type | Count rate plots | Images |
|---|---|---|
| Comparison with Poisson distribution Blue bars denote a histogram of data divided into 1 sec bins. Red curve is a Poisson curve with rate = median count rate of data. |
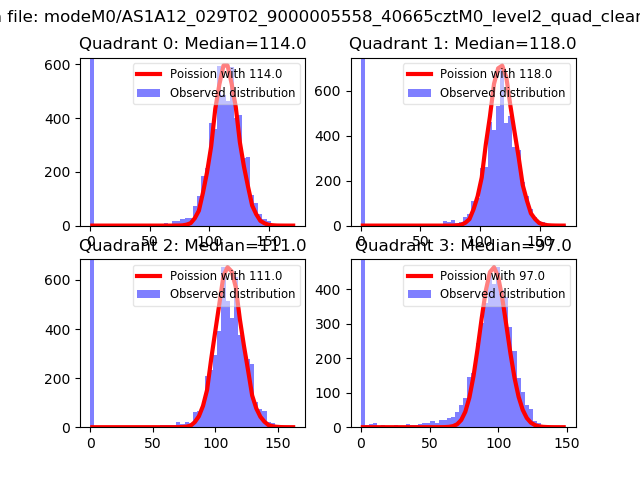 |
 |
| Quadrant-wise count rates Data is divided into 100 sec bins |
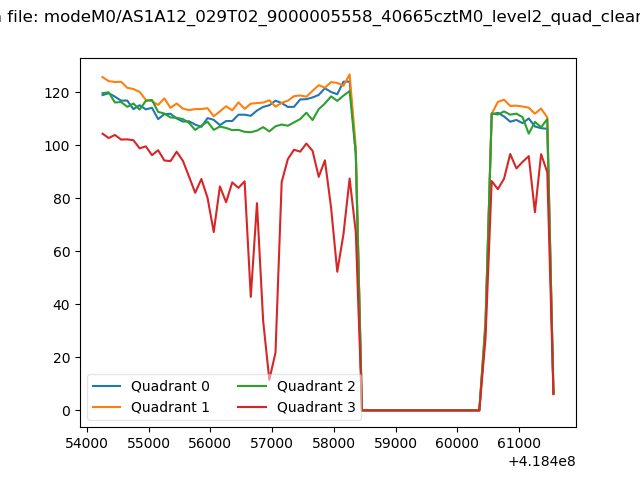 |
|
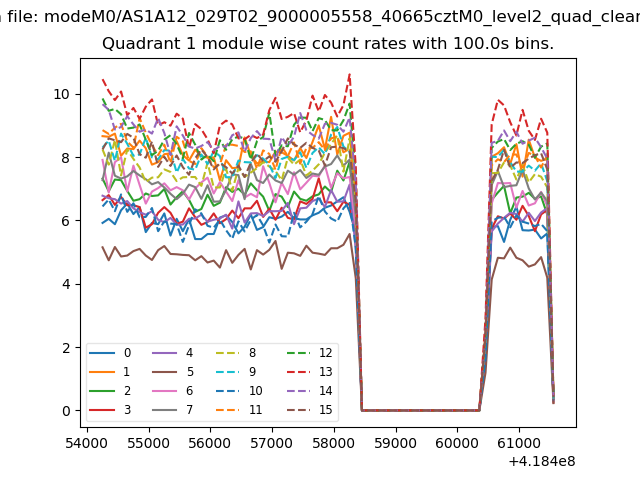
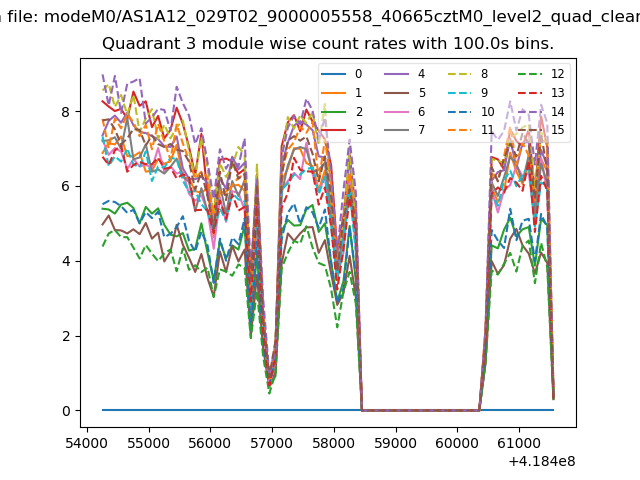
| Module-wise count rates for Quadrant A Data is divided into 100 sec bins |
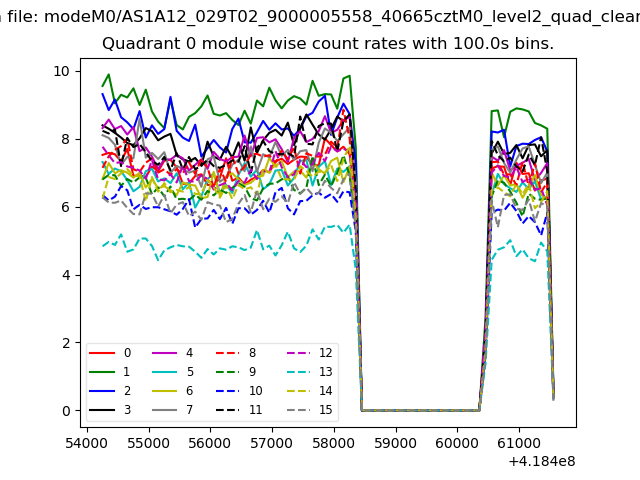 |
 |
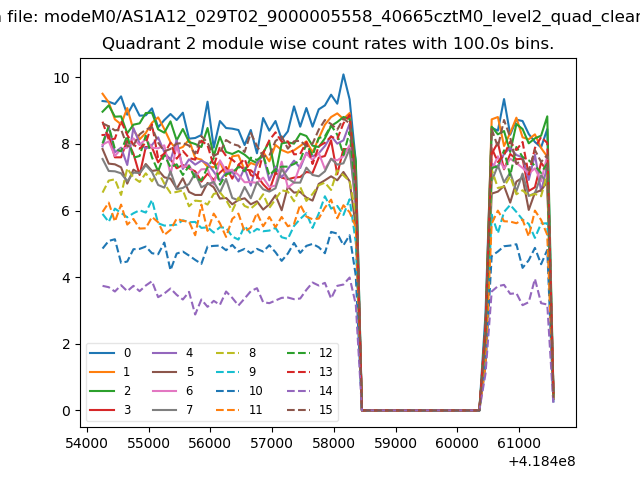
| Module-wise count rates for Quadrant B Data is divided into 100 sec bins |
 |
 |
| Module-wise count rates for Quadrant C Data is divided into 100 sec bins |
 |
 |
| Module-wise count rates for Quadrant D Data is divided into 100 sec bins |
 |
 |
| Parameter | Plot |
|---|---|
| CZT HV Monitor | 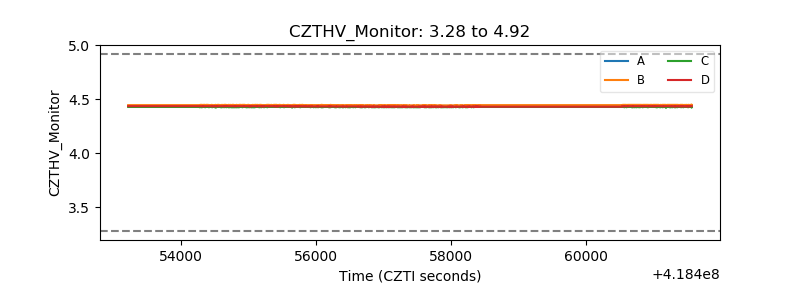 |
| D_VDD | 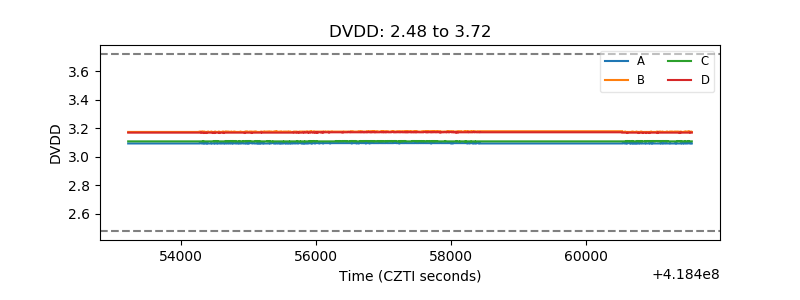 |
| Temperature 1 | 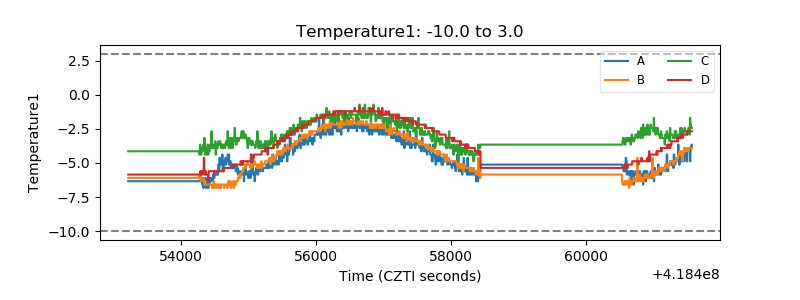 |
| Veto HV Monitor | 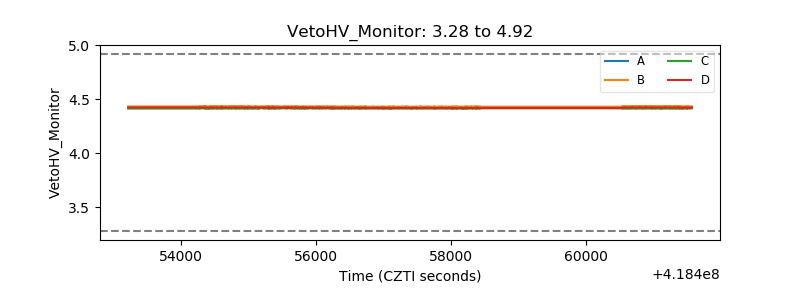 |
| Veto LLD | 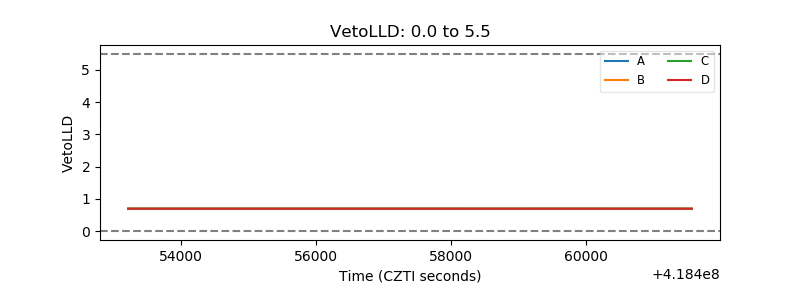 |
| Alpha Counter | 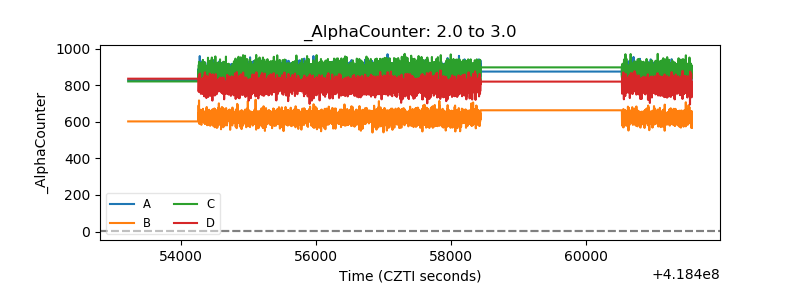 |
| _CPM_Rate | 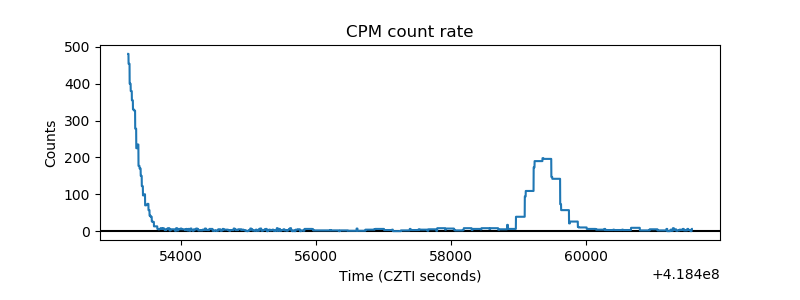 |
| CZT Counter | 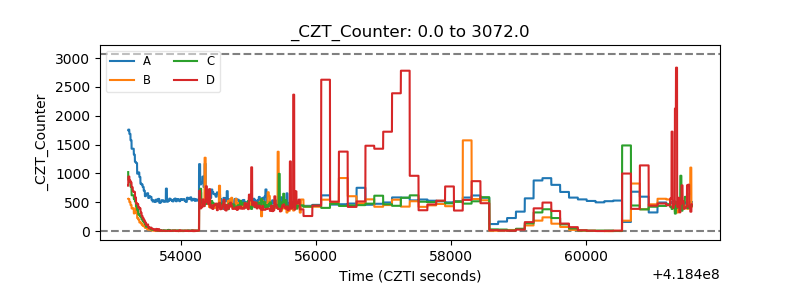 |
| +2.5 Volts monitor | 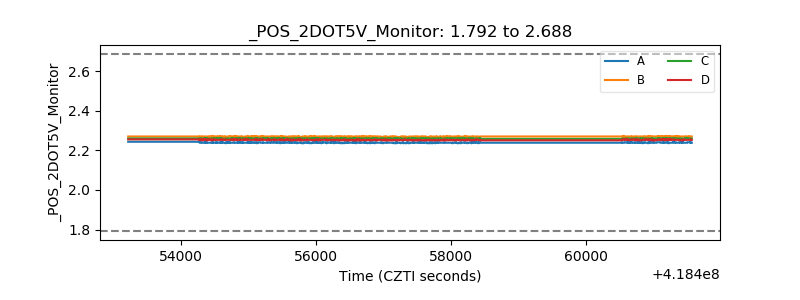 |
| +5 Volts monitor | 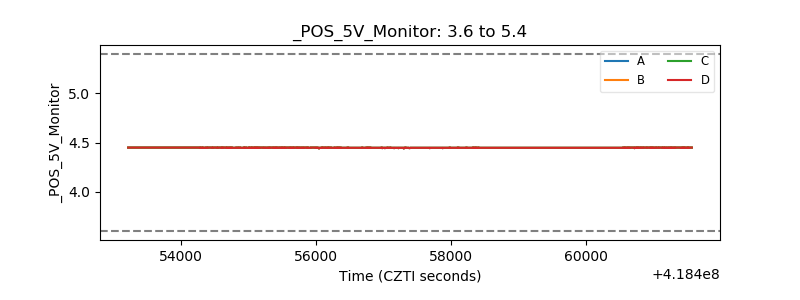 |
| _ROLL_ROT | 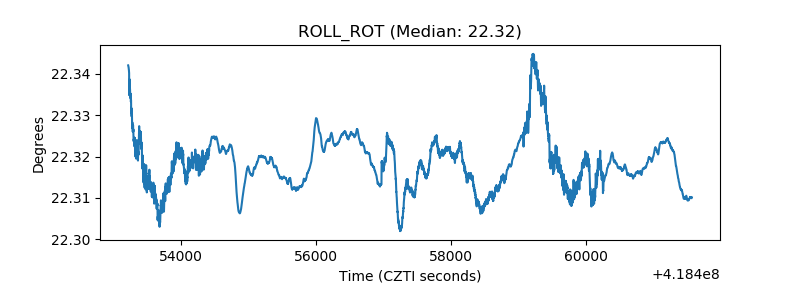 |
| _Roll_DEC | 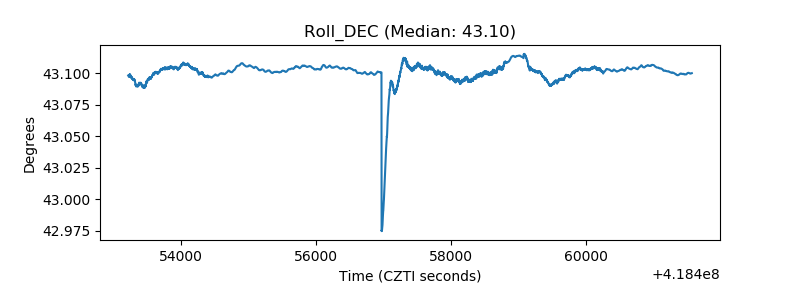 |
| _Roll_RA | 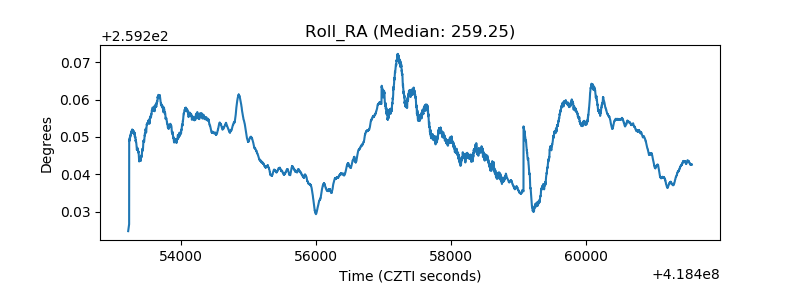 |
| Veto Counter | 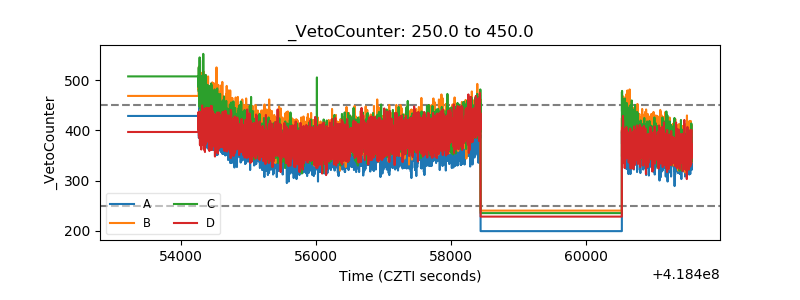 |