| Param | Original file | Final file |
|---|---|---|
| Filename | modeM0/AS1A12_029T02_9000005558_40666cztM0_level2.fits | modeM0/AS1A12_029T02_9000005558_40666cztM0_level2_quad_clean.evt |
| Size (bytes) | 335,168,640 | 85,518,720 |
| Size | 319.6 MB | 81.6 MB |
| Events in quadrant A | 2,857,208 | 588,130 |
| Events in quadrant B | 2,816,455 | 605,155 |
| Events in quadrant C | 2,929,084 | 570,259 |
| Events in quadrant D | 3,386,461 | 450,923 |
| Mode M0 | |||
|---|---|---|---|
| Quadrant | BADHDUFLAG | Total packets | Discarded packets |
| A | 0 | 11529 | 3 |
| B | 0 | 11841 | 2 |
| C | 0 | 12056 | 2 |
| D | 0 | 13690 | 2 |
| Mode M9 | |||
|---|---|---|---|
| Quadrant | BADHDUFLAG | Total packets | Discarded packets |
| A | 0 | 19 | 0 |
| B | 0 | 19 | 0 |
| C | 0 | 19 | 0 |
| D | 0 | 19 | 0 |
| Mode SS | |||
|---|---|---|---|
| Quadrant | BADHDUFLAG | Total packets | Discarded packets |
| A | 0 | 110 | 0 |
| B | 0 | 110 | 0 |
| C | 0 | 110 | 0 |
| D | 0 | 110 | 0 |
| Quadrant | Total seconds | Saturated seconds | Saturation percentage |
|---|---|---|---|
| A | 5349 | 5 | 0.093475% |
| B | 5349 | 43 | 0.803889% |
| C | 5349 | 87 | 1.626472% |
| D | 5350 | 909 | 16.990654% |
Noise dominated data is calculated using 1-second bins in cleaned event files. If a bin has >2000 counts, and if more than 50% of those come from <1% of pixels, then it is considered to be noise-dominated and hence unusable.
| Quadrant | # 1 sec bins | Bins with >0 counts | Bins with >2000 counts | High rate bins dominated by noise | Noise dominated (total time) | Noise dominated (detector-on time) | Marked lightcurve |
|---|---|---|---|---|---|---|---|
| A | 7291 | 5350 | 5 | 5 | 0.07% | 0.09% | 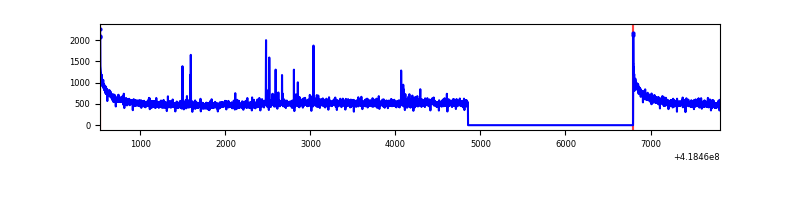 |
| B | 7291 | 5350 | 18 | 18 | 0.25% | 0.34% | 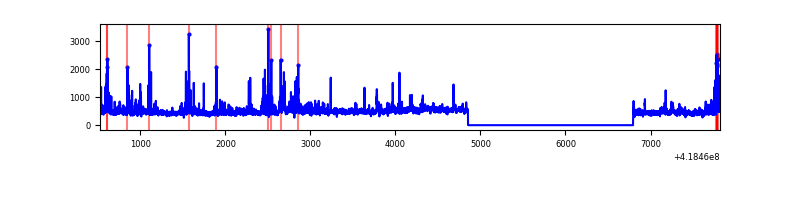 |
| C | 7291 | 5350 | 85 | 85 | 1.17% | 1.59% | 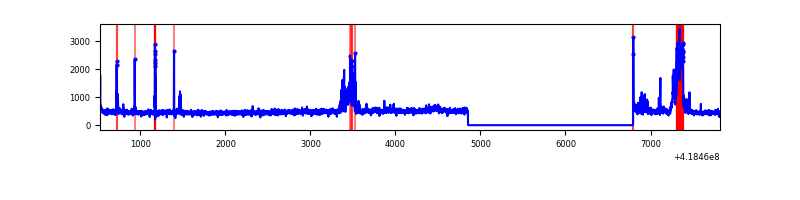 |
| D | 7292 | 5351 | 143 | 143 | 1.96% | 2.67% | 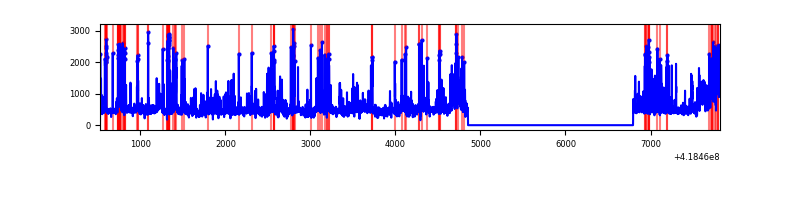 |
Top three noisy pixels from each quadrant. If the there are fewer than three noisy pixels in the level2.evt file, extra rows are filled as -1
| Pixel properties | Quadrant properties | ||||||
|---|---|---|---|---|---|---|---|
| Quadrant | DetID | PixID | Counts | Sigma | Mean | Median | Sigma |
| A | 10 | 83 | 498506 | 4101.29 | 591 | 579 | 121.4 |
| A | 12 | 189 | 27942 | 225.38 | 591 | 579 | 121.4 |
| A | 2 | 79 | 25136 | 202.27 | 591 | 579 | 121.4 |
| B | 0 | 229 | 265533 | 2337.43 | 585 | 568 | 113.4 |
| B | 0 | 190 | 94485 | 828.5 | 585 | 568 | 113.4 |
| B | 0 | 230 | 78578 | 688.18 | 585 | 568 | 113.4 |
| C | 14 | 254 | 421115 | 3146.53 | 571 | 574 | 133.7 |
| C | 15 | 214 | 232666 | 1736.54 | 571 | 574 | 133.7 |
| C | 0 | 10 | 16839 | 121.7 | 571 | 574 | 133.7 |
| D | 12 | 227 | 553368 | 4225.95 | 524 | 508 | 130.8 |
| D | 12 | 191 | 193668 | 1476.47 | 524 | 508 | 130.8 |
| D | 13 | 249 | 189374 | 1443.65 | 524 | 508 | 130.8 |
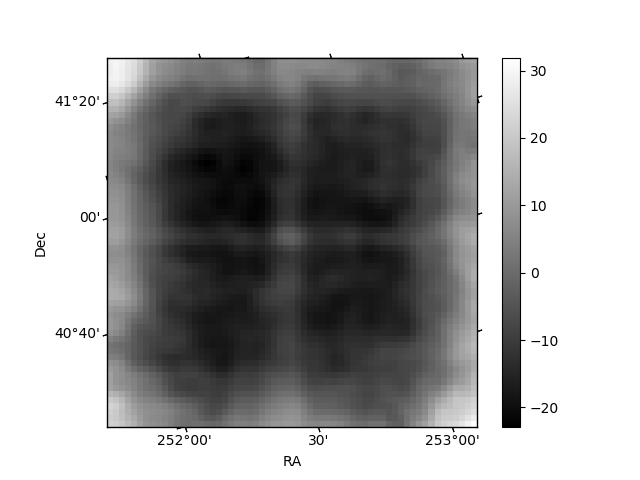
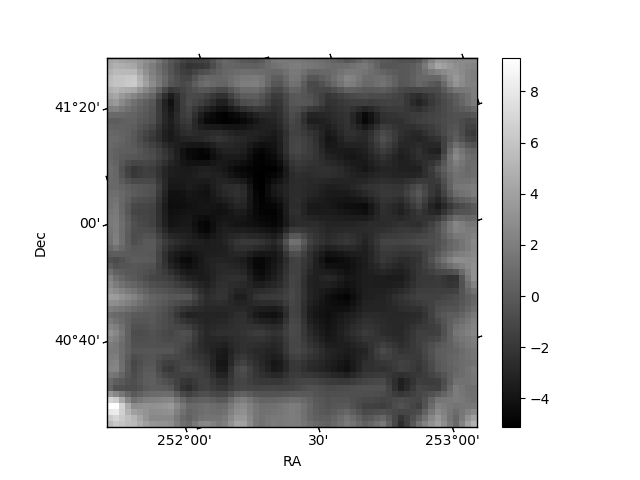
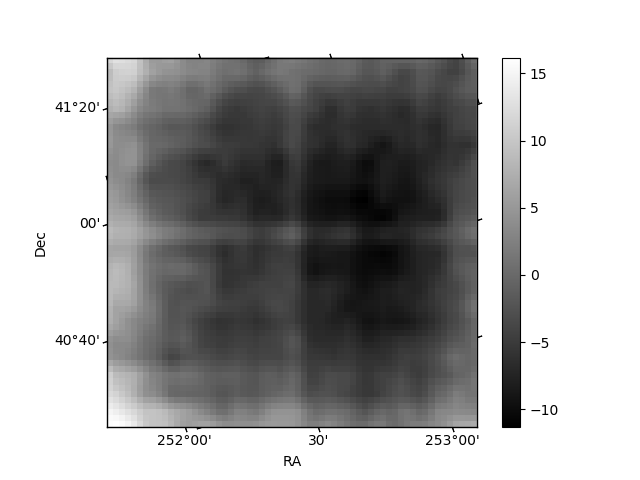
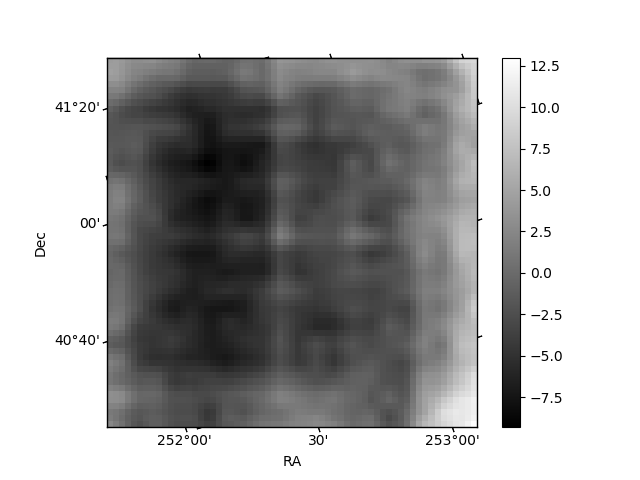
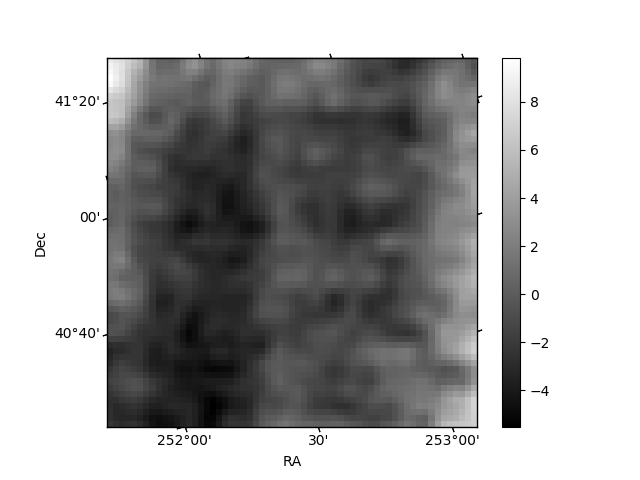
Histogram calculated using DETX and DETY for each event in the final _common_clean file
| Quadrant A | 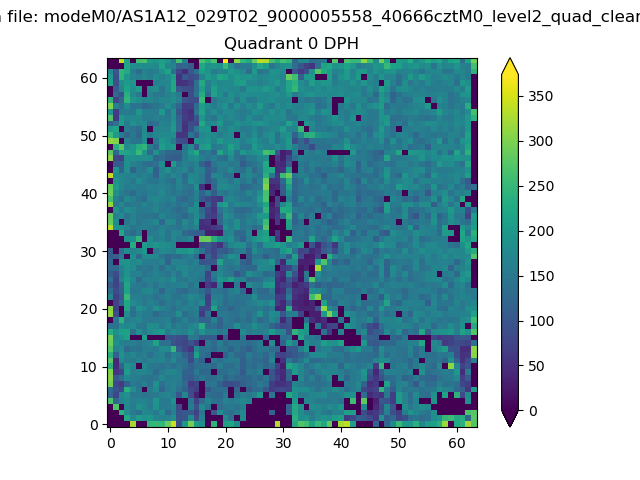 |
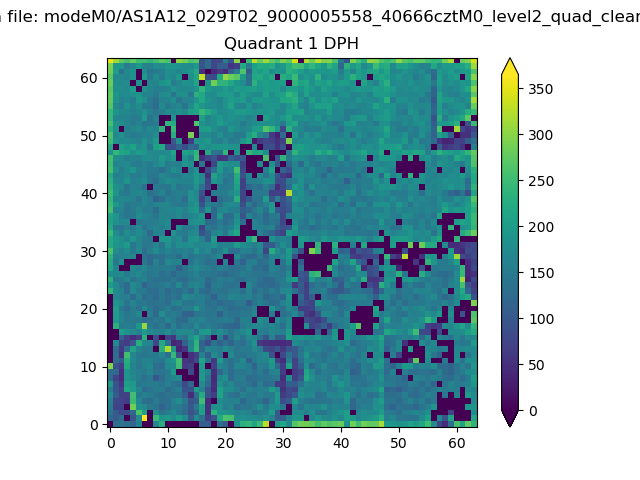 |
Quadrant B |
|---|---|---|---|
| Quadrant D | 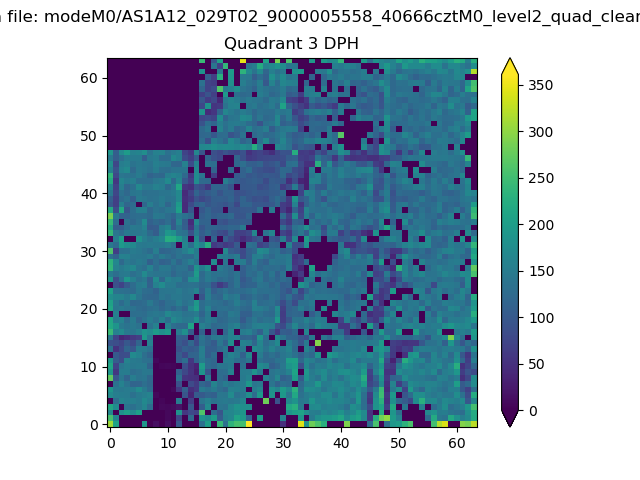 |
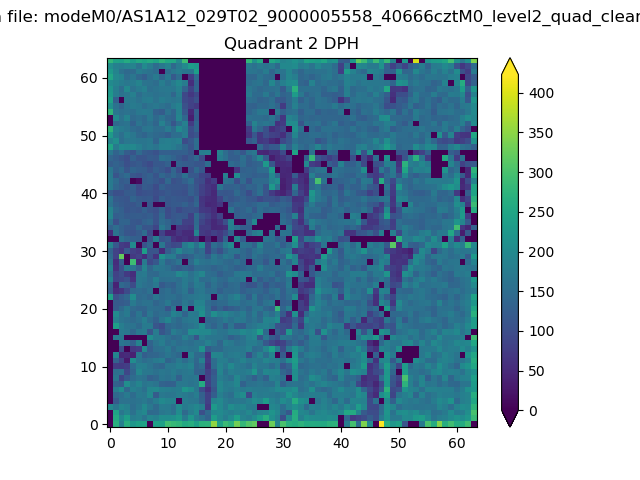 |
Quadrant C |
| Plot type | Count rate plots | Images |
|---|---|---|
| Comparison with Poisson distribution Blue bars denote a histogram of data divided into 1 sec bins. Red curve is a Poisson curve with rate = median count rate of data. |
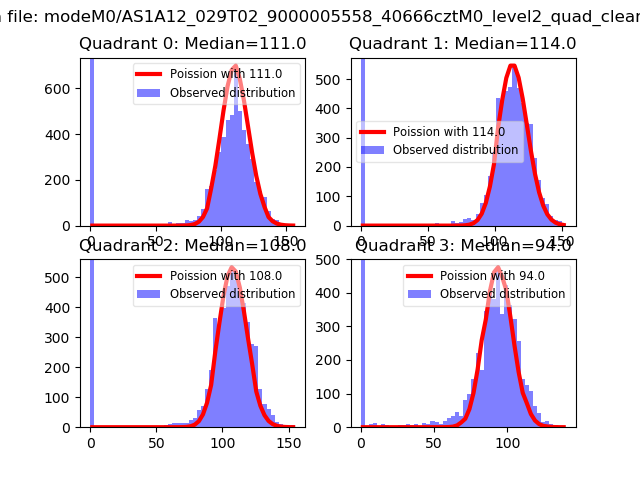 |
 |
| Quadrant-wise count rates Data is divided into 100 sec bins |
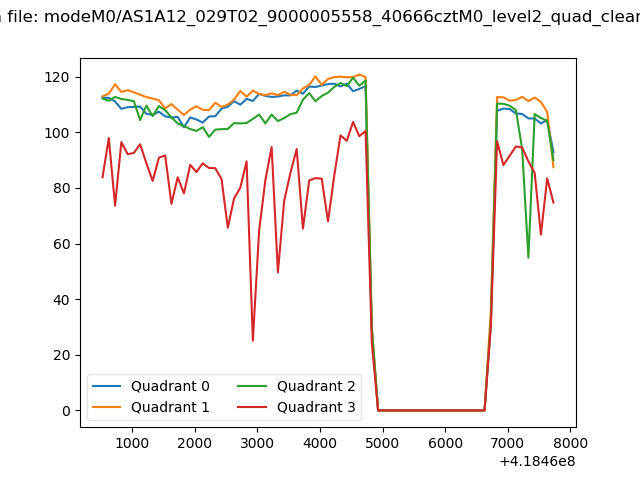 |
|
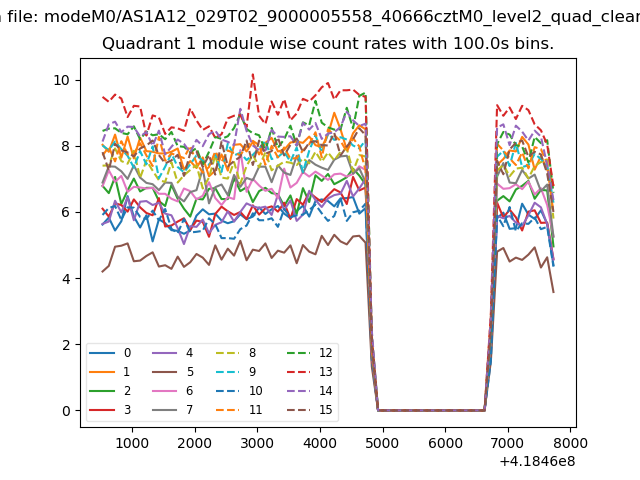
| Module-wise count rates for Quadrant A Data is divided into 100 sec bins |
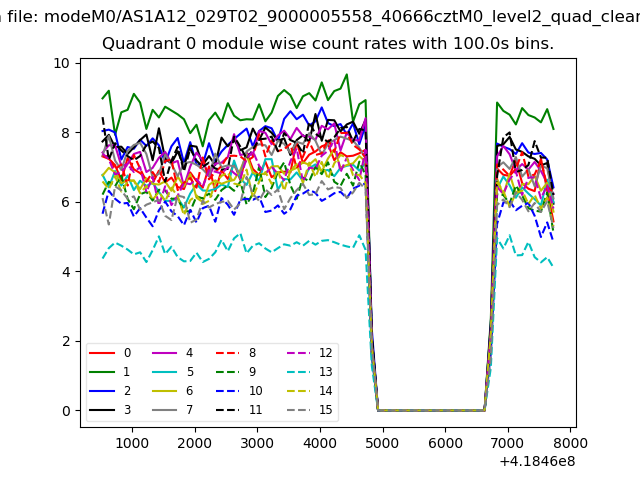 |
 |
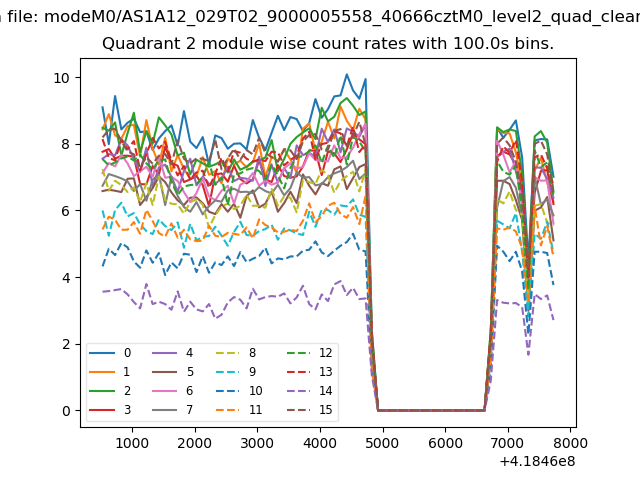
| Module-wise count rates for Quadrant B Data is divided into 100 sec bins |
 |
 |
| Module-wise count rates for Quadrant C Data is divided into 100 sec bins |
 |
 |
| Module-wise count rates for Quadrant D Data is divided into 100 sec bins |
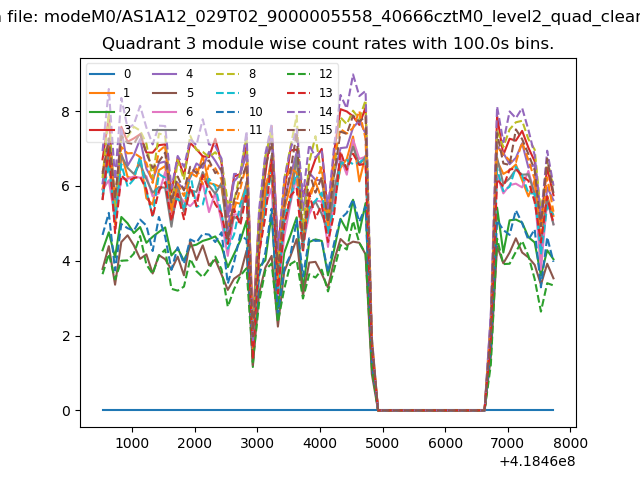 |
 |
| Parameter | Plot |
|---|---|
| CZT HV Monitor | 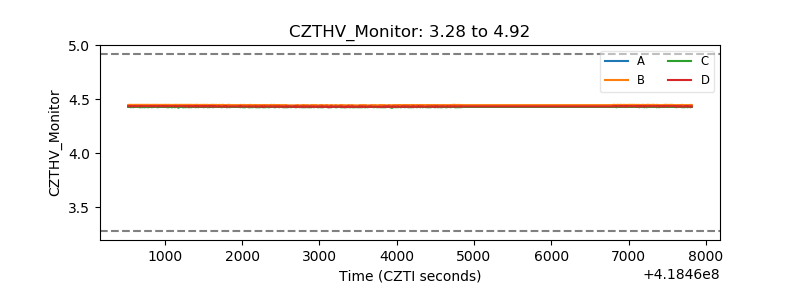 |
| D_VDD | 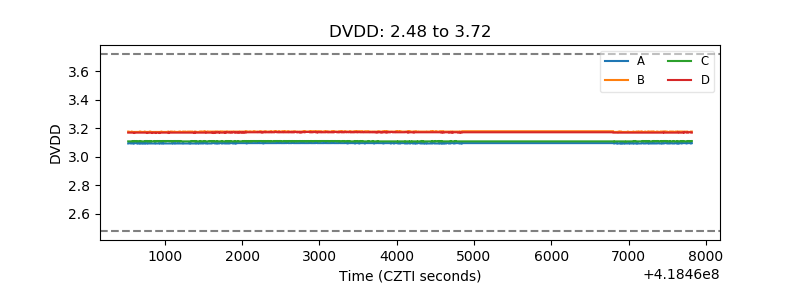 |
| Temperature 1 | 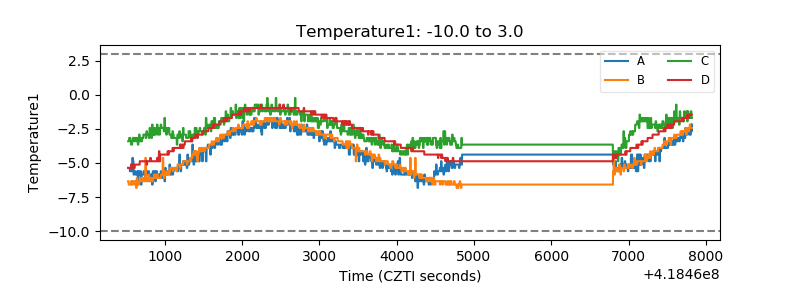 |
| Veto HV Monitor | 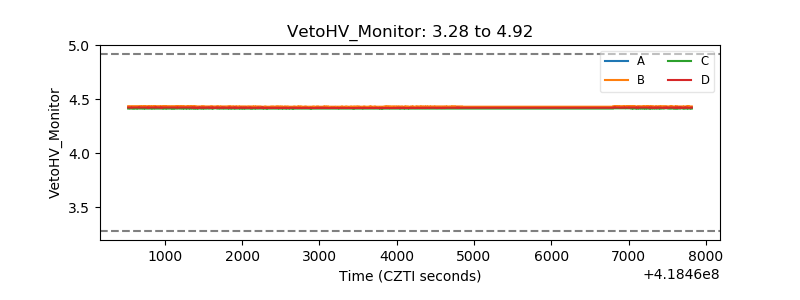 |
| Veto LLD | 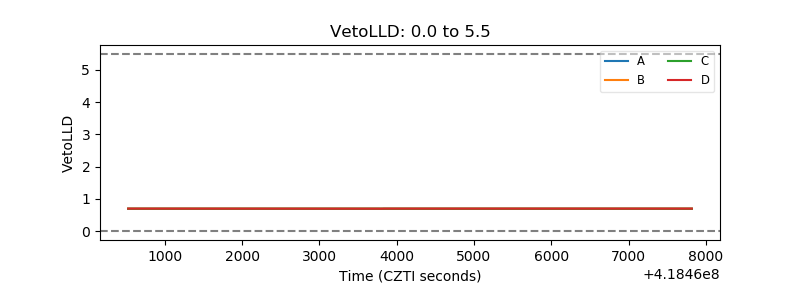 |
| Alpha Counter | 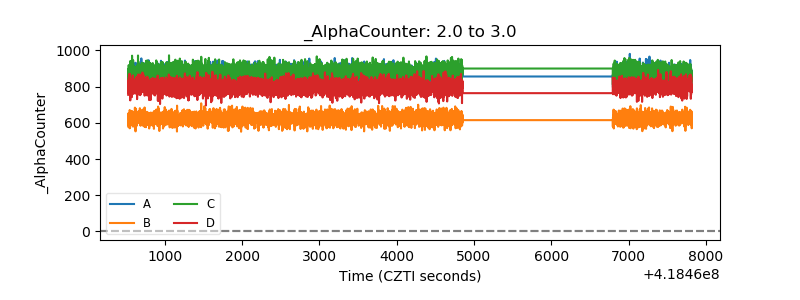 |
| _CPM_Rate | 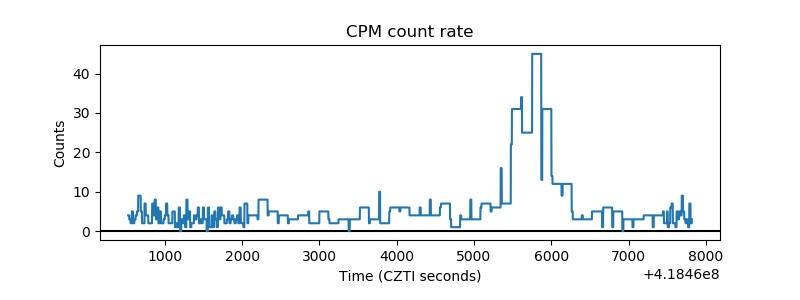 |
| CZT Counter | 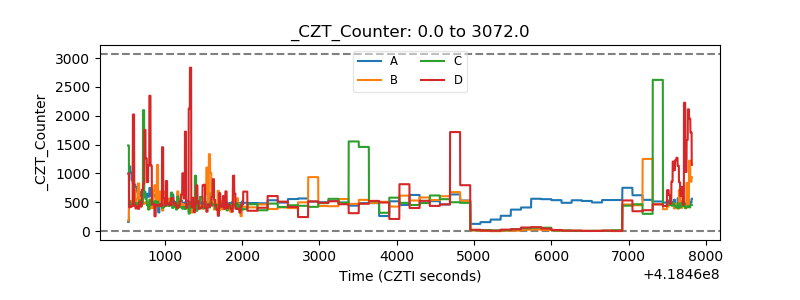 |
| +2.5 Volts monitor |  |
| +5 Volts monitor | 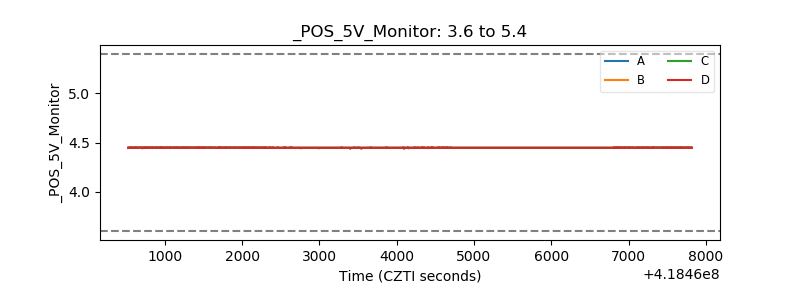 |
| _ROLL_ROT | 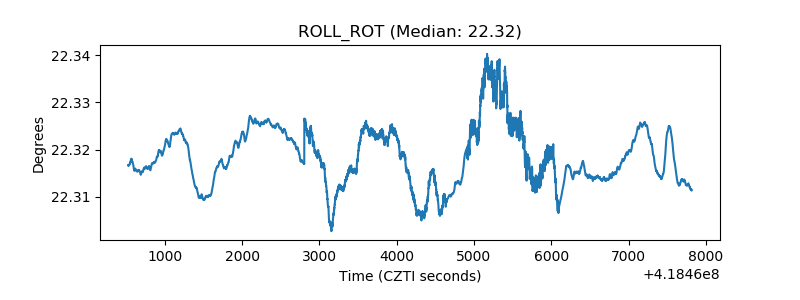 |
| _Roll_DEC | 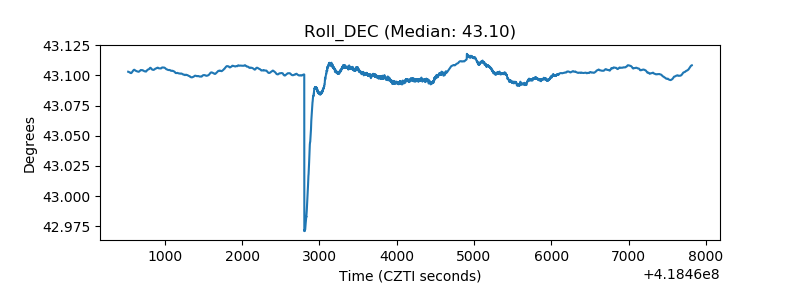 |
| _Roll_RA | 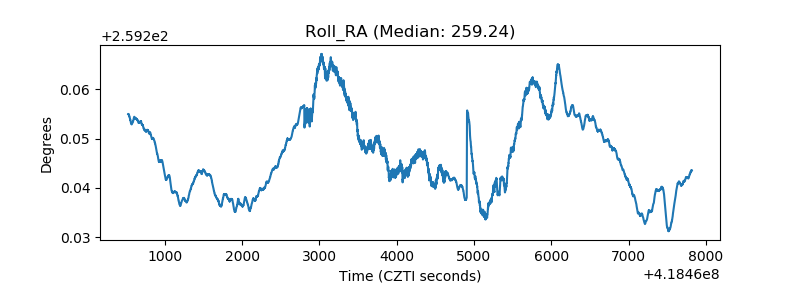 |
| Veto Counter | 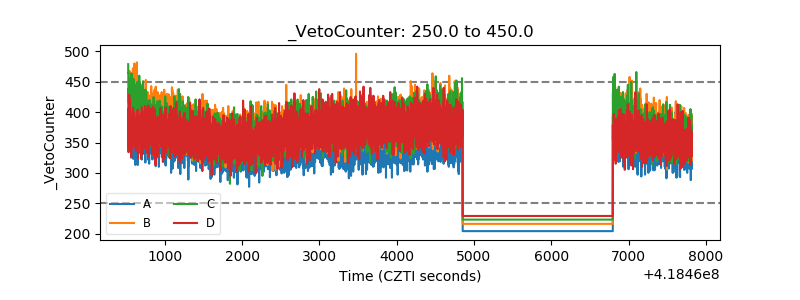 |