| Param | Original file | Final file |
|---|---|---|
| Filename | modeM0/AS1A12_029T02_9000005558_40667cztM0_level2.fits | modeM0/AS1A12_029T02_9000005558_40667cztM0_level2_quad_clean.evt |
| Size (bytes) | 397,584,000 | 84,476,160 |
| Size | 379.2 MB | 80.6 MB |
| Events in quadrant A | 2,914,012 | 591,042 |
| Events in quadrant B | 2,877,041 | 609,959 |
| Events in quadrant C | 4,734,102 | 524,181 |
| Events in quadrant D | 3,767,525 | 450,912 |
| Mode M0 | |||
|---|---|---|---|
| Quadrant | BADHDUFLAG | Total packets | Discarded packets |
| A | 0 | 11822 | 3 |
| B | 0 | 12127 | 2 |
| C | 0 | 17587 | 2 |
| D | 0 | 14898 | 2 |
| Mode M9 | |||
|---|---|---|---|
| Quadrant | BADHDUFLAG | Total packets | Discarded packets |
| A | 0 | 18 | 0 |
| B | 0 | 18 | 0 |
| C | 0 | 18 | 0 |
| D | 0 | 19 | 0 |
| Mode SS | |||
|---|---|---|---|
| Quadrant | BADHDUFLAG | Total packets | Discarded packets |
| A | 0 | 112 | 0 |
| B | 0 | 112 | 0 |
| C | 0 | 112 | 0 |
| D | 0 | 112 | 0 |
| Quadrant | Total seconds | Saturated seconds | Saturation percentage |
|---|---|---|---|
| A | 5448 | 18 | 0.330396% |
| B | 5448 | 52 | 0.954479% |
| C | 5448 | 620 | 11.380323% |
| D | 5448 | 1001 | 18.373715% |
Noise dominated data is calculated using 1-second bins in cleaned event files. If a bin has >2000 counts, and if more than 50% of those come from <1% of pixels, then it is considered to be noise-dominated and hence unusable.
| Quadrant | # 1 sec bins | Bins with >0 counts | Bins with >2000 counts | High rate bins dominated by noise | Noise dominated (total time) | Noise dominated (detector-on time) | Marked lightcurve |
|---|---|---|---|---|---|---|---|
| A | 7061 | 5449 | 5 | 5 | 0.07% | 0.09% | 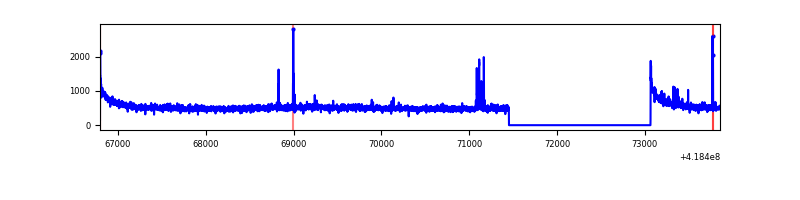 |
| B | 7061 | 5449 | 25 | 25 | 0.35% | 0.46% | 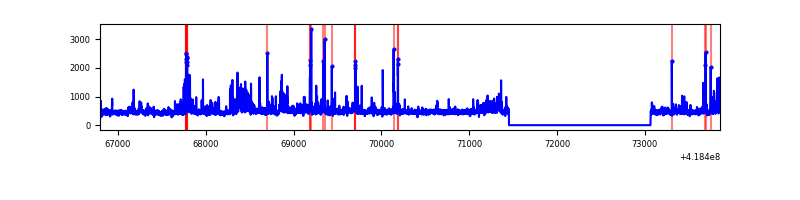 |
| C | 7061 | 5449 | 604 | 604 | 8.55% | 11.08% | 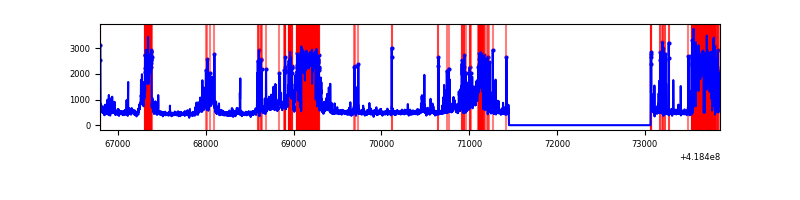 |
| D | 7061 | 5449 | 167 | 167 | 2.37% | 3.06% | 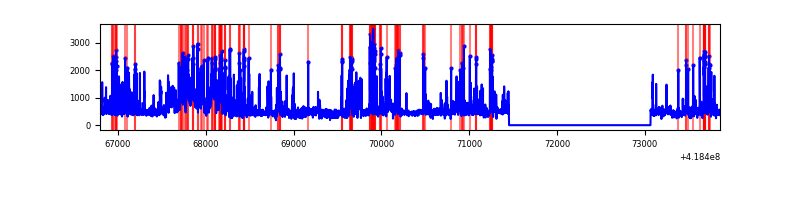 |
Top three noisy pixels from each quadrant. If the there are fewer than three noisy pixels in the level2.evt file, extra rows are filled as -1
| Pixel properties | Quadrant properties | ||||||
|---|---|---|---|---|---|---|---|
| Quadrant | DetID | PixID | Counts | Sigma | Mean | Median | Sigma |
| A | 10 | 83 | 501656 | 4027.98 | 600 | 588 | 124.4 |
| A | 13 | 248 | 38866 | 307.71 | 600 | 588 | 124.4 |
| A | 12 | 189 | 24483 | 192.09 | 600 | 588 | 124.4 |
| B | 0 | 229 | 236902 | 2046.5 | 596 | 580 | 115.5 |
| B | 0 | 190 | 123677 | 1066.0 | 596 | 580 | 115.5 |
| B | 5 | 255 | 68300 | 586.44 | 596 | 580 | 115.5 |
| C | 9 | 187 | 1208321 | 9347.69 | 555 | 559 | 129.2 |
| C | 14 | 254 | 1070643 | 8282.1 | 555 | 559 | 129.2 |
| C | 15 | 214 | 229519 | 1772.08 | 555 | 559 | 129.2 |
| D | 12 | 227 | 851353 | 6380.46 | 531 | 515 | 133.4 |
| D | 2 | 250 | 330498 | 2474.55 | 531 | 515 | 133.4 |
| D | 12 | 191 | 195726 | 1463.89 | 531 | 515 | 133.4 |
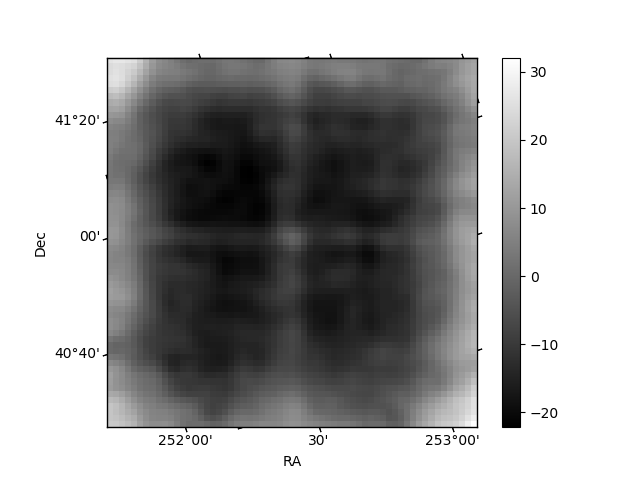
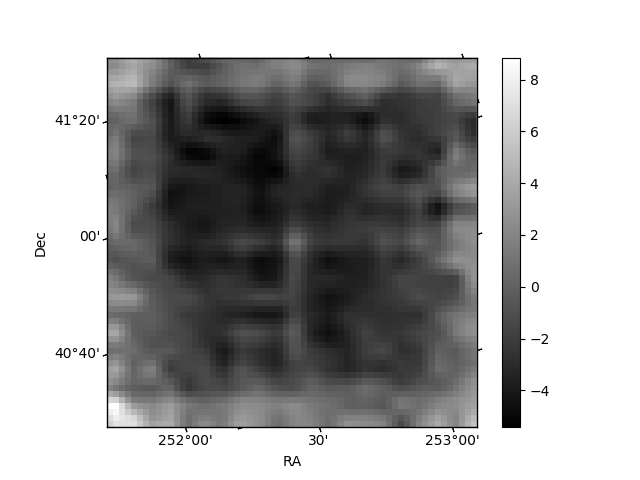
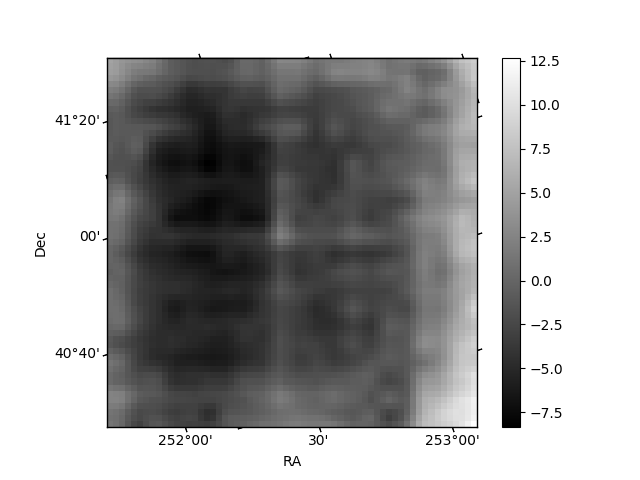
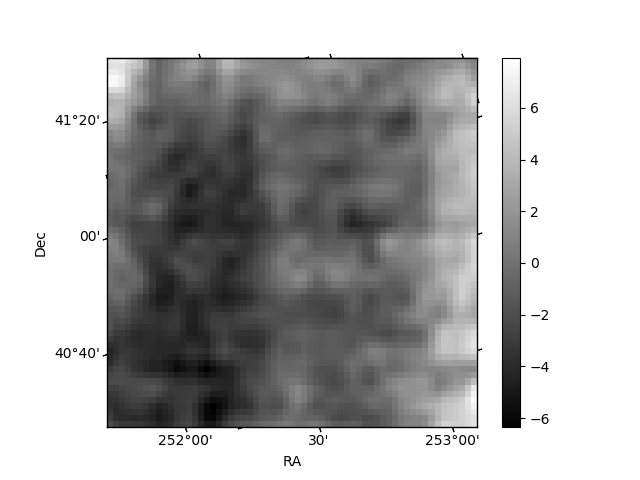
Histogram calculated using DETX and DETY for each event in the final _common_clean file
| Quadrant A | 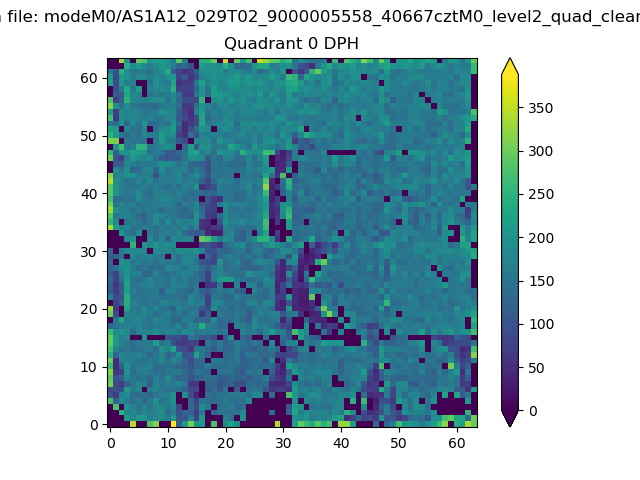 |
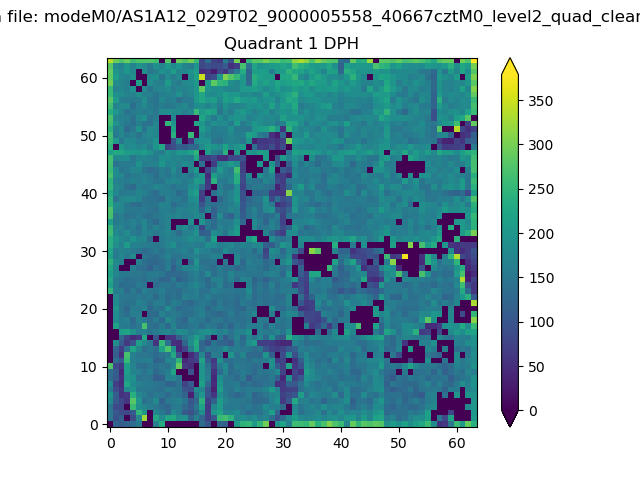 |
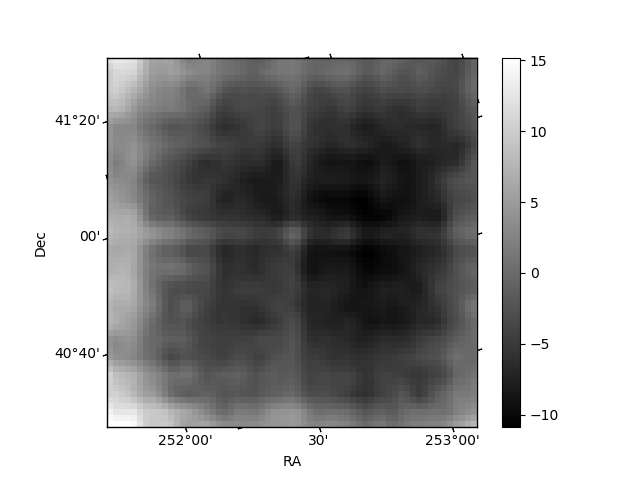
Quadrant B |
|---|---|---|---|
| Quadrant D | 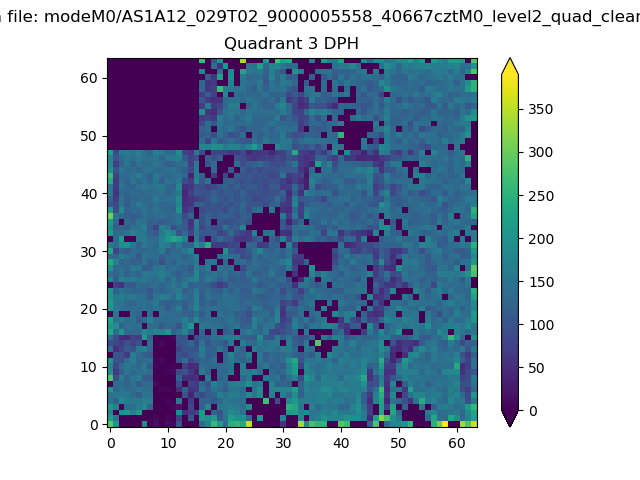 |
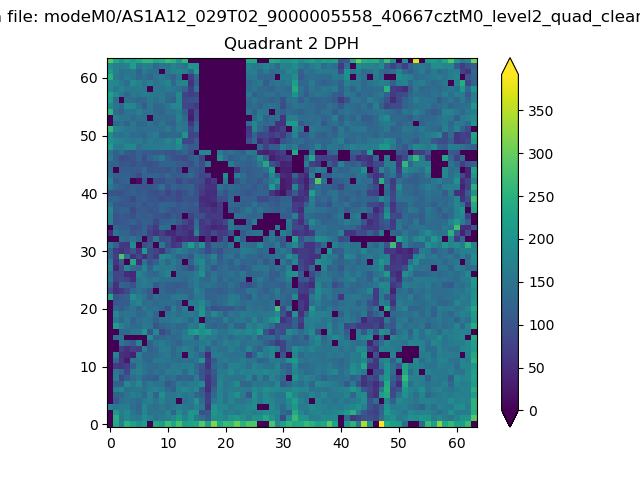 |
Quadrant C |
| Plot type | Count rate plots | Images |
|---|---|---|
| Comparison with Poisson distribution Blue bars denote a histogram of data divided into 1 sec bins. Red curve is a Poisson curve with rate = median count rate of data. |
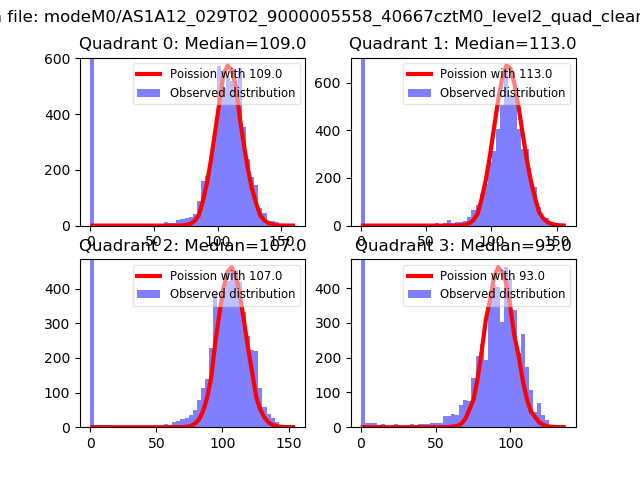 |
 |
| Quadrant-wise count rates Data is divided into 100 sec bins |
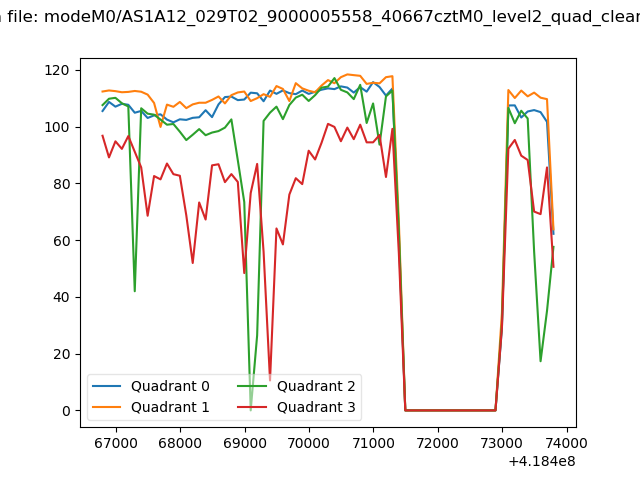 |
|
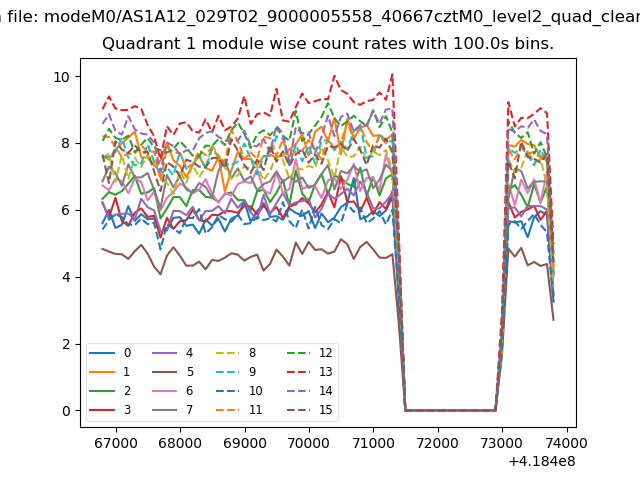
| Module-wise count rates for Quadrant A Data is divided into 100 sec bins |
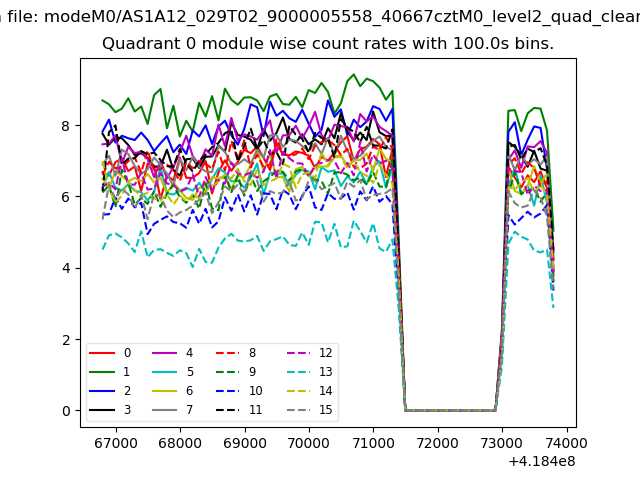 |
 |
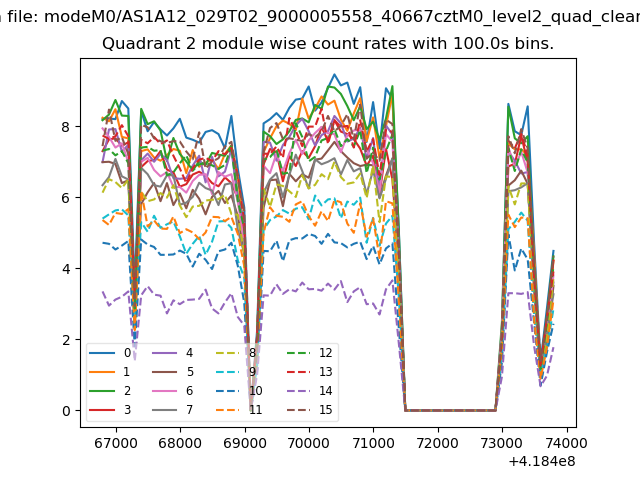
| Module-wise count rates for Quadrant B Data is divided into 100 sec bins |
 |
 |
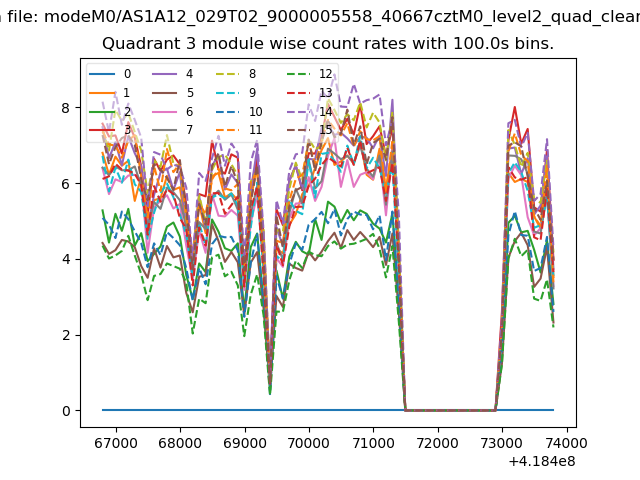
| Module-wise count rates for Quadrant C Data is divided into 100 sec bins |
 |
 |
| Module-wise count rates for Quadrant D Data is divided into 100 sec bins |
 |
 |
| Parameter | Plot |
|---|---|
| CZT HV Monitor | 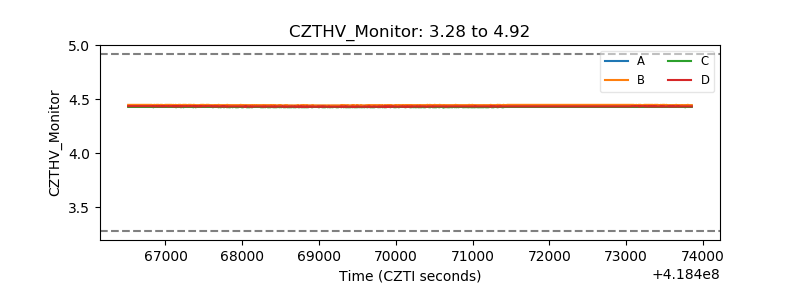 |
| D_VDD | 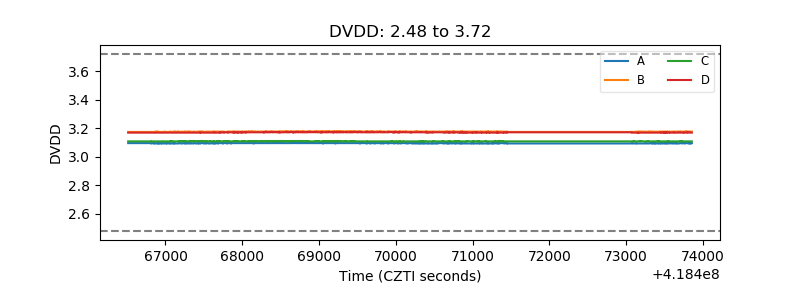 |
| Temperature 1 | 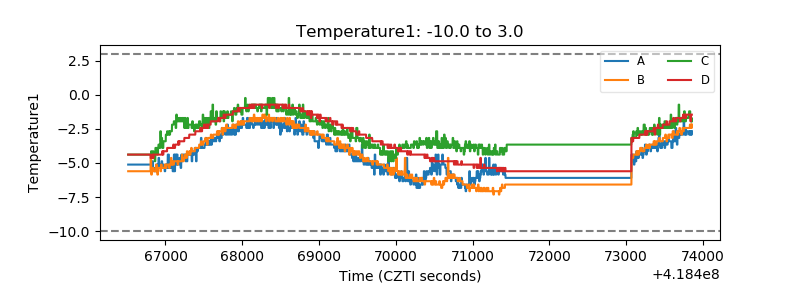 |
| Veto HV Monitor | 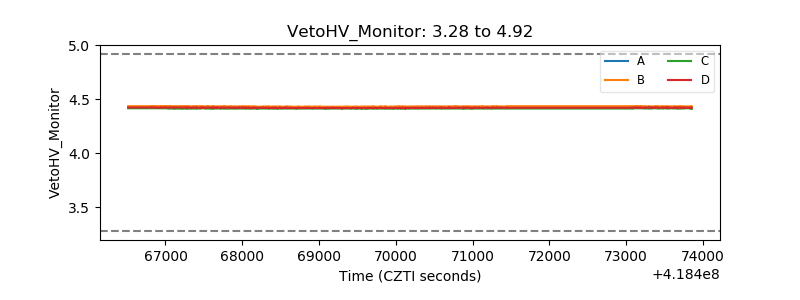 |
| Veto LLD | 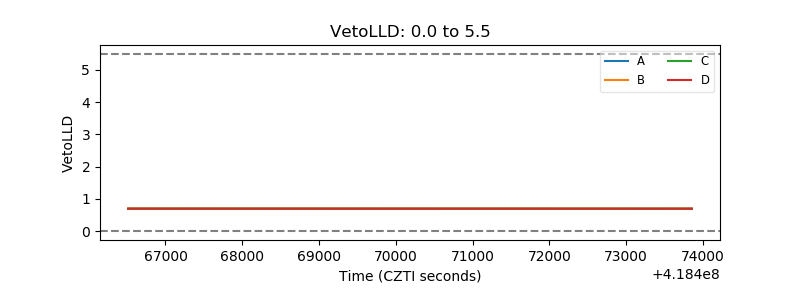 |
| Alpha Counter | 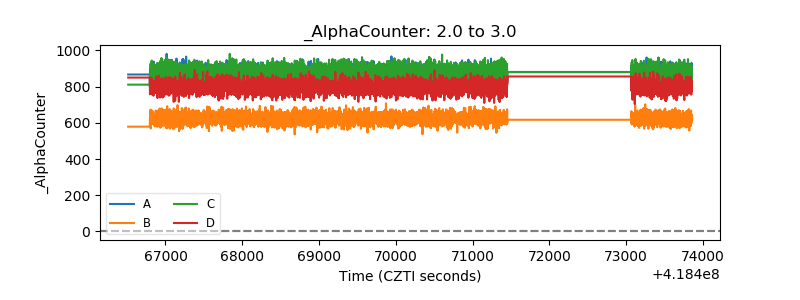 |
| _CPM_Rate | 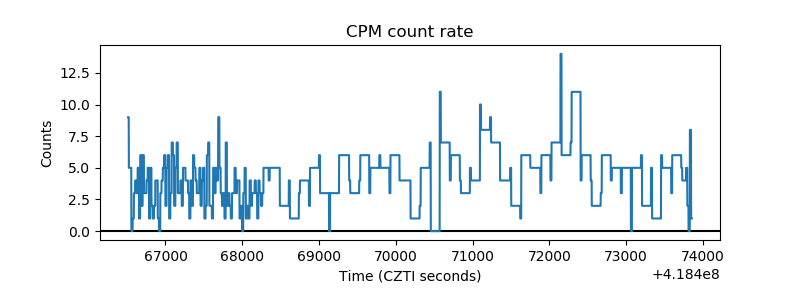 |
| CZT Counter | 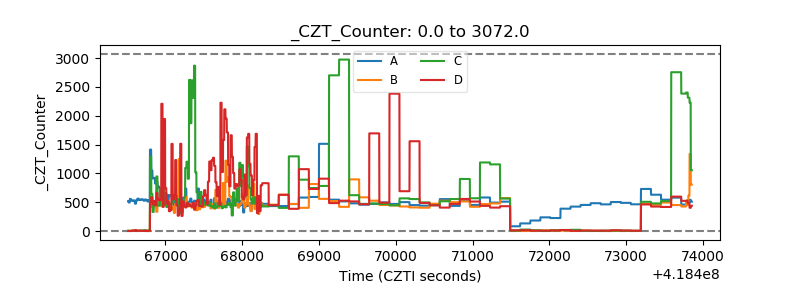 |
| +2.5 Volts monitor | 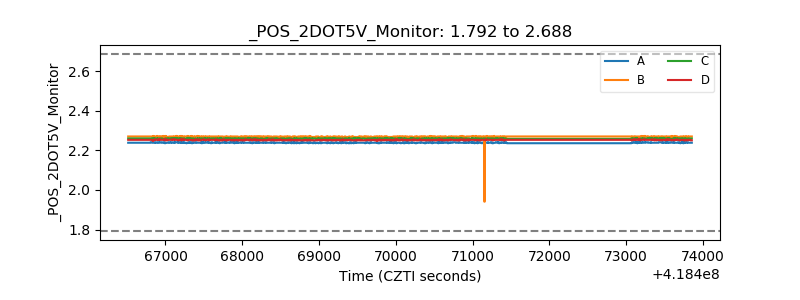 |
| +5 Volts monitor | 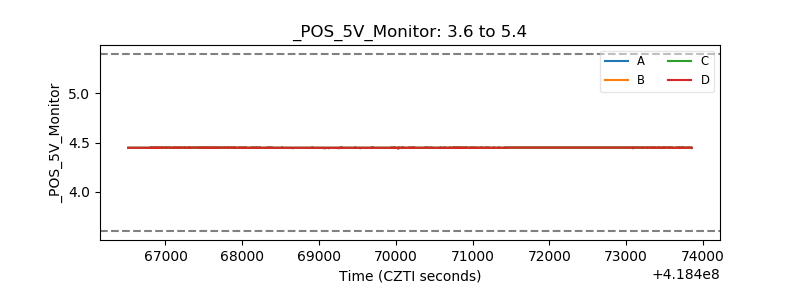 |
| _ROLL_ROT | 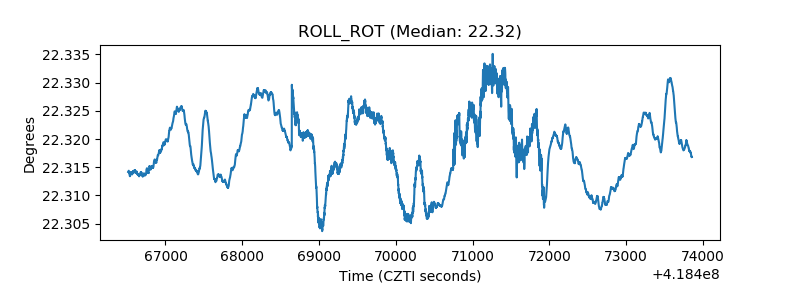 |
| _Roll_DEC | 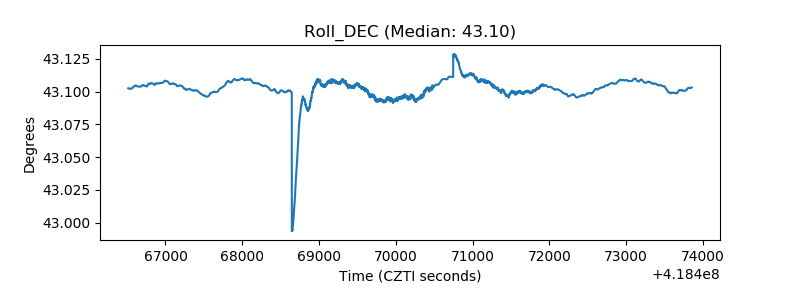 |
| _Roll_RA | 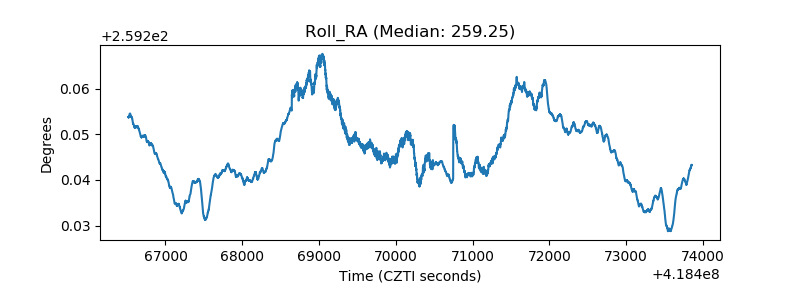 |
| Veto Counter | 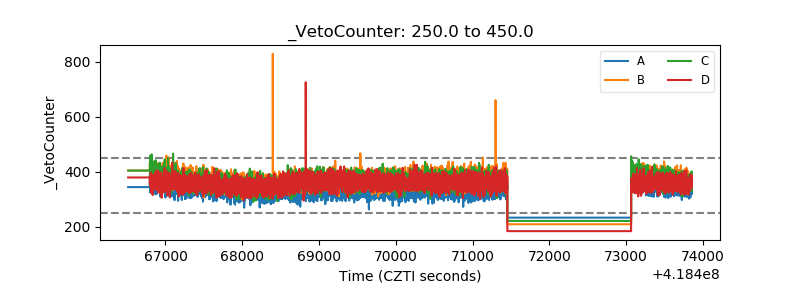 |