| Param | Original file | Final file |
|---|---|---|
| Filename | modeM0/AS1A12_029T02_9000005558_40668cztM0_level2.fits | modeM0/AS1A12_029T02_9000005558_40668cztM0_level2_quad_clean.evt |
| Size (bytes) | 459,371,520 | 89,043,840 |
| Size | 438.1 MB | 84.9 MB |
| Events in quadrant A | 3,323,933 | 646,360 |
| Events in quadrant B | 3,420,194 | 651,005 |
| Events in quadrant C | 5,779,935 | 563,852 |
| Events in quadrant D | 4,016,713 | 418,926 |
| Mode M0 | |||
|---|---|---|---|
| Quadrant | BADHDUFLAG | Total packets | Discarded packets |
| A | 0 | 13410 | 3 |
| B | 0 | 14014 | 2 |
| C | 0 | 21201 | 2 |
| D | 0 | 16280 | 2 |
| Mode M9 | |||
|---|---|---|---|
| Quadrant | BADHDUFLAG | Total packets | Discarded packets |
| A | 0 | 21 | 0 |
| B | 0 | 21 | 0 |
| C | 0 | 21 | 0 |
| D | 0 | 22 | 0 |
| Mode SS | |||
|---|---|---|---|
| Quadrant | BADHDUFLAG | Total packets | Discarded packets |
| A | 0 | 122 | 0 |
| B | 0 | 122 | 0 |
| C | 0 | 122 | 0 |
| D | 0 | 122 | 0 |
| Quadrant | Total seconds | Saturated seconds | Saturation percentage |
|---|---|---|---|
| A | 5947 | 19 | 0.319489% |
| B | 5947 | 154 | 2.589541% |
| C | 5947 | 740 | 12.443249% |
| D | 5947 | 1770 | 29.762906% |
Noise dominated data is calculated using 1-second bins in cleaned event files. If a bin has >2000 counts, and if more than 50% of those come from <1% of pixels, then it is considered to be noise-dominated and hence unusable.
| Quadrant | # 1 sec bins | Bins with >0 counts | Bins with >2000 counts | High rate bins dominated by noise | Noise dominated (total time) | Noise dominated (detector-on time) | Marked lightcurve |
|---|---|---|---|---|---|---|---|
| A | 7290 | 5948 | 4 | 4 | 0.05% | 0.07% | 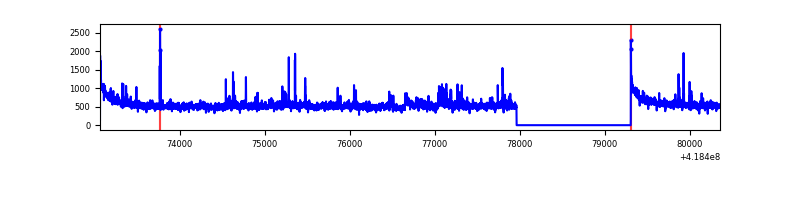 |
| B | 7290 | 5948 | 98 | 98 | 1.34% | 1.65% | 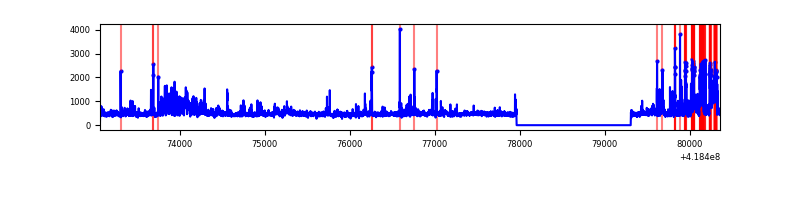 |
| C | 7290 | 5948 | 731 | 731 | 10.03% | 12.29% | 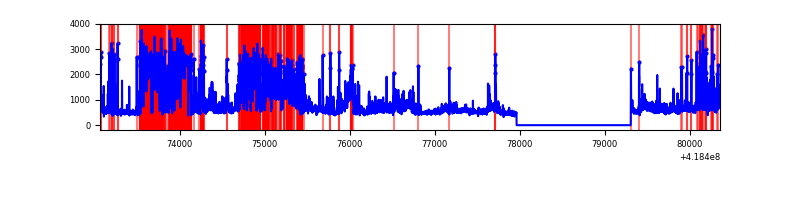 |
| D | 7289 | 5947 | 283 | 283 | 3.88% | 4.76% | 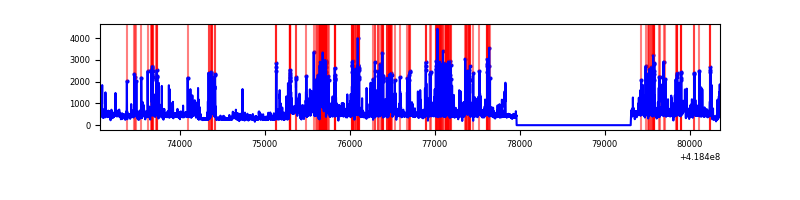 |
Top three noisy pixels from each quadrant. If the there are fewer than three noisy pixels in the level2.evt file, extra rows are filled as -1
| Pixel properties | Quadrant properties | ||||||
|---|---|---|---|---|---|---|---|
| Quadrant | DetID | PixID | Counts | Sigma | Mean | Median | Sigma |
| A | 10 | 83 | 531369 | 3891.58 | 658 | 644 | 136.4 |
| A | 12 | 189 | 197613 | 1444.29 | 658 | 644 | 136.4 |
| A | 2 | 79 | 25073 | 179.13 | 658 | 644 | 136.4 |
| B | 0 | 229 | 431654 | 3427.92 | 646 | 628 | 125.7 |
| B | 4 | 171 | 172216 | 1364.63 | 646 | 628 | 125.7 |
| B | 5 | 255 | 95722 | 756.28 | 646 | 628 | 125.7 |
| C | 9 | 187 | 3057465 | 21536.91 | 604 | 606 | 141.9 |
| C | 15 | 214 | 248046 | 1743.32 | 604 | 606 | 141.9 |
| C | 14 | 254 | 47691 | 331.73 | 604 | 606 | 141.9 |
| D | 12 | 227 | 1168409 | 9096.85 | 507 | 491 | 128.4 |
| D | 12 | 191 | 310258 | 2412.76 | 507 | 491 | 128.4 |
| D | 2 | 250 | 253481 | 1970.52 | 507 | 491 | 128.4 |
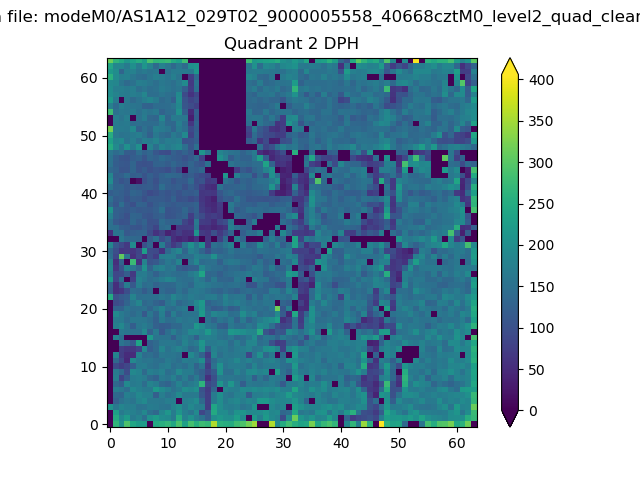
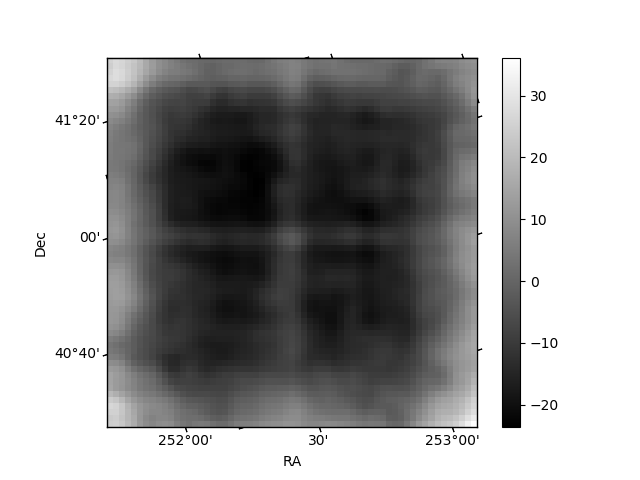
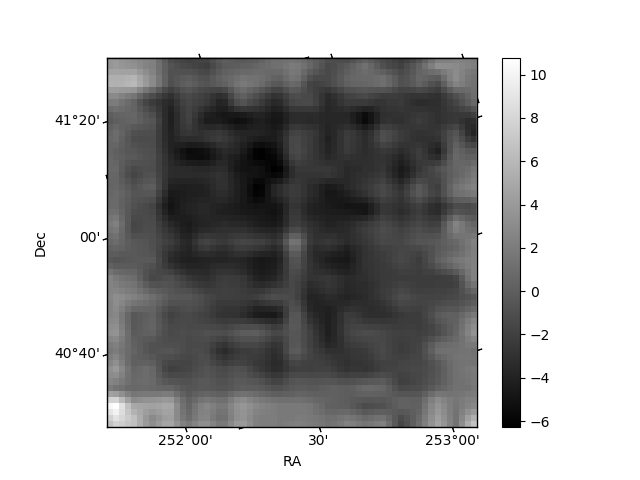
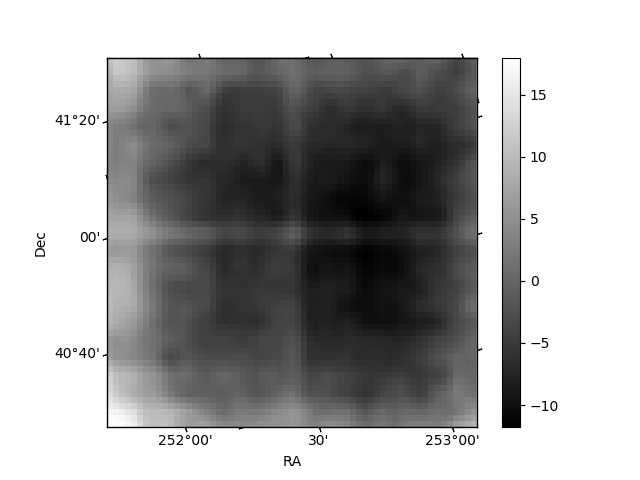
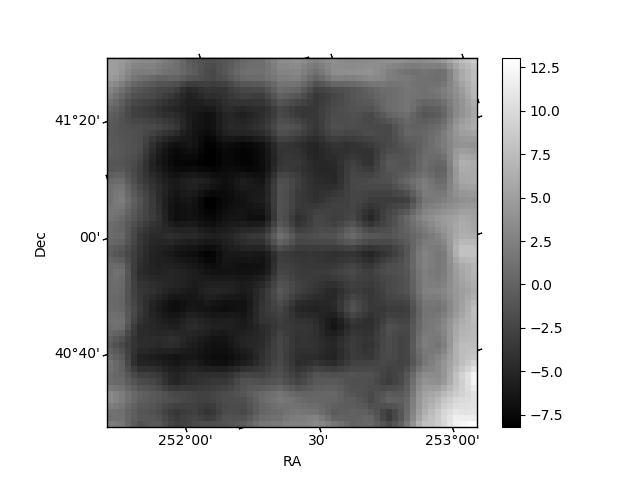
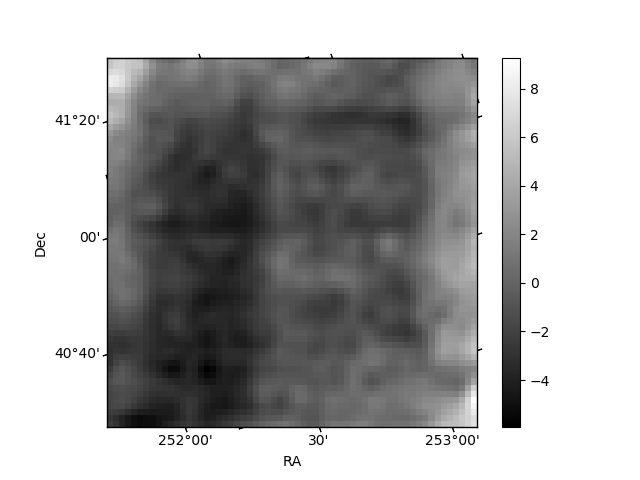
Histogram calculated using DETX and DETY for each event in the final _common_clean file
| Quadrant A | 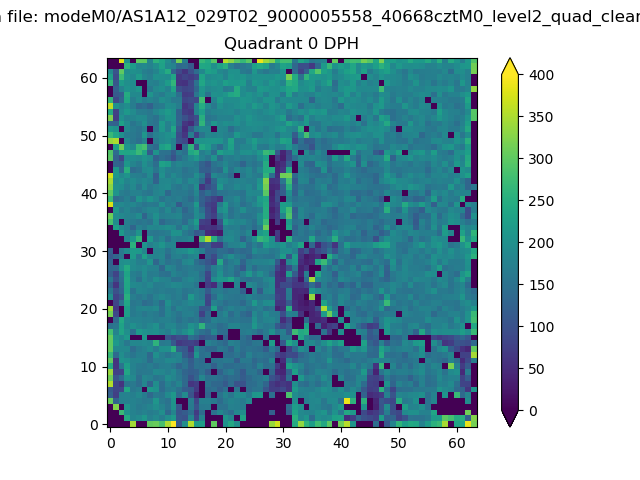 |
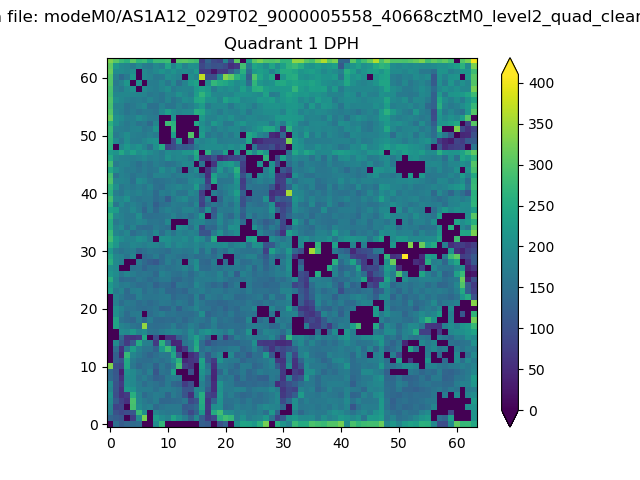 |
Quadrant B |
|---|---|---|---|
| Quadrant D | 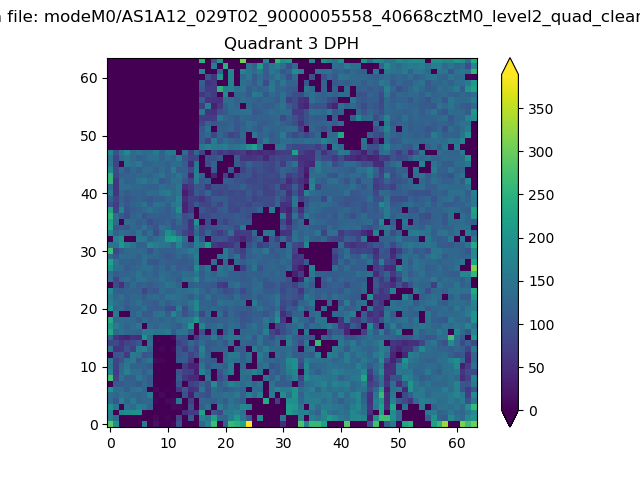 |
 |
Quadrant C |
| Plot type | Count rate plots | Images |
|---|---|---|
| Comparison with Poisson distribution Blue bars denote a histogram of data divided into 1 sec bins. Red curve is a Poisson curve with rate = median count rate of data. |
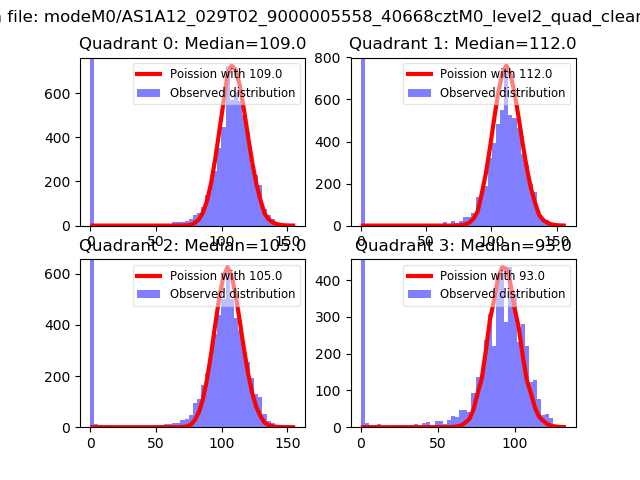 |
 |
| Quadrant-wise count rates Data is divided into 100 sec bins |
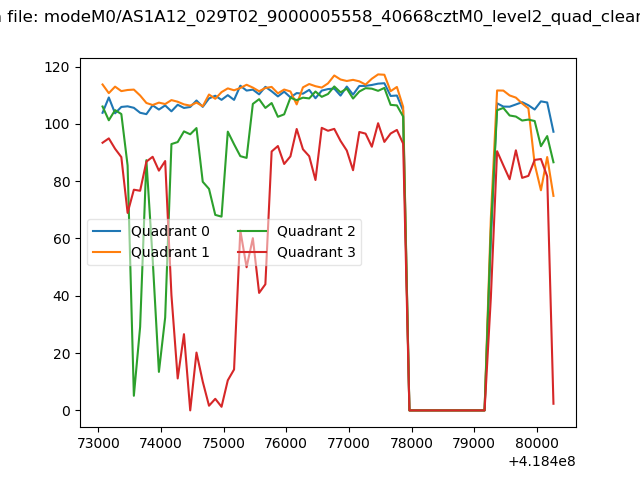 |
|
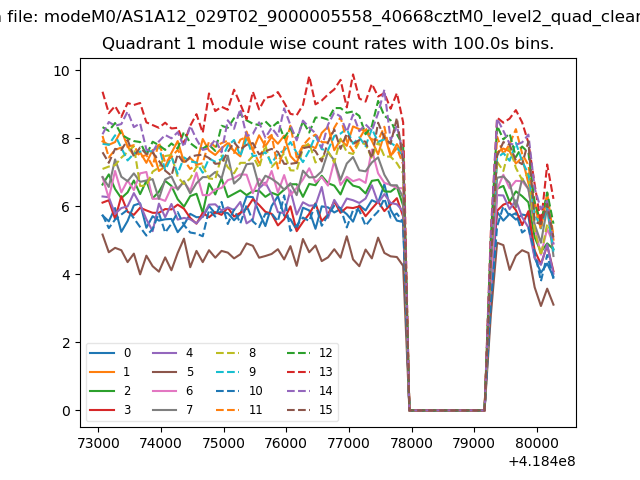
| Module-wise count rates for Quadrant A Data is divided into 100 sec bins |
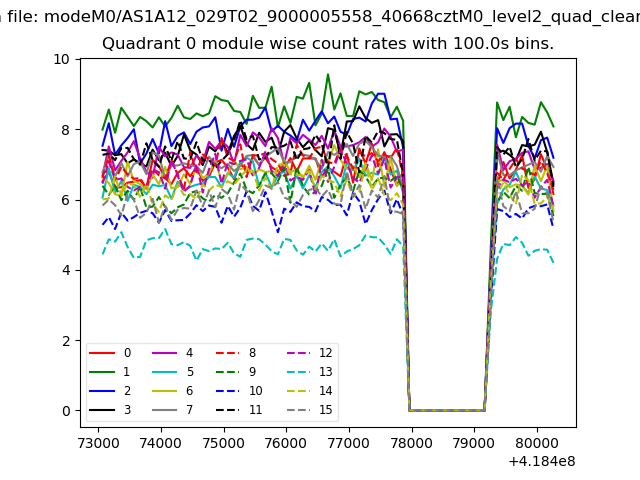 |
 |
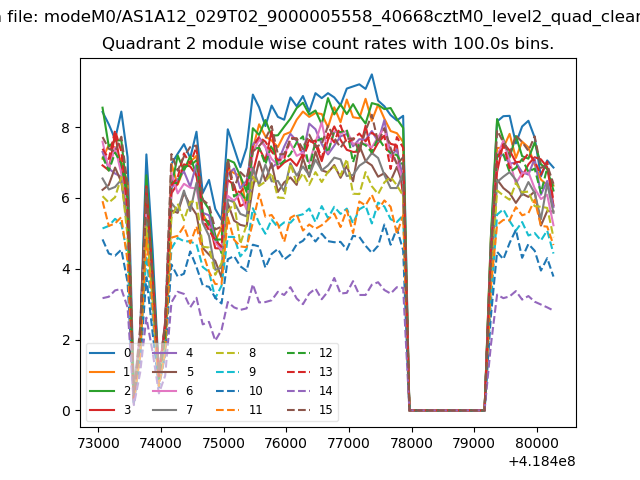
| Module-wise count rates for Quadrant B Data is divided into 100 sec bins |
 |
 |
| Module-wise count rates for Quadrant C Data is divided into 100 sec bins |
 |
 |
| Module-wise count rates for Quadrant D Data is divided into 100 sec bins |
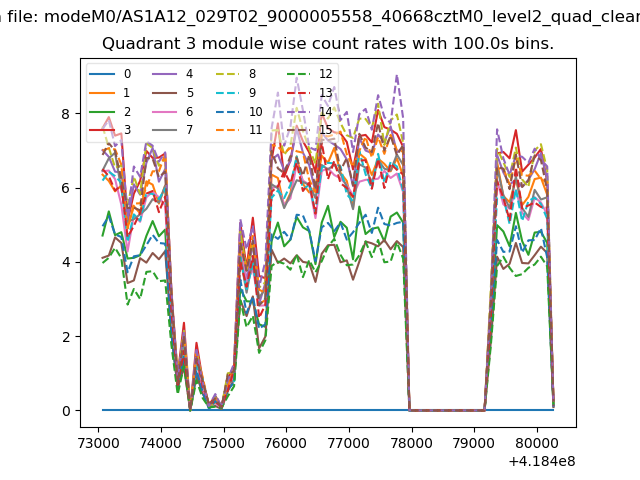 |
 |
| Parameter | Plot |
|---|---|
| CZT HV Monitor | 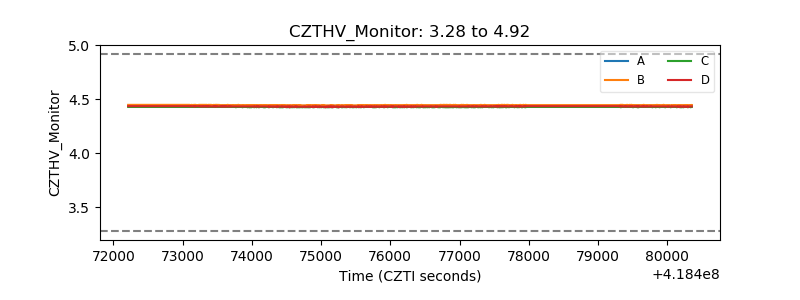 |
| D_VDD | 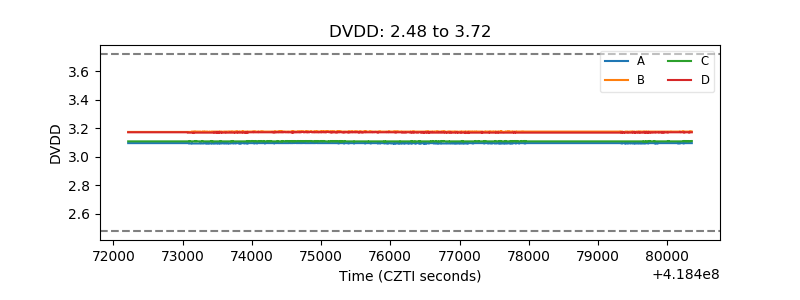 |
| Temperature 1 | 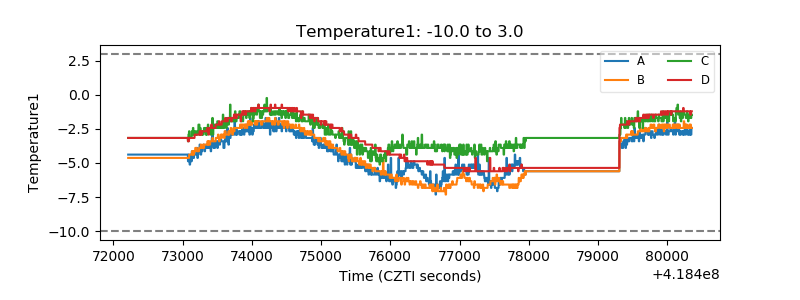 |
| Veto HV Monitor | 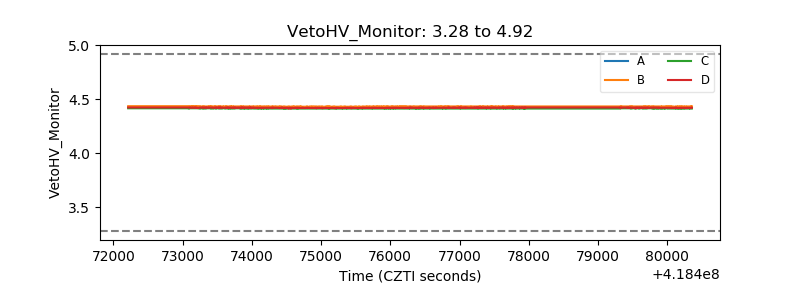 |
| Veto LLD | 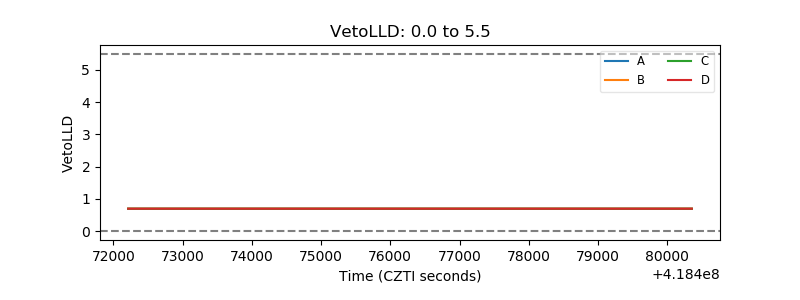 |
| Alpha Counter | 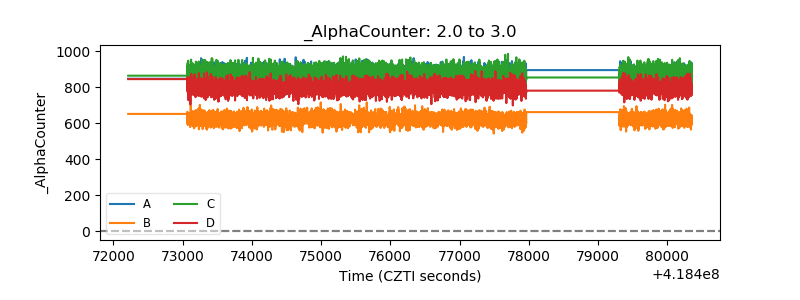 |
| _CPM_Rate | 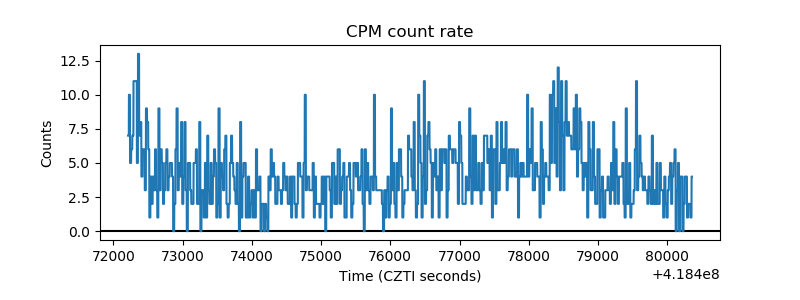 |
| CZT Counter | 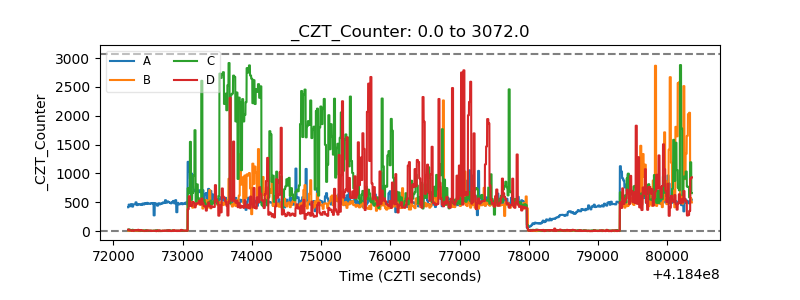 |
| +2.5 Volts monitor | 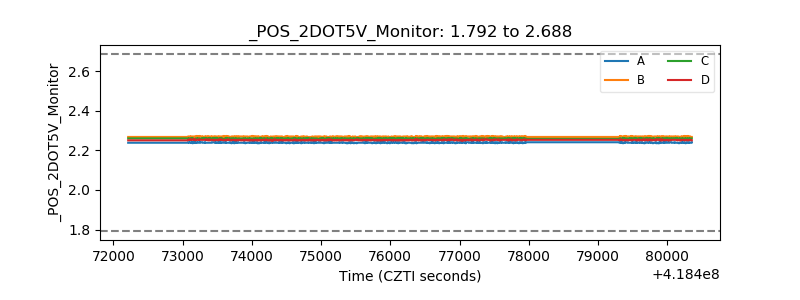 |
| +5 Volts monitor | 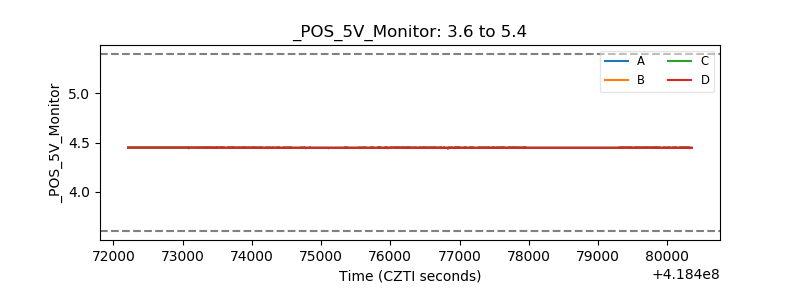 |
| _ROLL_ROT | 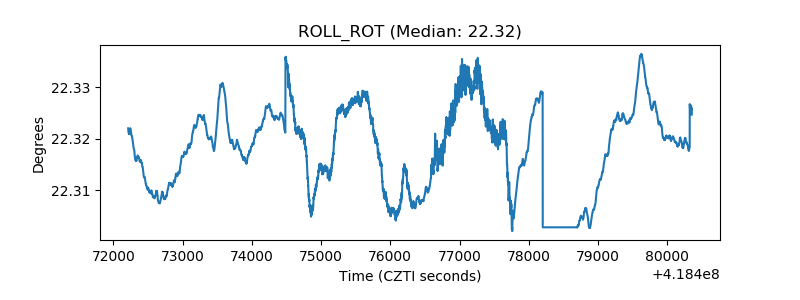 |
| _Roll_DEC | 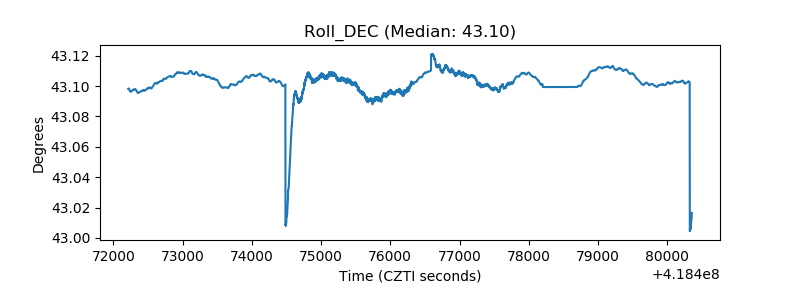 |
| _Roll_RA | 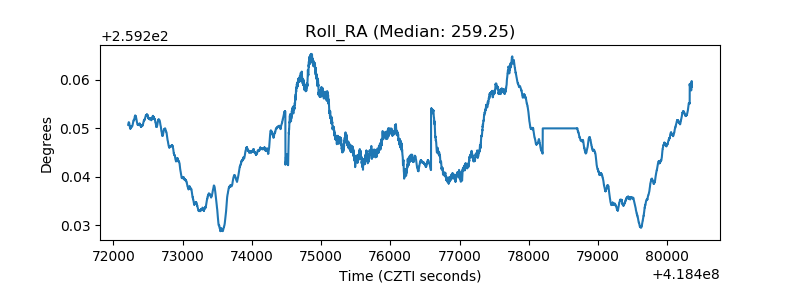 |
| Veto Counter | 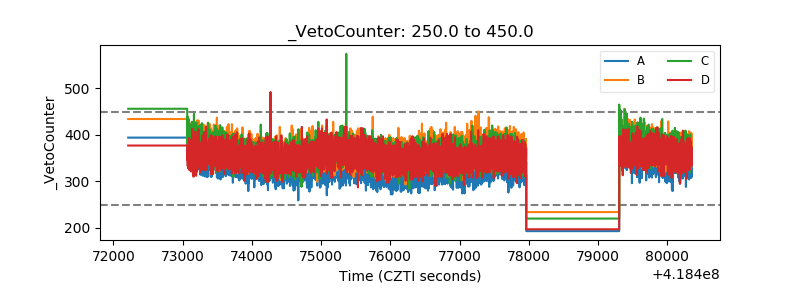 |