| Param | Original file | Final file |
|---|---|---|
| Filename | modeM0/AS1A12_029T02_9000005558_40669cztM0_level2.fits | modeM0/AS1A12_029T02_9000005558_40669cztM0_level2_quad_clean.evt |
| Size (bytes) | 470,508,480 | 90,334,080 |
| Size | 448.7 MB | 86.1 MB |
| Events in quadrant A | 3,214,111 | 652,792 |
| Events in quadrant B | 3,567,556 | 652,403 |
| Events in quadrant C | 6,146,620 | 575,685 |
| Events in quadrant D | 4,019,515 | 433,673 |
| Mode M0 | |||
|---|---|---|---|
| Quadrant | BADHDUFLAG | Total packets | Discarded packets |
| A | 0 | 13112 | 3 |
| B | 0 | 14662 | 2 |
| C | 0 | 22448 | 2 |
| D | 0 | 16336 | 2 |
| Mode M9 | |||
|---|---|---|---|
| Quadrant | BADHDUFLAG | Total packets | Discarded packets |
| A | 0 | 18 | 0 |
| B | 0 | 18 | 0 |
| C | 0 | 18 | 0 |
| D | 0 | 19 | 0 |
| Mode SS | |||
|---|---|---|---|
| Quadrant | BADHDUFLAG | Total packets | Discarded packets |
| A | 0 | 122 | 0 |
| B | 0 | 122 | 0 |
| C | 0 | 122 | 0 |
| D | 0 | 122 | 0 |
| Quadrant | Total seconds | Saturated seconds | Saturation percentage |
|---|---|---|---|
| A | 6020 | 15 | 0.249169% |
| B | 6020 | 219 | 3.637874% |
| C | 6020 | 601 | 9.983389% |
| D | 6020 | 1674 | 27.807309% |
Noise dominated data is calculated using 1-second bins in cleaned event files. If a bin has >2000 counts, and if more than 50% of those come from <1% of pixels, then it is considered to be noise-dominated and hence unusable.
| Quadrant | # 1 sec bins | Bins with >0 counts | Bins with >2000 counts | High rate bins dominated by noise | Noise dominated (total time) | Noise dominated (detector-on time) | Marked lightcurve |
|---|---|---|---|---|---|---|---|
| A | 7304 | 6021 | 4 | 4 | 0.05% | 0.07% | 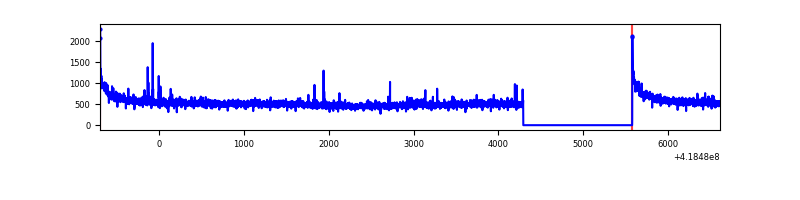 |
| B | 7304 | 6021 | 150 | 150 | 2.05% | 2.49% | 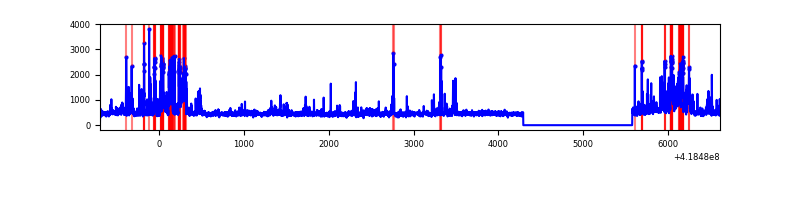 |
| C | 7304 | 6021 | 590 | 590 | 8.08% | 9.80% | 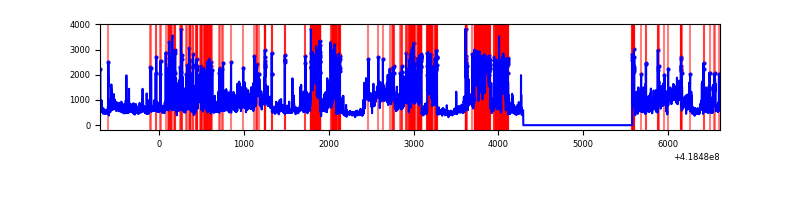 |
| D | 7304 | 6021 | 330 | 330 | 4.52% | 5.48% | 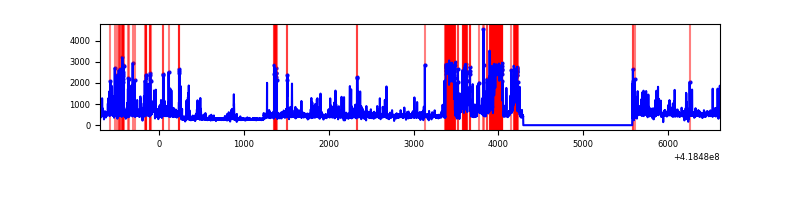 |
Top three noisy pixels from each quadrant. If the there are fewer than three noisy pixels in the level2.evt file, extra rows are filled as -1
| Pixel properties | Quadrant properties | ||||||
|---|---|---|---|---|---|---|---|
| Quadrant | DetID | PixID | Counts | Sigma | Mean | Median | Sigma |
| A | 10 | 83 | 535599 | 3864.44 | 669 | 655 | 138.4 |
| A | 12 | 189 | 45622 | 324.84 | 669 | 655 | 138.4 |
| A | 2 | 79 | 15783 | 109.28 | 669 | 655 | 138.4 |
| B | 0 | 229 | 519196 | 4062.12 | 653 | 634 | 127.7 |
| B | 5 | 255 | 316765 | 2476.39 | 653 | 634 | 127.7 |
| B | 0 | 230 | 51206 | 396.15 | 653 | 634 | 127.7 |
| C | 9 | 187 | 3286881 | 22412.71 | 621 | 621 | 146.6 |
| C | 15 | 214 | 251372 | 1710.15 | 621 | 621 | 146.6 |
| C | 14 | 254 | 121051 | 821.35 | 621 | 621 | 146.6 |
| D | 12 | 128 | 939399 | 7179.21 | 522 | 507 | 130.8 |
| D | 12 | 227 | 329789 | 2517.85 | 522 | 507 | 130.8 |
| D | 12 | 191 | 299093 | 2283.13 | 522 | 507 | 130.8 |
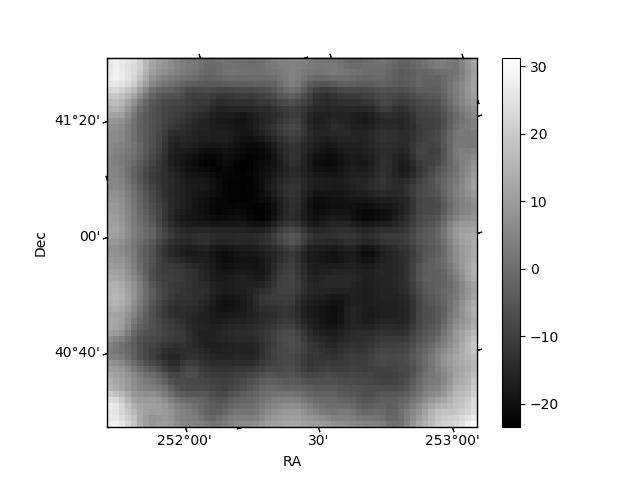
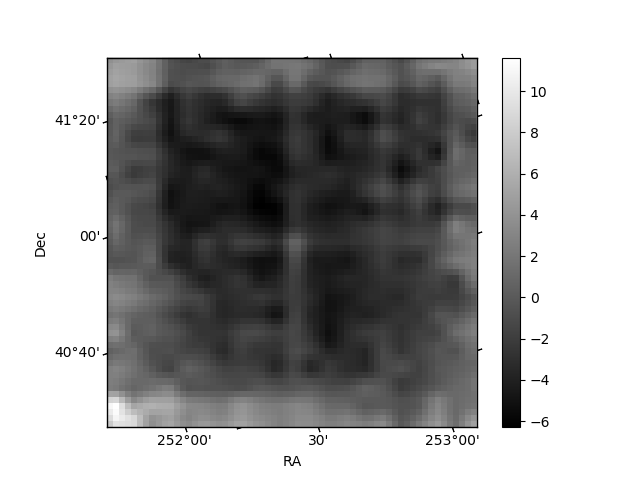
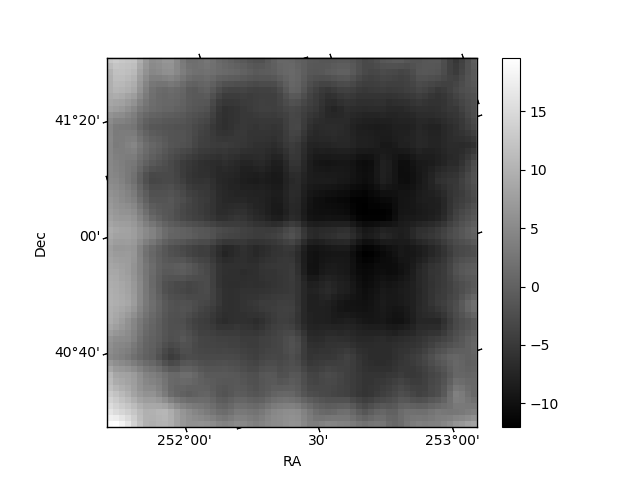
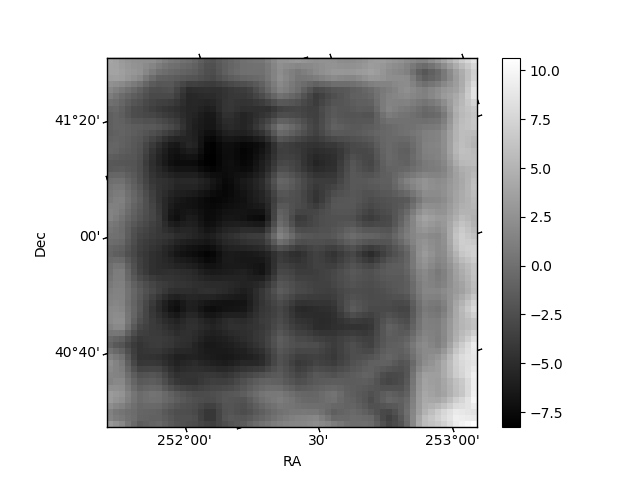
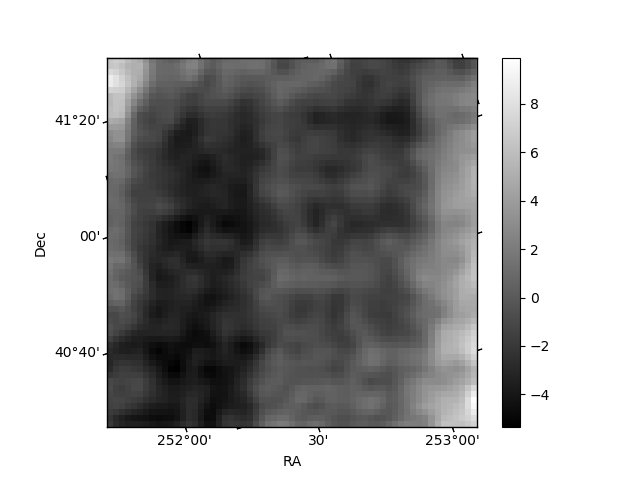
Histogram calculated using DETX and DETY for each event in the final _common_clean file
| Quadrant A | 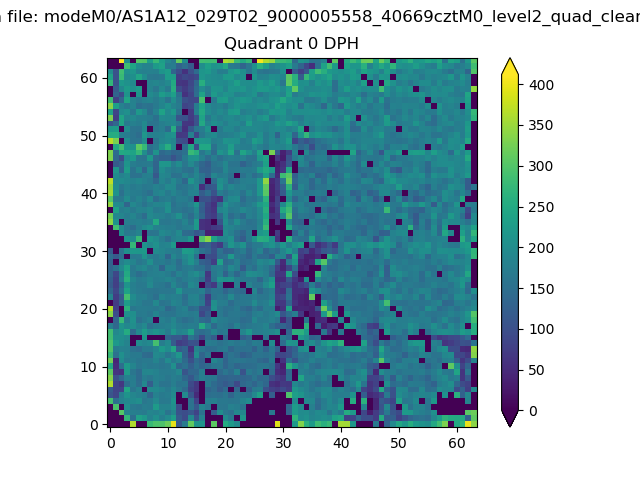 |
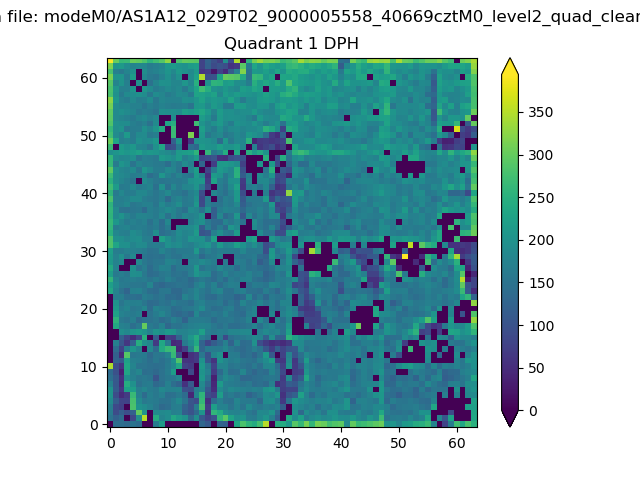 |
Quadrant B |
|---|---|---|---|
| Quadrant D | 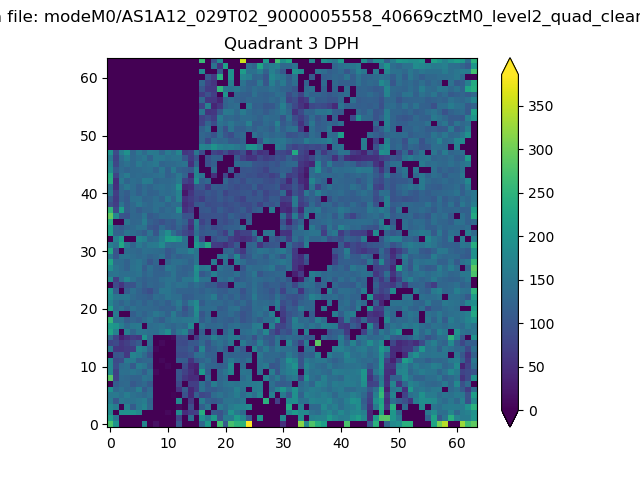 |
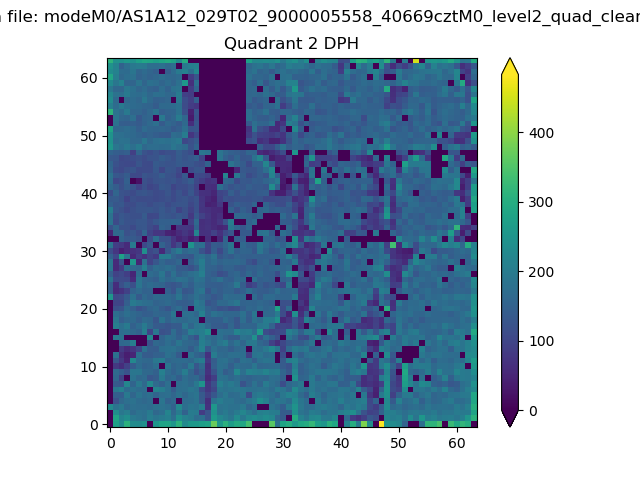 |
Quadrant C |
| Plot type | Count rate plots | Images |
|---|---|---|
| Comparison with Poisson distribution Blue bars denote a histogram of data divided into 1 sec bins. Red curve is a Poisson curve with rate = median count rate of data. |
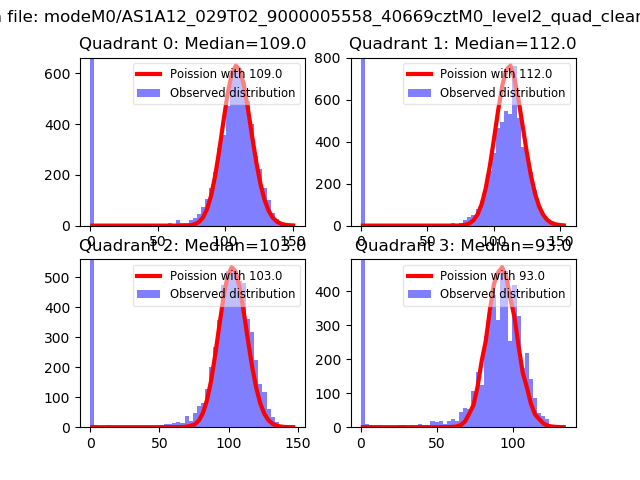 |
 |
| Quadrant-wise count rates Data is divided into 100 sec bins |
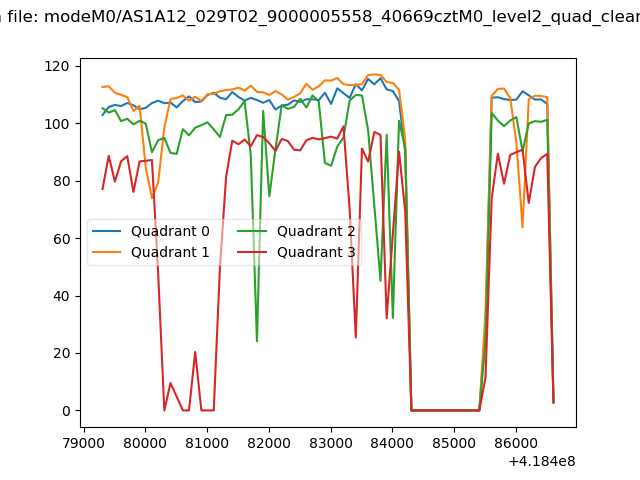 |
|
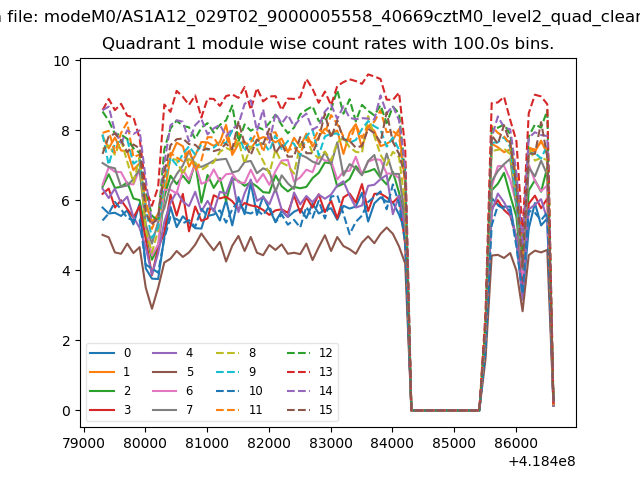
| Module-wise count rates for Quadrant A Data is divided into 100 sec bins |
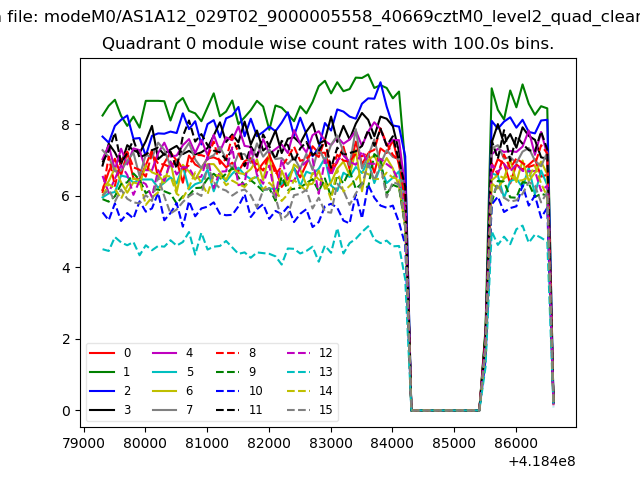 |
 |
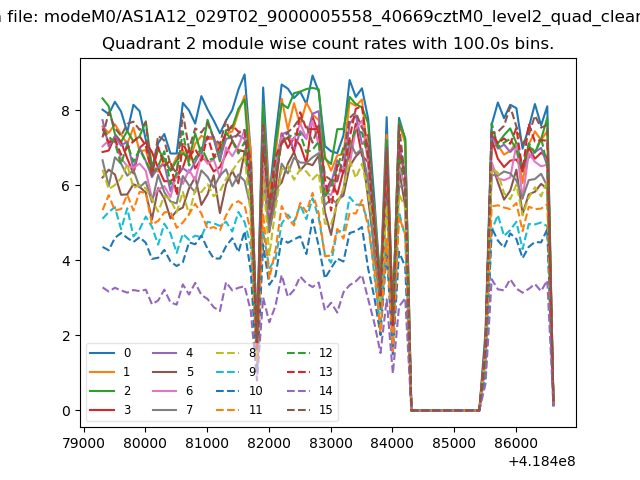
| Module-wise count rates for Quadrant B Data is divided into 100 sec bins |
 |
 |
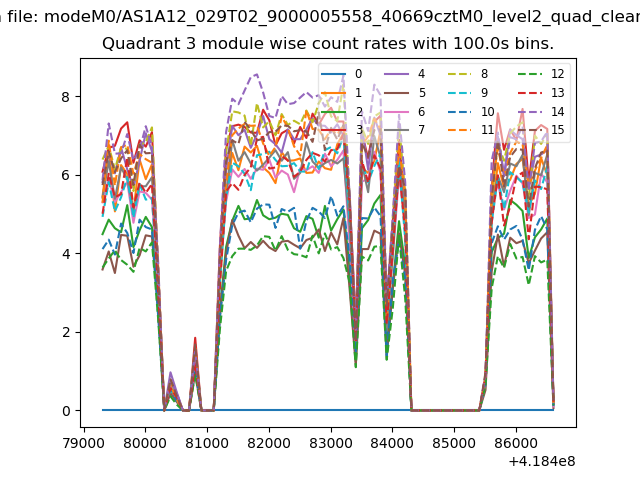
| Module-wise count rates for Quadrant C Data is divided into 100 sec bins |
 |
 |
| Module-wise count rates for Quadrant D Data is divided into 100 sec bins |
 |
 |
| Parameter | Plot |
|---|---|
| CZT HV Monitor | 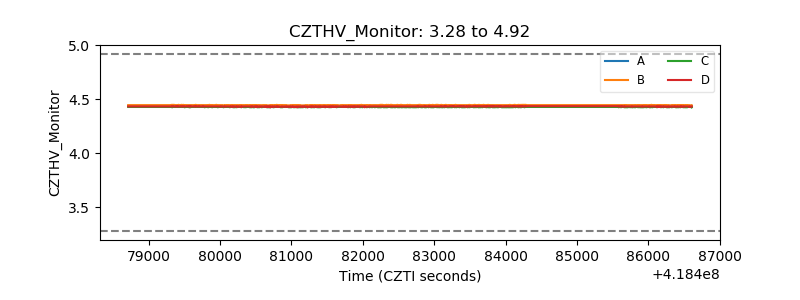 |
| D_VDD | 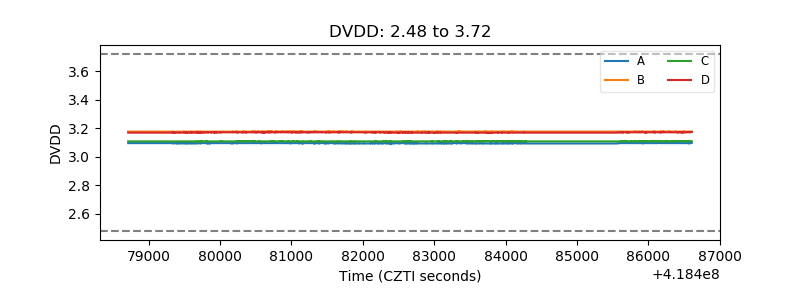 |
| Temperature 1 | 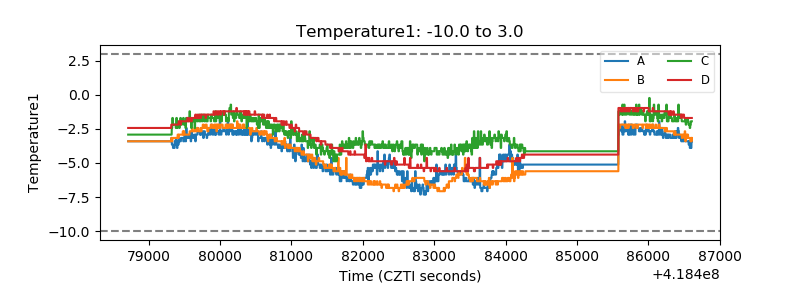 |
| Veto HV Monitor | 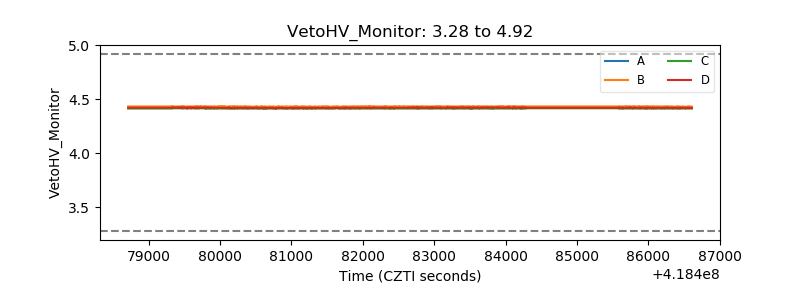 |
| Veto LLD | 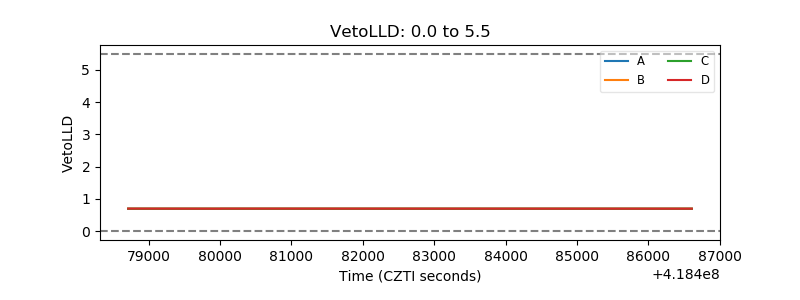 |
| Alpha Counter | 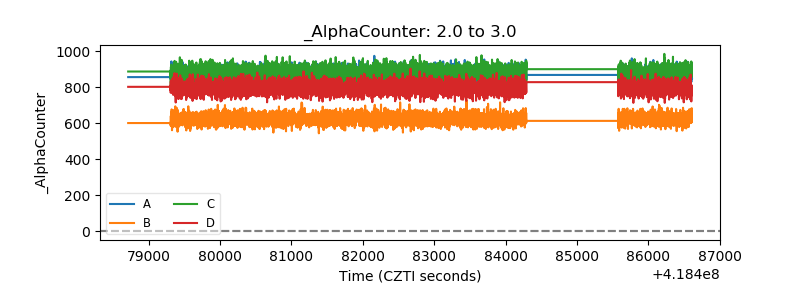 |
| _CPM_Rate | 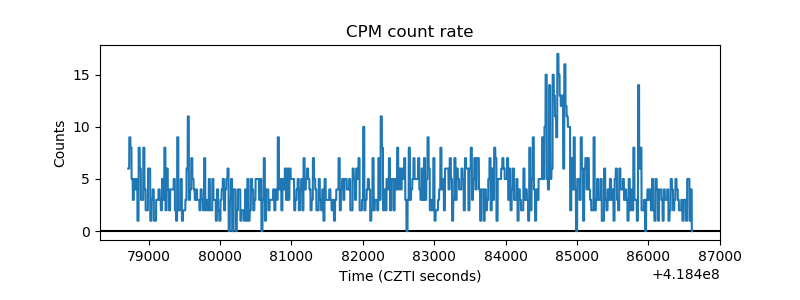 |
| CZT Counter | 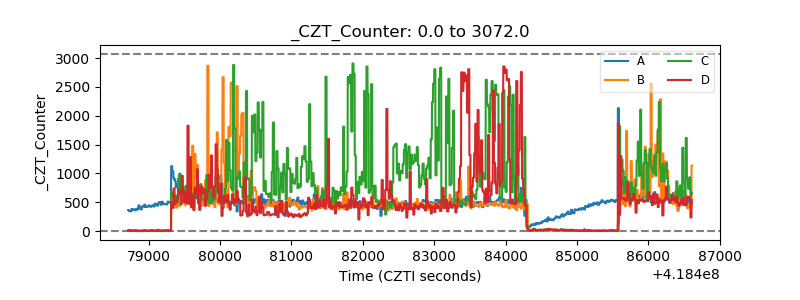 |
| +2.5 Volts monitor | 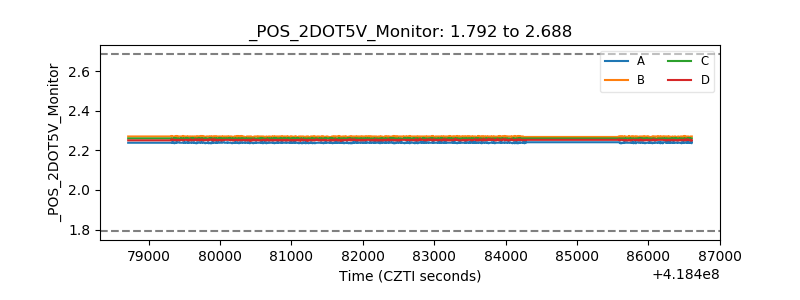 |
| +5 Volts monitor | 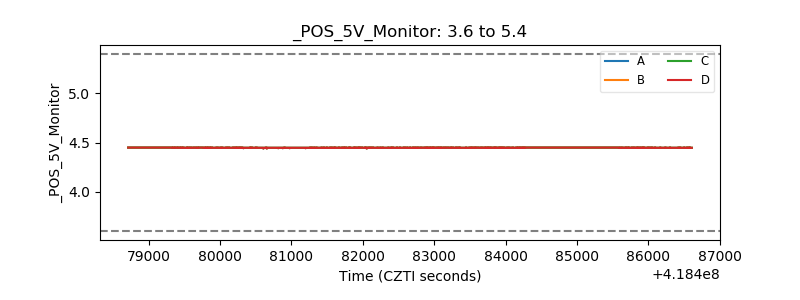 |
| _ROLL_ROT | 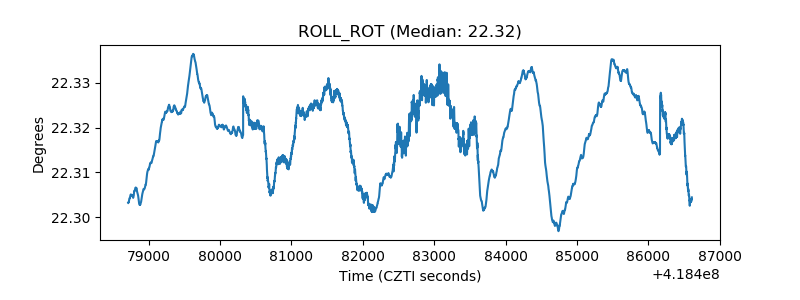 |
| _Roll_DEC | 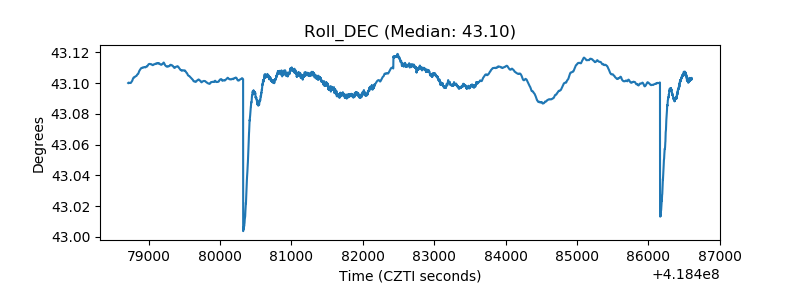 |
| _Roll_RA | 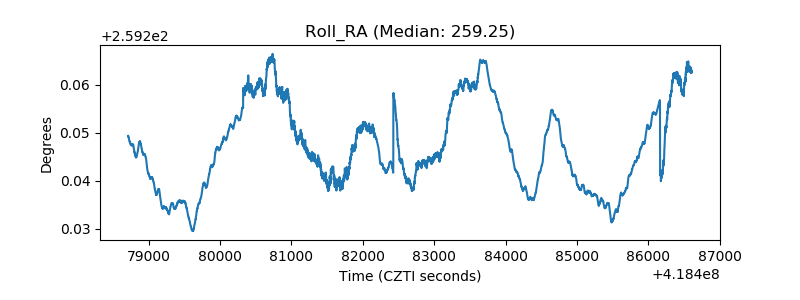 |
| Veto Counter | 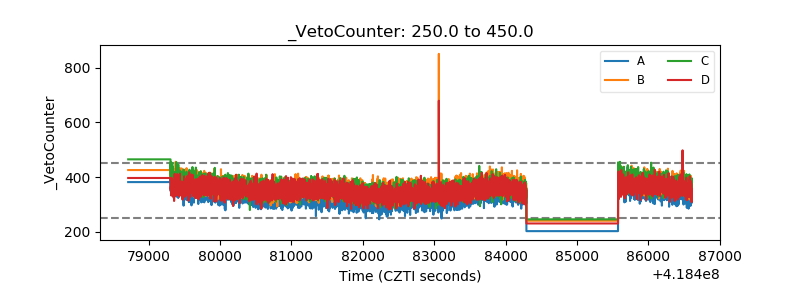 |