| Param | Original file | Final file |
|---|---|---|
| Filename | modeM0/AS1A12_029T02_9000005558_40672cztM0_level2.fits | modeM0/AS1A12_029T02_9000005558_40672cztM0_level2_quad_clean.evt |
| Size (bytes) | 926,792,640 | 228,749,760 |
| Size | 883.9 MB | 218.2 MB |
| Events in quadrant A | 7,421,209 | 1,562,336 |
| Events in quadrant B | 7,182,960 | 1,597,383 |
| Events in quadrant C | 10,004,397 | 1,500,390 |
| Events in quadrant D | 8,581,328 | 1,271,116 |
| Mode M0 | |||
|---|---|---|---|
| Quadrant | BADHDUFLAG | Total packets | Discarded packets |
| A | 0 | 31047 | 4 |
| B | 0 | 30983 | 3 |
| C | 0 | 38835 | 3 |
| D | 0 | 35567 | 3 |
| Mode M9 | |||
|---|---|---|---|
| Quadrant | BADHDUFLAG | Total packets | Discarded packets |
| A | 0 | 44 | 0 |
| B | 0 | 44 | 0 |
| C | 0 | 44 | 0 |
| D | 0 | 44 | 0 |
| Mode SS | |||
|---|---|---|---|
| Quadrant | BADHDUFLAG | Total packets | Discarded packets |
| A | 0 | 292 | 0 |
| B | 0 | 292 | 0 |
| C | 0 | 292 | 0 |
| D | 0 | 292 | 0 |
| Quadrant | Total seconds | Saturated seconds | Saturation percentage |
|---|---|---|---|
| A | 14407 | 31 | 0.215173% |
| B | 14407 | 106 | 0.735753% |
| C | 14407 | 474 | 3.290067% |
| D | 14407 | 1646 | 11.425002% |
Noise dominated data is calculated using 1-second bins in cleaned event files. If a bin has >2000 counts, and if more than 50% of those come from <1% of pixels, then it is considered to be noise-dominated and hence unusable.
| Quadrant | # 1 sec bins | Bins with >0 counts | Bins with >2000 counts | High rate bins dominated by noise | Noise dominated (total time) | Noise dominated (detector-on time) | Marked lightcurve |
|---|---|---|---|---|---|---|---|
| A | 18736 | 14410 | 6 | 6 | 0.03% | 0.04% | 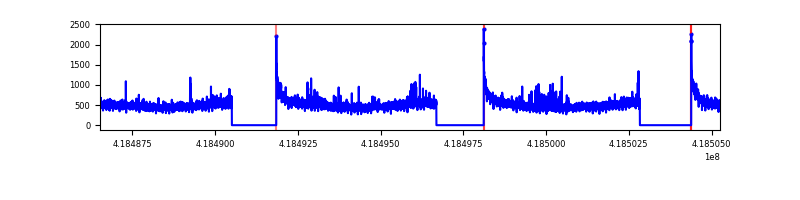 |
| B | 18736 | 14410 | 43 | 43 | 0.23% | 0.30% | 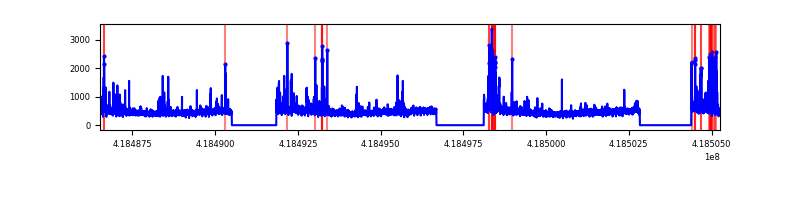 |
| C | 18736 | 14410 | 497 | 497 | 2.65% | 3.45% | 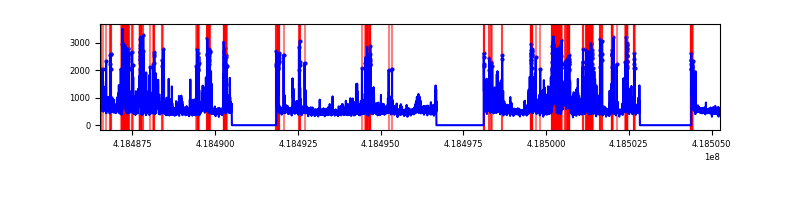 |
| D | 18736 | 14410 | 304 | 304 | 1.62% | 2.11% | 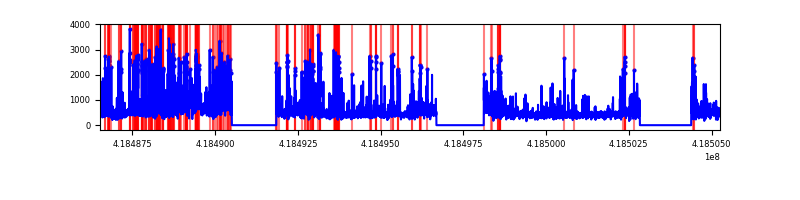 |
Top three noisy pixels from each quadrant. If the there are fewer than three noisy pixels in the level2.evt file, extra rows are filled as -1
| Pixel properties | Quadrant properties | ||||||
|---|---|---|---|---|---|---|---|
| Quadrant | DetID | PixID | Counts | Sigma | Mean | Median | Sigma |
| A | 10 | 83 | 1119263 | 3458.81 | 1579 | 1547 | 323.2 |
| A | 12 | 189 | 114731 | 350.25 | 1579 | 1547 | 323.2 |
| A | 2 | 79 | 62651 | 189.09 | 1579 | 1547 | 323.2 |
| B | 0 | 229 | 338089 | 1116.6 | 1570 | 1526 | 301.4 |
| B | 0 | 190 | 229995 | 757.98 | 1570 | 1526 | 301.4 |
| B | 5 | 255 | 149608 | 491.29 | 1570 | 1526 | 301.4 |
| C | 9 | 187 | 1967438 | 5490.28 | 1532 | 1540 | 358.1 |
| C | 14 | 254 | 1303998 | 3637.45 | 1532 | 1540 | 358.1 |
| C | 15 | 214 | 606161 | 1688.56 | 1532 | 1540 | 358.1 |
| D | 12 | 227 | 1285329 | 3618.71 | 1446 | 1407 | 354.8 |
| D | 2 | 250 | 515738 | 1449.63 | 1446 | 1407 | 354.8 |
| D | 12 | 191 | 427840 | 1201.89 | 1446 | 1407 | 354.8 |
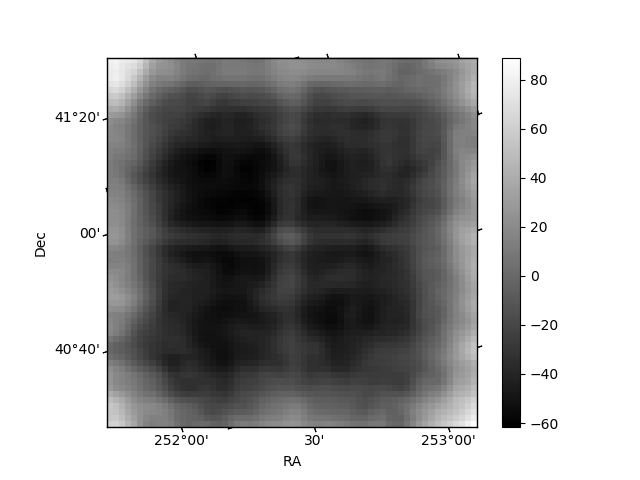
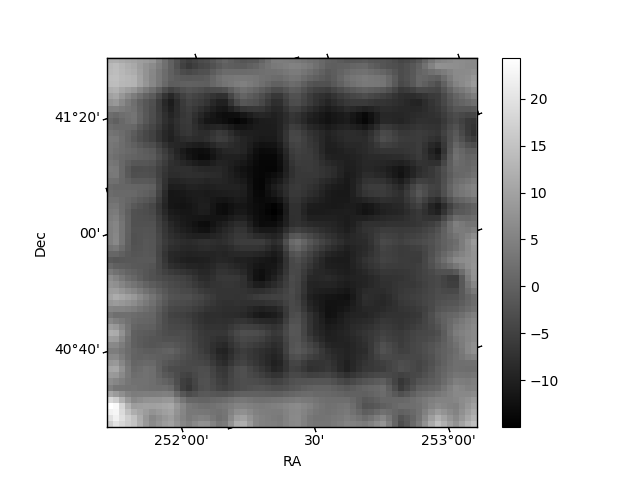
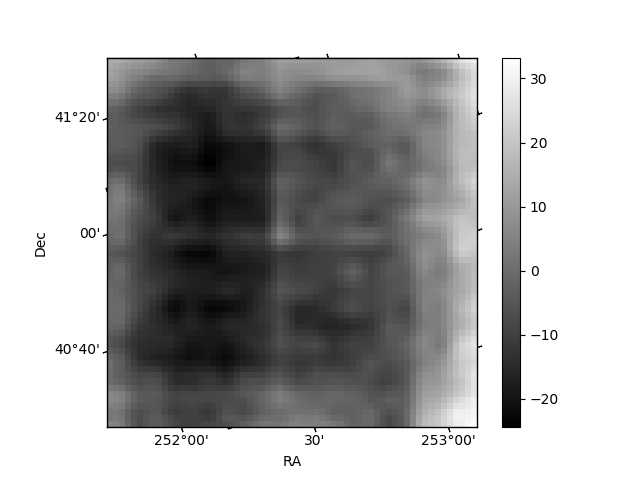
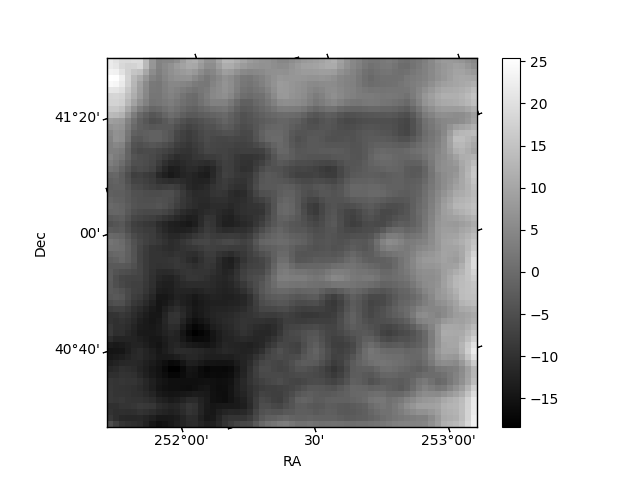
Histogram calculated using DETX and DETY for each event in the final _common_clean file
| Quadrant A | 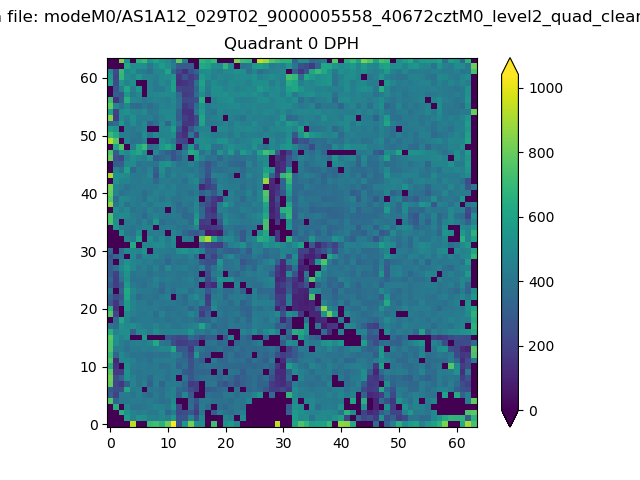 |
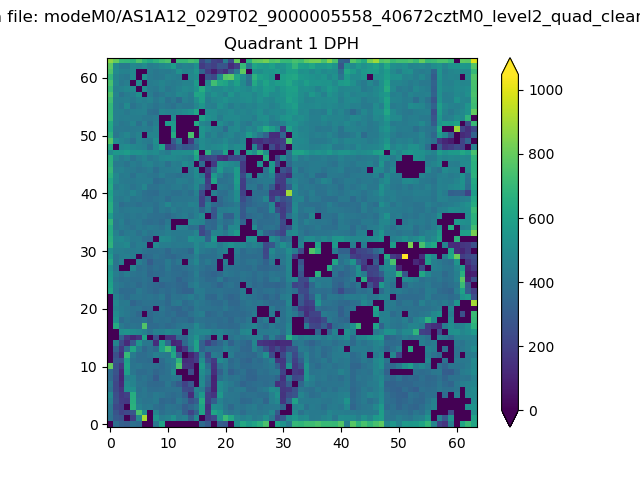 |
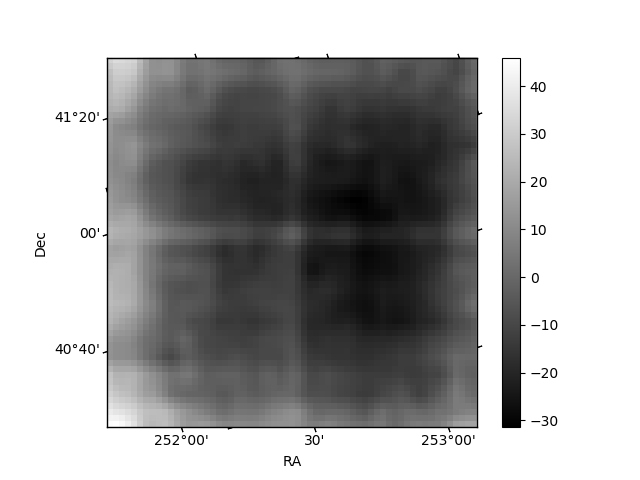
Quadrant B |
|---|---|---|---|
| Quadrant D | 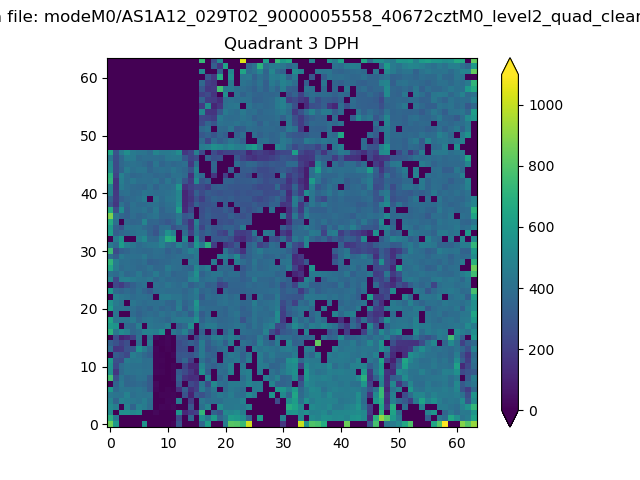 |
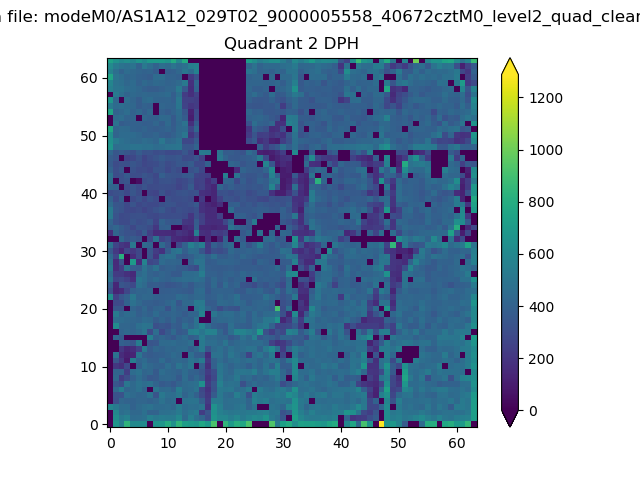 |
Quadrant C |
| Plot type | Count rate plots | Images |
|---|---|---|
| Comparison with Poisson distribution Blue bars denote a histogram of data divided into 1 sec bins. Red curve is a Poisson curve with rate = median count rate of data. |
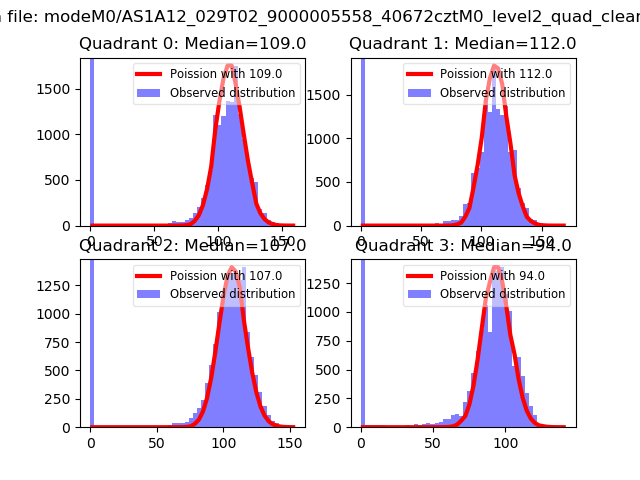 |
 |
| Quadrant-wise count rates Data is divided into 100 sec bins |
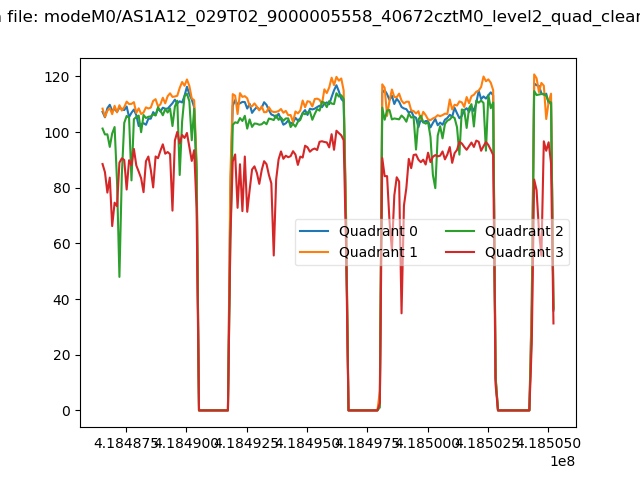 |
|
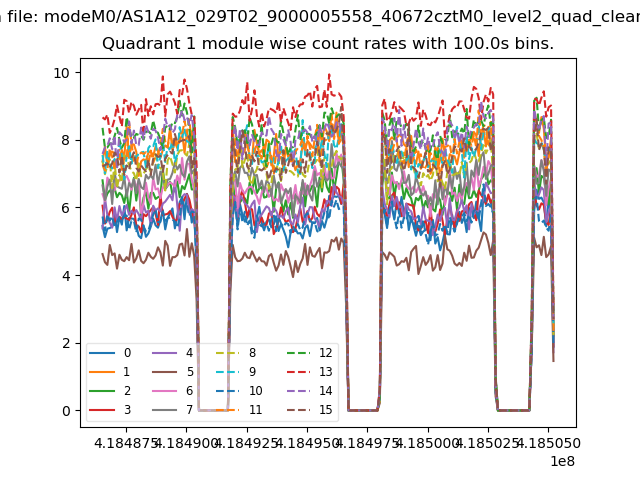
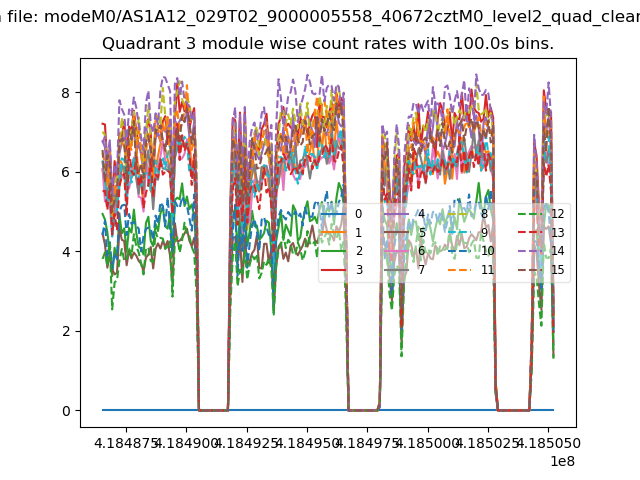
| Module-wise count rates for Quadrant A Data is divided into 100 sec bins |
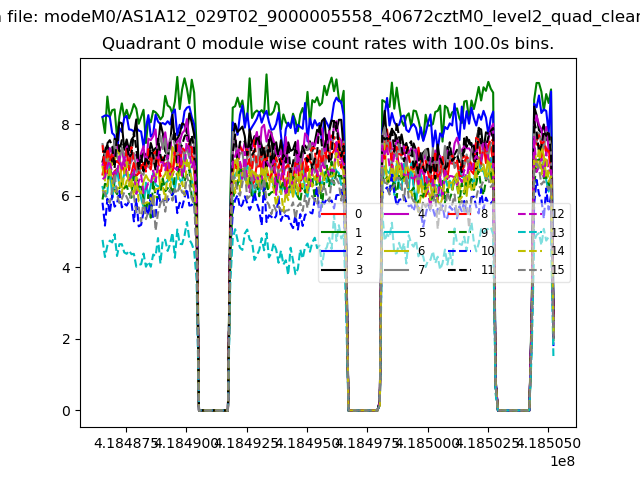 |
 |
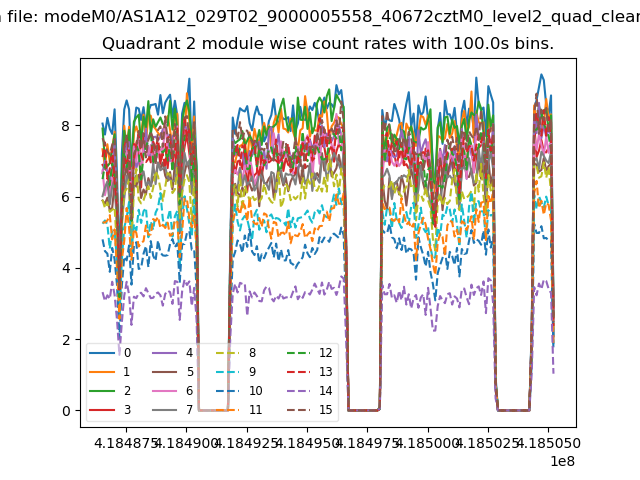
| Module-wise count rates for Quadrant B Data is divided into 100 sec bins |
 |
 |
| Module-wise count rates for Quadrant C Data is divided into 100 sec bins |
 |
 |
| Module-wise count rates for Quadrant D Data is divided into 100 sec bins |
 |
 |
| Parameter | Plot |
|---|---|
| CZT HV Monitor | 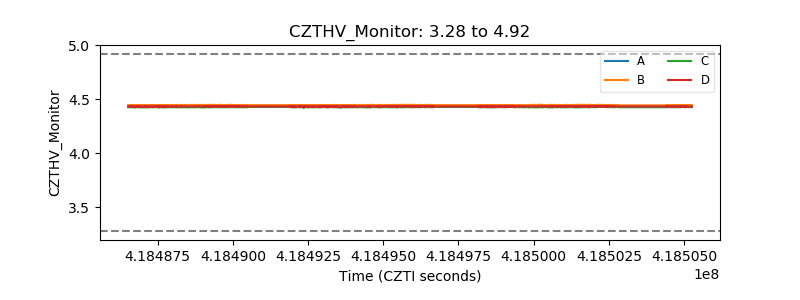 |
| D_VDD | 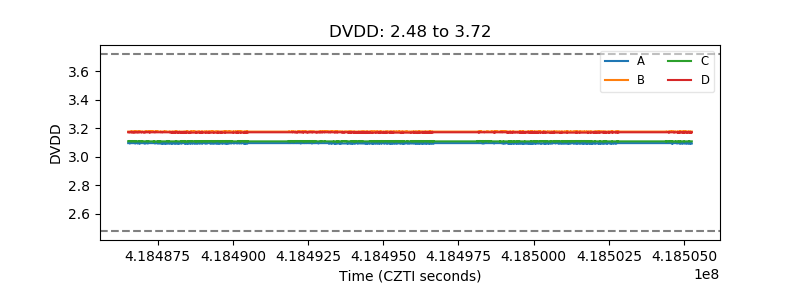 |
| Temperature 1 | 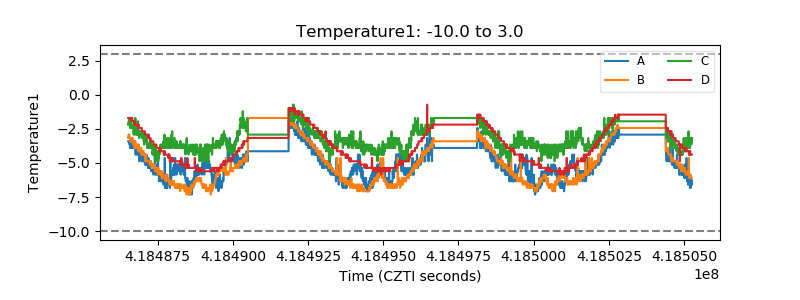 |
| Veto HV Monitor | 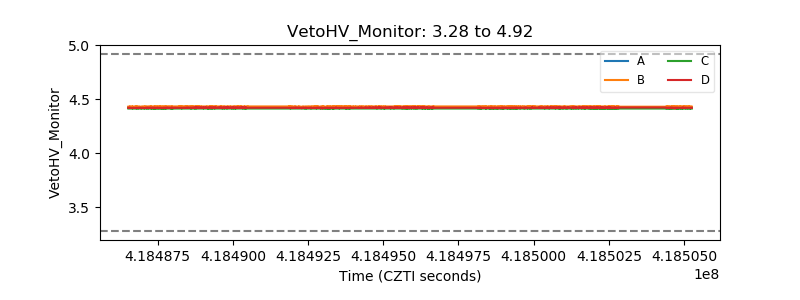 |
| Veto LLD | 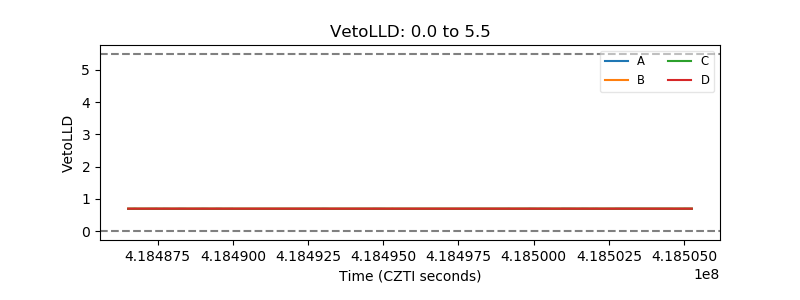 |
| Alpha Counter | 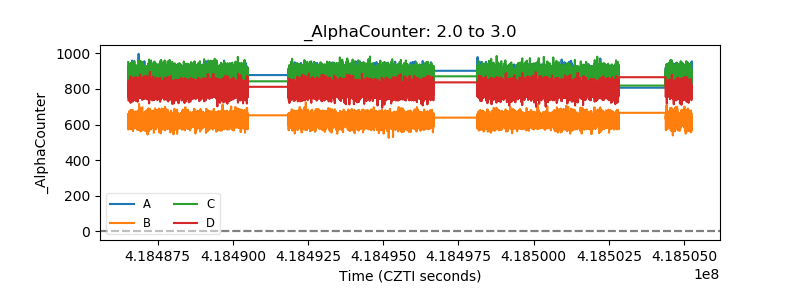 |
| _CPM_Rate | 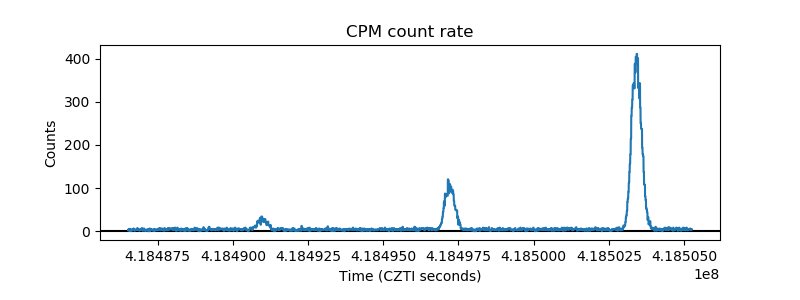 |
| CZT Counter | 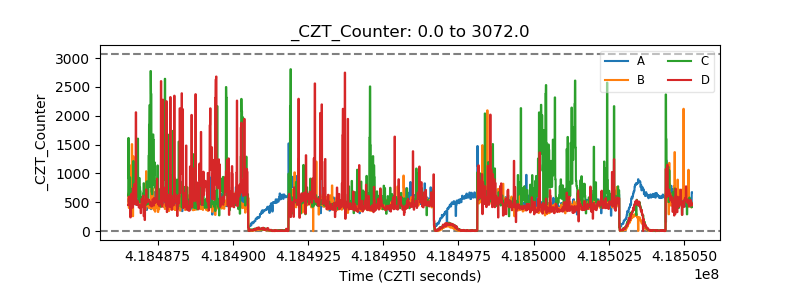 |
| +2.5 Volts monitor | 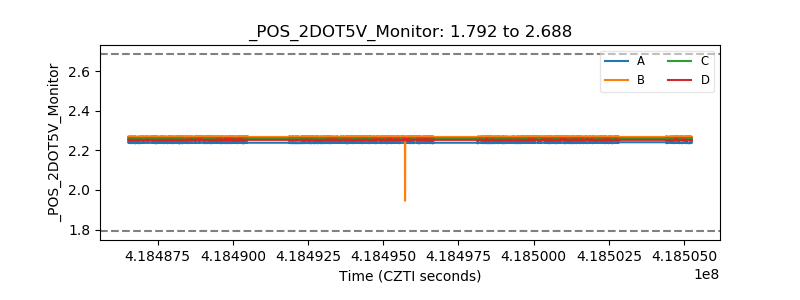 |
| +5 Volts monitor | 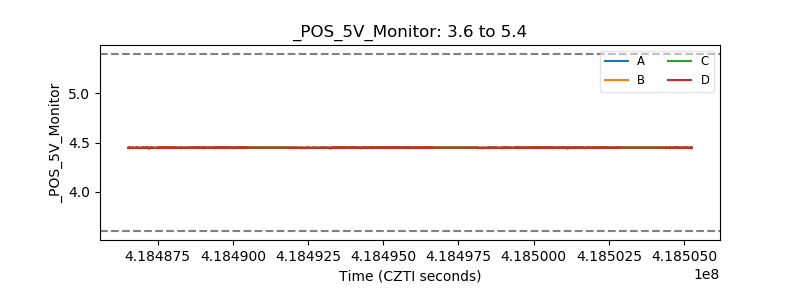 |
| _ROLL_ROT | 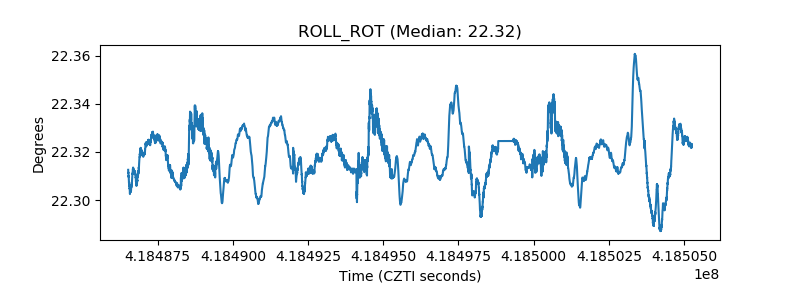 |
| _Roll_DEC | 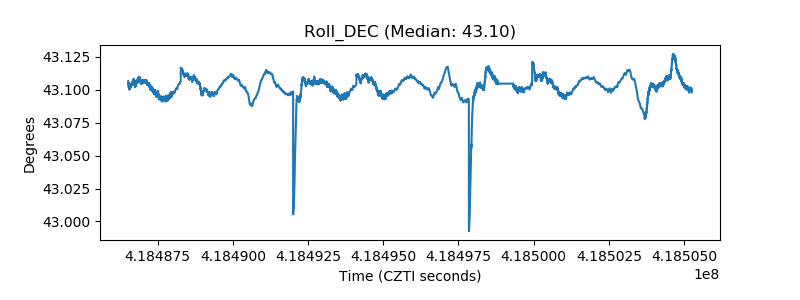 |
| _Roll_RA | 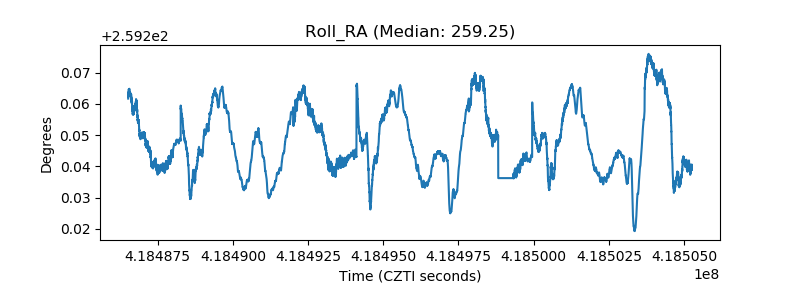 |
| Veto Counter | 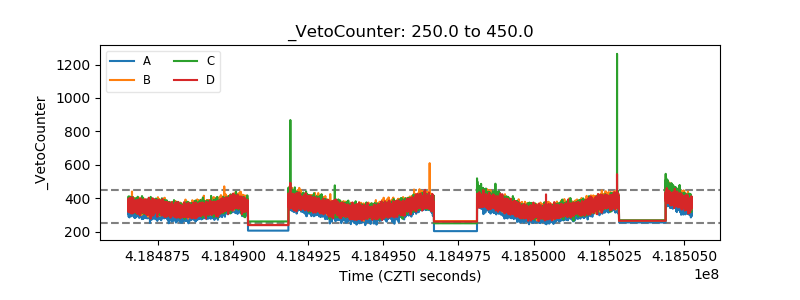 |