| Param | Original file | Final file |
|---|---|---|
| Filename | modeM0/AS1A12_029T02_9000005558_40673cztM0_level2.fits | modeM0/AS1A12_029T02_9000005558_40673cztM0_level2_quad_clean.evt |
| Size (bytes) | 330,744,960 | 90,578,880 |
| Size | 315.4 MB | 86.4 MB |
| Events in quadrant A | 2,922,154 | 611,649 |
| Events in quadrant B | 2,842,142 | 630,459 |
| Events in quadrant C | 3,358,354 | 610,293 |
| Events in quadrant D | 2,687,675 | 502,237 |
| Mode M0 | |||
|---|---|---|---|
| Quadrant | BADHDUFLAG | Total packets | Discarded packets |
| A | 0 | 12281 | 3 |
| B | 0 | 12175 | 2 |
| C | 0 | 13395 | 2 |
| D | 0 | 12003 | 2 |
| Mode M9 | |||
|---|---|---|---|
| Quadrant | BADHDUFLAG | Total packets | Discarded packets |
| A | 0 | 19 | 0 |
| B | 0 | 19 | 0 |
| C | 0 | 19 | 0 |
| D | 0 | 20 | 0 |
| Mode SS | |||
|---|---|---|---|
| Quadrant | BADHDUFLAG | Total packets | Discarded packets |
| A | 0 | 112 | 0 |
| B | 0 | 112 | 0 |
| C | 0 | 112 | 0 |
| D | 0 | 112 | 0 |
| Quadrant | Total seconds | Saturated seconds | Saturation percentage |
|---|---|---|---|
| A | 5547 | 14 | 0.252389% |
| B | 5547 | 59 | 1.063638% |
| C | 5547 | 40 | 0.721111% |
| D | 5547 | 651 | 11.736074% |
Noise dominated data is calculated using 1-second bins in cleaned event files. If a bin has >2000 counts, and if more than 50% of those come from <1% of pixels, then it is considered to be noise-dominated and hence unusable.
| Quadrant | # 1 sec bins | Bins with >0 counts | Bins with >2000 counts | High rate bins dominated by noise | Noise dominated (total time) | Noise dominated (detector-on time) | Marked lightcurve |
|---|---|---|---|---|---|---|---|
| A | 7218 | 5548 | 8 | 8 | 0.11% | 0.14% | 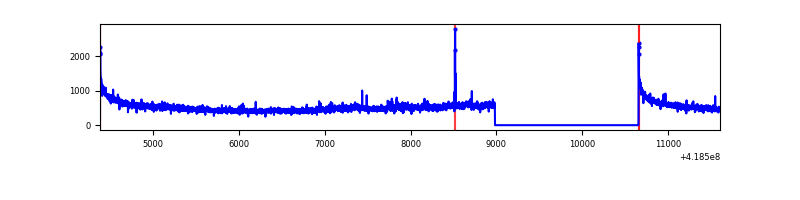 |
| B | 7218 | 5548 | 31 | 31 | 0.43% | 0.56% | 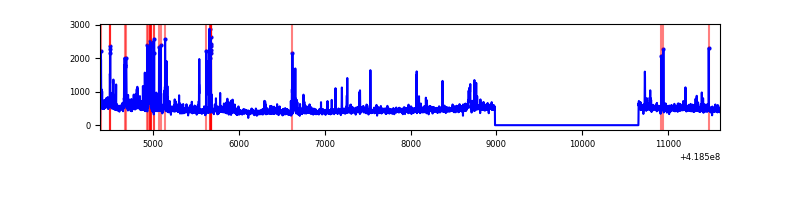 |
| C | 7218 | 5548 | 34 | 34 | 0.47% | 0.61% | 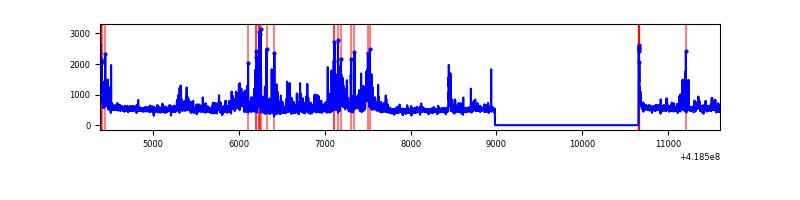 |
| D | 7218 | 5548 | 21 | 21 | 0.29% | 0.38% | 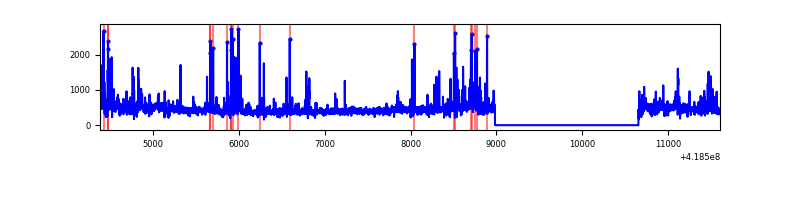 |
Top three noisy pixels from each quadrant. If the there are fewer than three noisy pixels in the level2.evt file, extra rows are filled as -1
| Pixel properties | Quadrant properties | ||||||
|---|---|---|---|---|---|---|---|
| Quadrant | DetID | PixID | Counts | Sigma | Mean | Median | Sigma |
| A | 10 | 83 | 496638 | 3943.78 | 606 | 593 | 125.8 |
| A | 12 | 189 | 40188 | 314.8 | 606 | 593 | 125.8 |
| A | 13 | 252 | 21894 | 169.35 | 606 | 593 | 125.8 |
| B | 0 | 190 | 145635 | 1217.1 | 606 | 588 | 119.2 |
| B | 0 | 229 | 136933 | 1144.08 | 606 | 588 | 119.2 |
| B | 5 | 255 | 110892 | 925.57 | 606 | 588 | 119.2 |
| C | 9 | 187 | 609538 | 4313.8 | 598 | 603 | 141.2 |
| C | 15 | 214 | 242459 | 1713.35 | 598 | 603 | 141.2 |
| C | 14 | 254 | 75702 | 532.01 | 598 | 603 | 141.2 |
| D | 2 | 250 | 208251 | 1495.18 | 555 | 540 | 138.9 |
| D | 12 | 191 | 183695 | 1318.41 | 555 | 540 | 138.9 |
| D | 9 | 19 | 48441 | 344.81 | 555 | 540 | 138.9 |
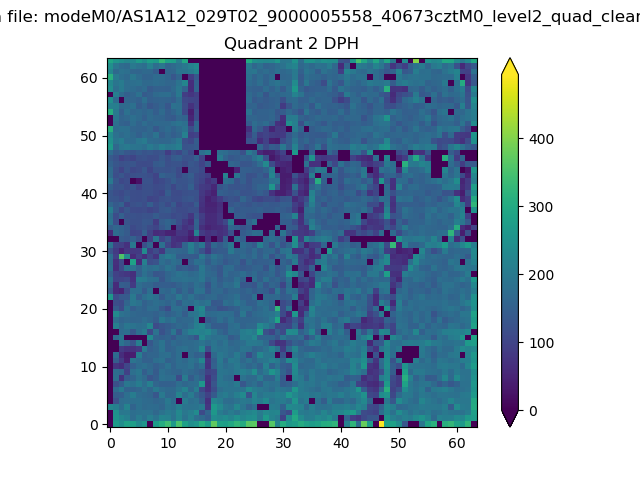
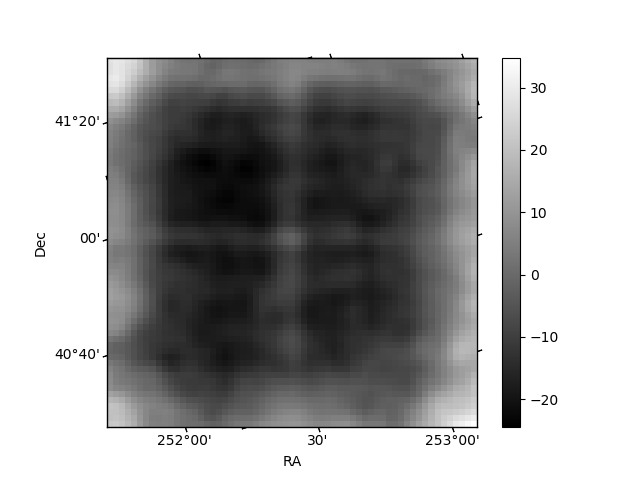
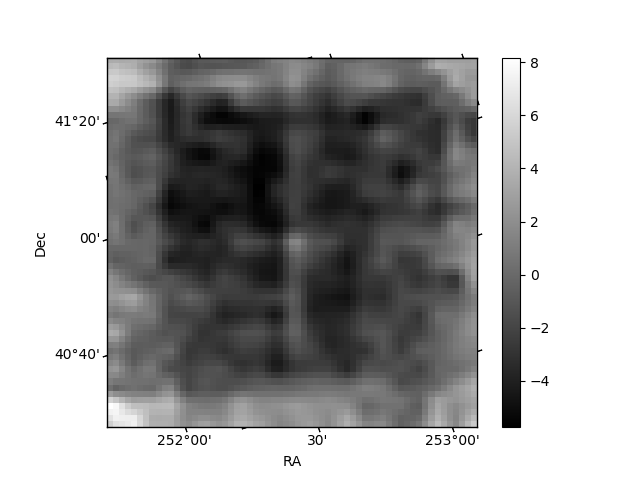
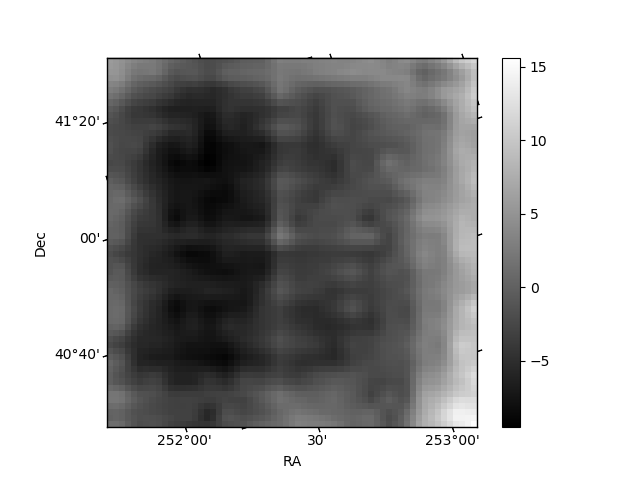
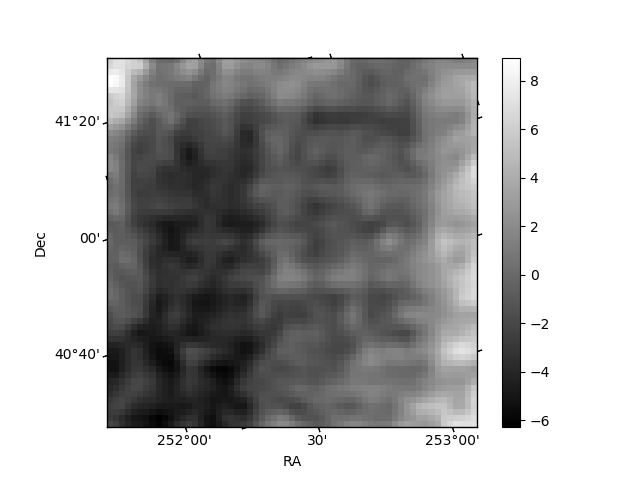
Histogram calculated using DETX and DETY for each event in the final _common_clean file
| Quadrant A | 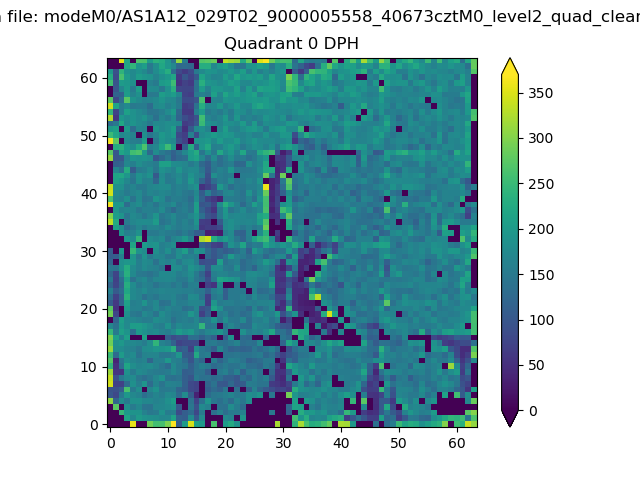 |
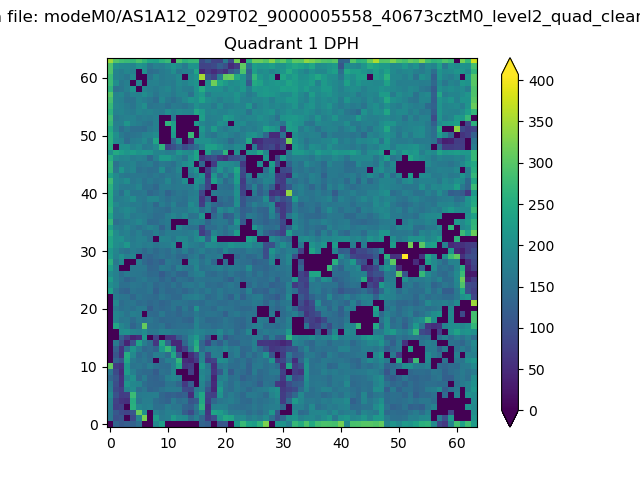 |
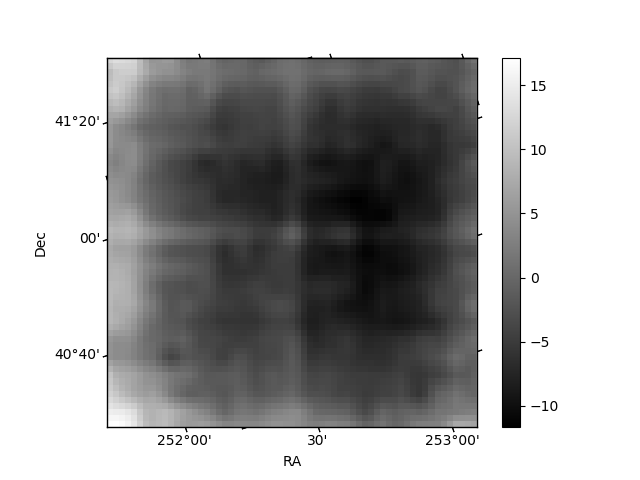
Quadrant B |
|---|---|---|---|
| Quadrant D | 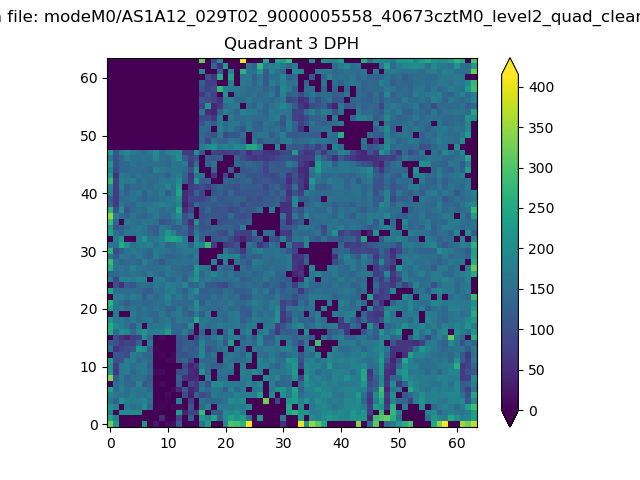 |
 |
Quadrant C |
| Plot type | Count rate plots | Images |
|---|---|---|
| Comparison with Poisson distribution Blue bars denote a histogram of data divided into 1 sec bins. Red curve is a Poisson curve with rate = median count rate of data. |
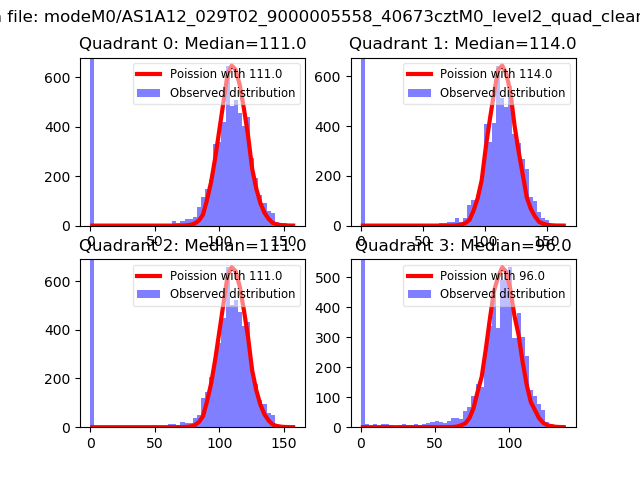 |
 |
| Quadrant-wise count rates Data is divided into 100 sec bins |
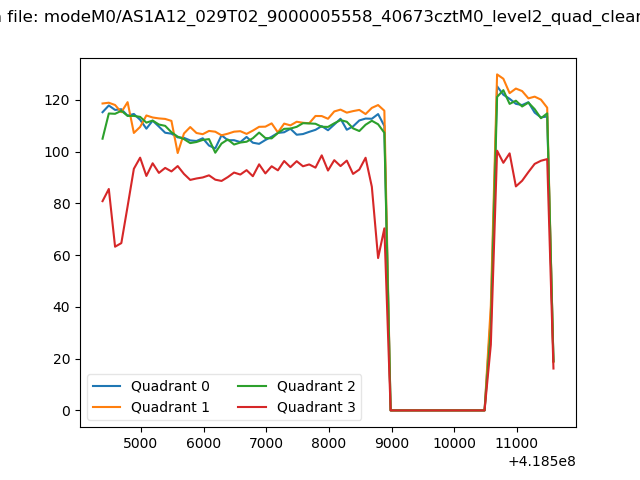 |
|
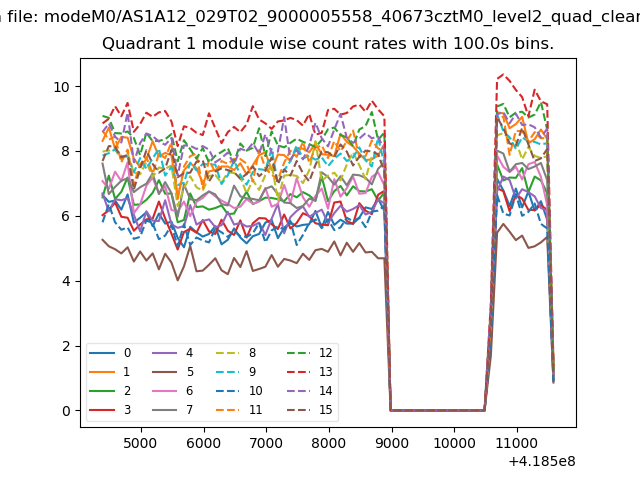
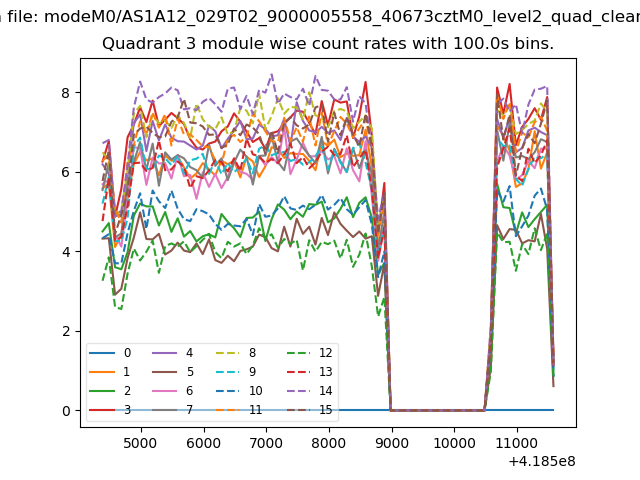
| Module-wise count rates for Quadrant A Data is divided into 100 sec bins |
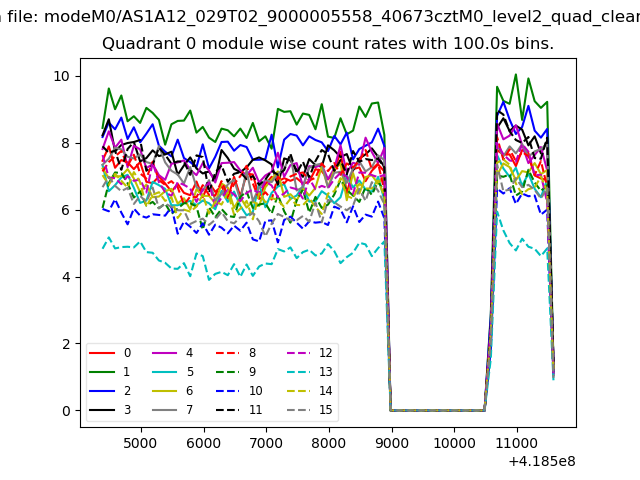 |
 |
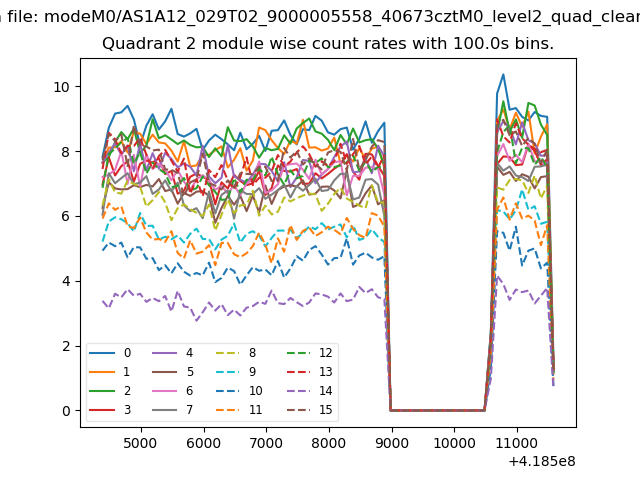
| Module-wise count rates for Quadrant B Data is divided into 100 sec bins |
 |
 |
| Module-wise count rates for Quadrant C Data is divided into 100 sec bins |
 |
 |
| Module-wise count rates for Quadrant D Data is divided into 100 sec bins |
 |
 |
| Parameter | Plot |
|---|---|
| CZT HV Monitor | 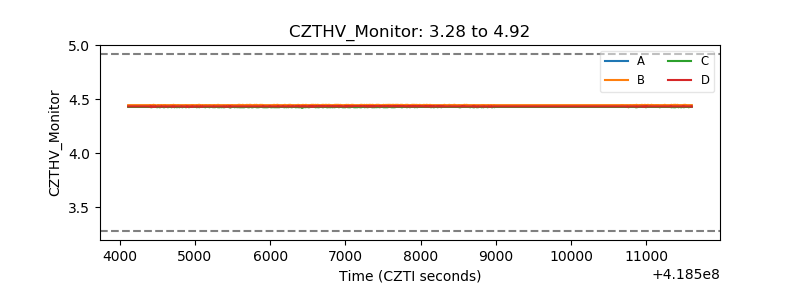 |
| D_VDD | 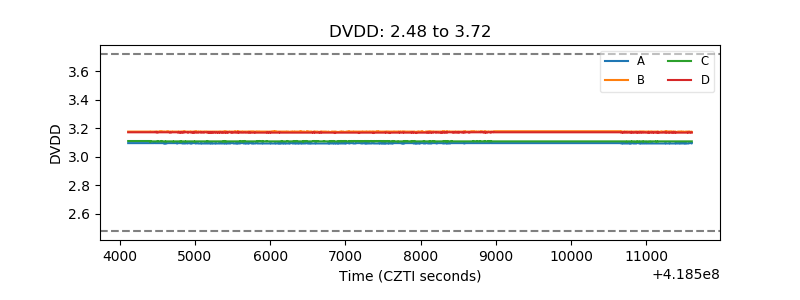 |
| Temperature 1 | 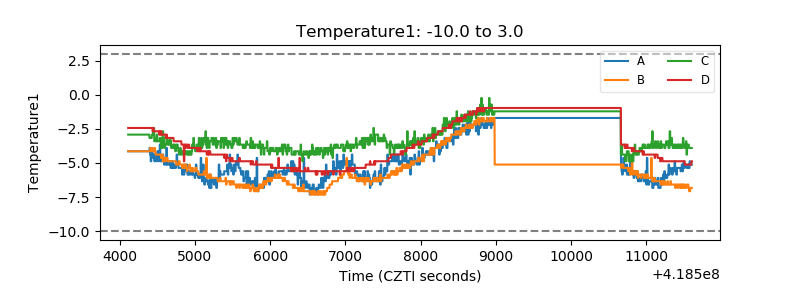 |
| Veto HV Monitor |  |
| Veto LLD | 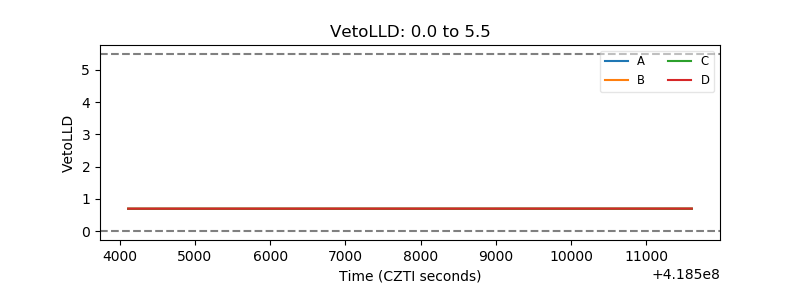 |
| Alpha Counter | 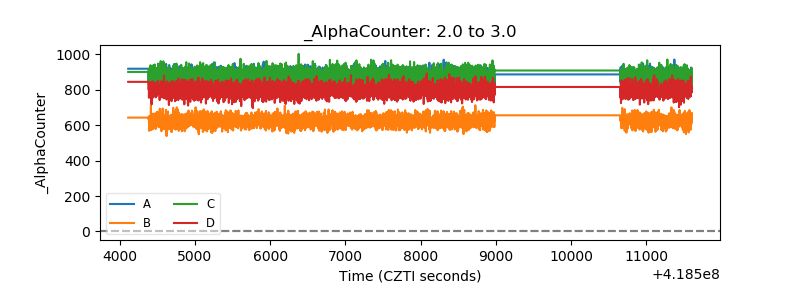 |
| _CPM_Rate | 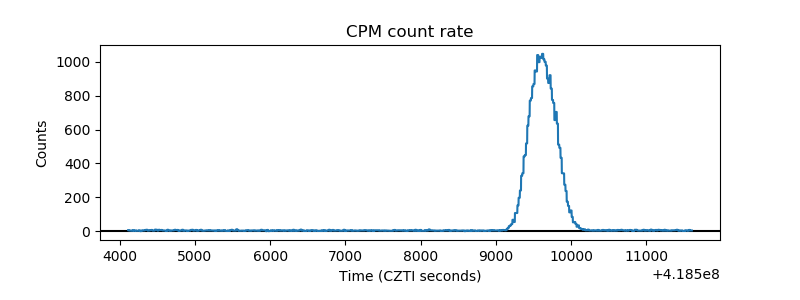 |
| CZT Counter | 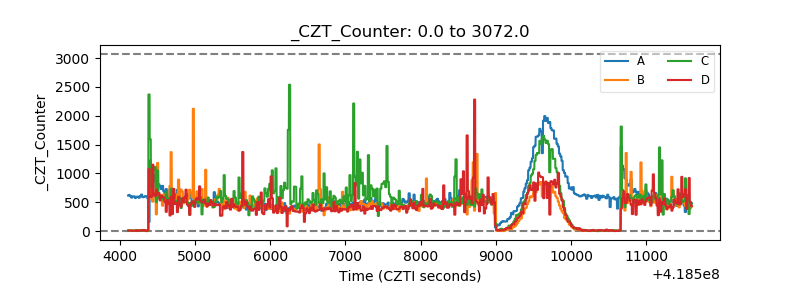 |
| +2.5 Volts monitor | 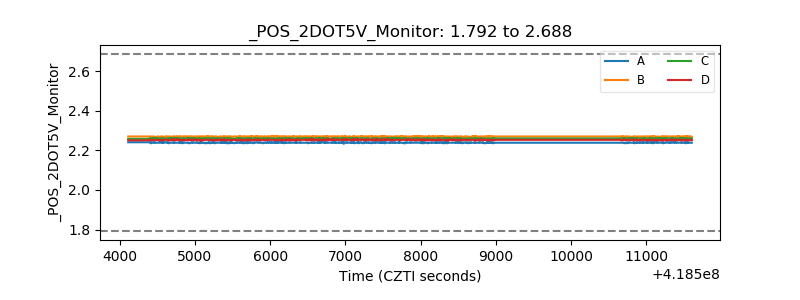 |
| +5 Volts monitor | 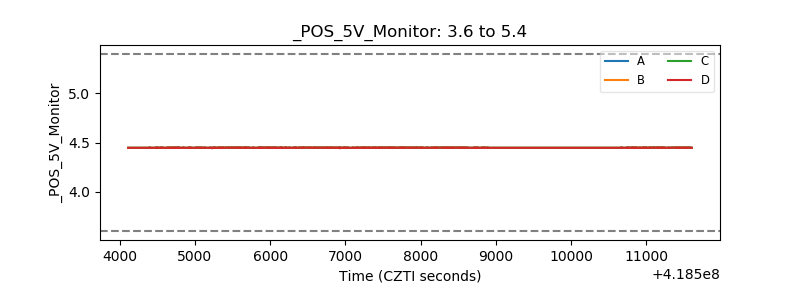 |
| _ROLL_ROT | 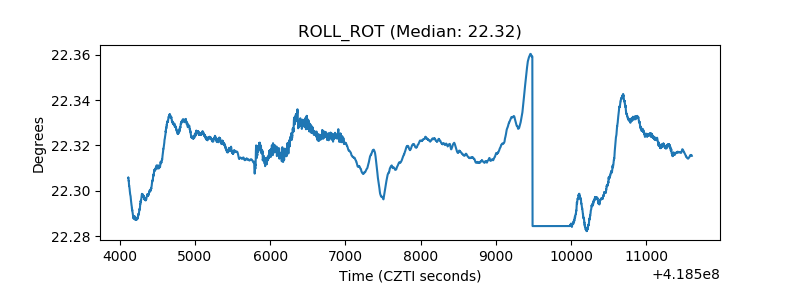 |
| _Roll_DEC | 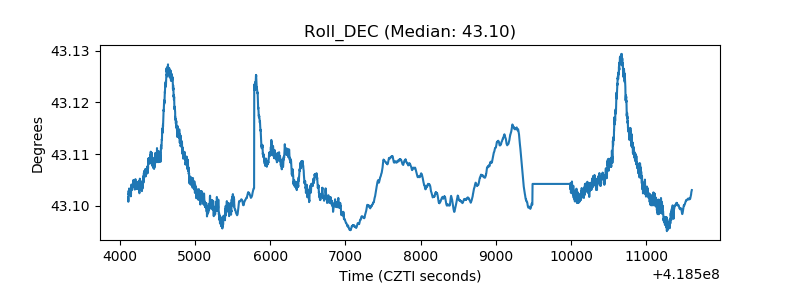 |
| _Roll_RA | 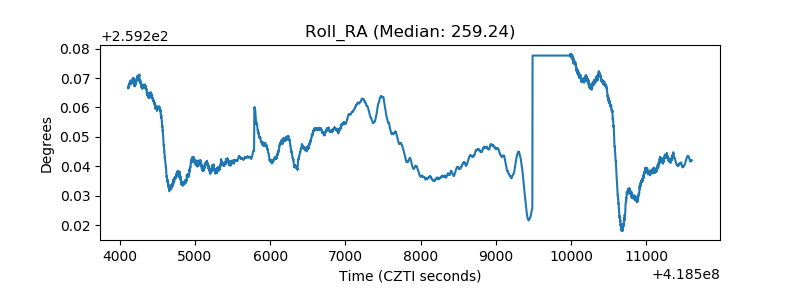 |
| Veto Counter | 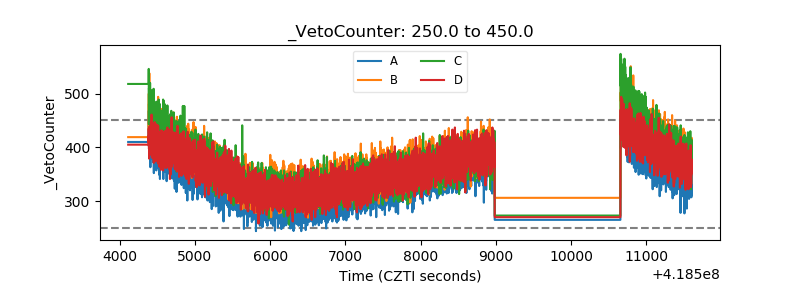 |