| Param | Original file | Final file |
|---|---|---|
| Filename | modeM0/AS1A12_029T02_9000005558_40675cztM0_level2.fits | modeM0/AS1A12_029T02_9000005558_40675cztM0_level2_quad_clean.evt |
| Size (bytes) | 336,240,000 | 85,631,040 |
| Size | 320.7 MB | 81.7 MB |
| Events in quadrant A | 2,741,327 | 586,619 |
| Events in quadrant B | 2,816,055 | 602,078 |
| Events in quadrant C | 3,930,490 | 550,452 |
| Events in quadrant D | 2,554,785 | 491,177 |
| Mode M0 | |||
|---|---|---|---|
| Quadrant | BADHDUFLAG | Total packets | Discarded packets |
| A | 0 | 11434 | 3 |
| B | 0 | 11793 | 2 |
| C | 0 | 15038 | 2 |
| D | 0 | 11290 | 2 |
| Mode M9 | |||
|---|---|---|---|
| Quadrant | BADHDUFLAG | Total packets | Discarded packets |
| A | 0 | 25 | 0 |
| B | 0 | 25 | 0 |
| C | 0 | 25 | 0 |
| D | 0 | 26 | 0 |
| Mode SS | |||
|---|---|---|---|
| Quadrant | BADHDUFLAG | Total packets | Discarded packets |
| A | 0 | 104 | 0 |
| B | 0 | 104 | 0 |
| C | 0 | 104 | 0 |
| D | 0 | 104 | 0 |
| Quadrant | Total seconds | Saturated seconds | Saturation percentage |
|---|---|---|---|
| A | 5178 | 17 | 0.328312% |
| B | 5178 | 94 | 1.815373% |
| C | 5178 | 355 | 6.855929% |
| D | 5178 | 455 | 8.787177% |
Noise dominated data is calculated using 1-second bins in cleaned event files. If a bin has >2000 counts, and if more than 50% of those come from <1% of pixels, then it is considered to be noise-dominated and hence unusable.
| Quadrant | # 1 sec bins | Bins with >0 counts | Bins with >2000 counts | High rate bins dominated by noise | Noise dominated (total time) | Noise dominated (detector-on time) | Marked lightcurve |
|---|---|---|---|---|---|---|---|
| A | 7000 | 5179 | 10 | 10 | 0.14% | 0.19% | 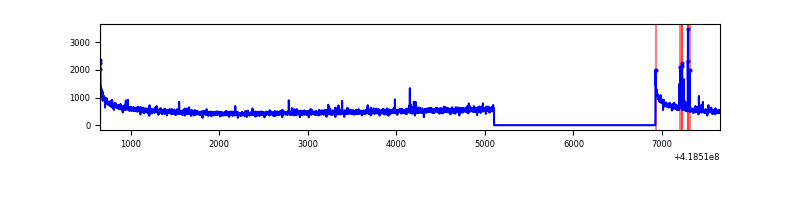 |
| B | 7000 | 5179 | 59 | 59 | 0.84% | 1.14% | 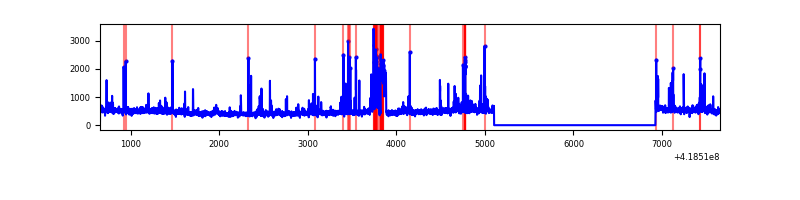 |
| C | 7000 | 5179 | 346 | 346 | 4.94% | 6.68% | 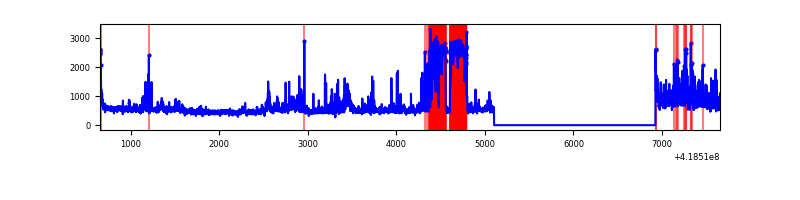 |
| D | 7000 | 5179 | 20 | 20 | 0.29% | 0.39% | 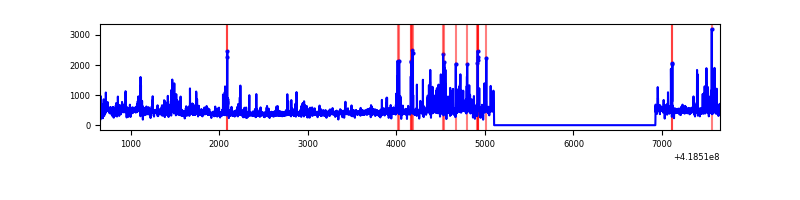 |
Top three noisy pixels from each quadrant. If the there are fewer than three noisy pixels in the level2.evt file, extra rows are filled as -1
| Pixel properties | Quadrant properties | ||||||
|---|---|---|---|---|---|---|---|
| Quadrant | DetID | PixID | Counts | Sigma | Mean | Median | Sigma |
| A | 10 | 83 | 469555 | 4011.5 | 569 | 558 | 116.9 |
| A | 13 | 248 | 45560 | 384.92 | 569 | 558 | 116.9 |
| A | 13 | 252 | 9601 | 77.35 | 569 | 558 | 116.9 |
| B | 0 | 229 | 357093 | 3256.85 | 567 | 550 | 109.5 |
| B | 0 | 190 | 65485 | 593.15 | 567 | 550 | 109.5 |
| B | 5 | 255 | 62533 | 566.19 | 567 | 550 | 109.5 |
| C | 14 | 254 | 954526 | 7562.6 | 535 | 537 | 126.1 |
| C | 9 | 187 | 579036 | 4585.96 | 535 | 537 | 126.1 |
| C | 15 | 214 | 217036 | 1716.26 | 535 | 537 | 126.1 |
| D | 2 | 250 | 181145 | 1388.02 | 525 | 511 | 130.1 |
| D | 12 | 191 | 152687 | 1169.35 | 525 | 511 | 130.1 |
| D | 9 | 19 | 60769 | 463.03 | 525 | 511 | 130.1 |
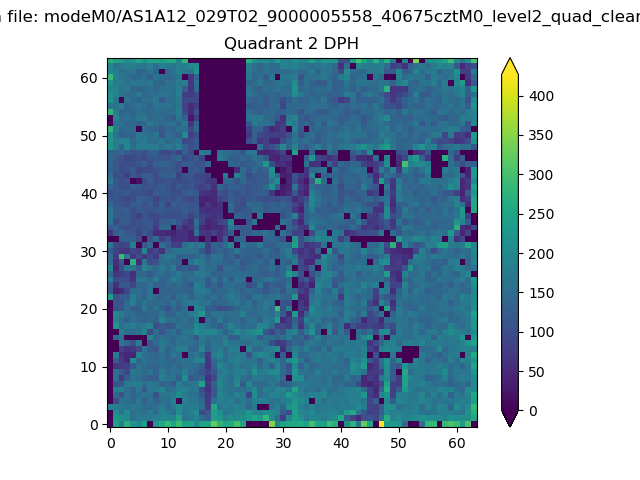
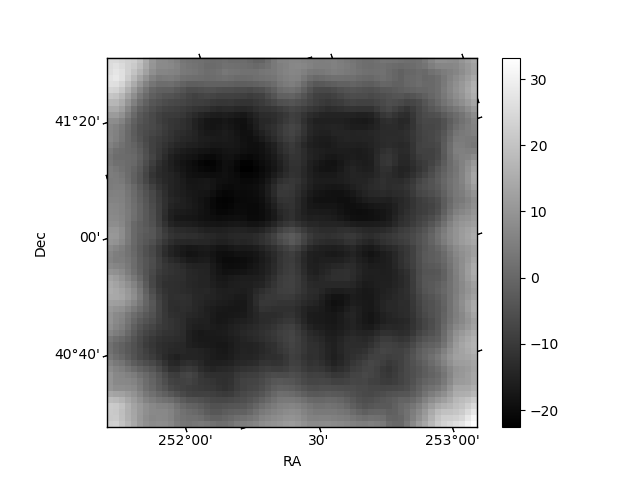
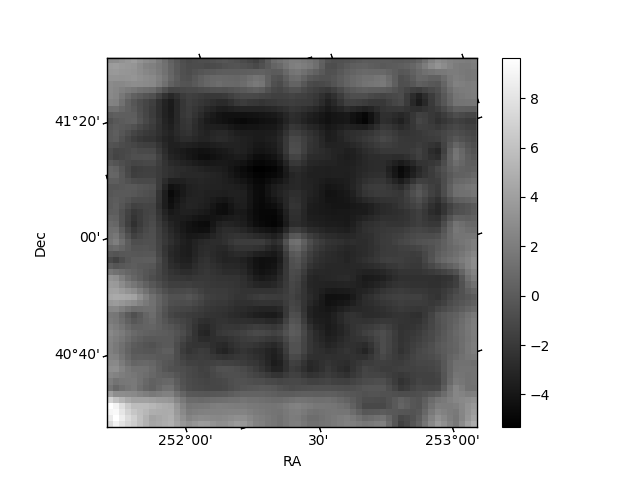
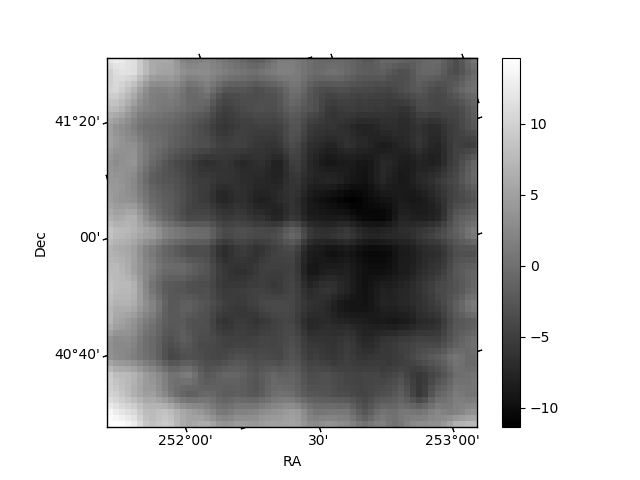
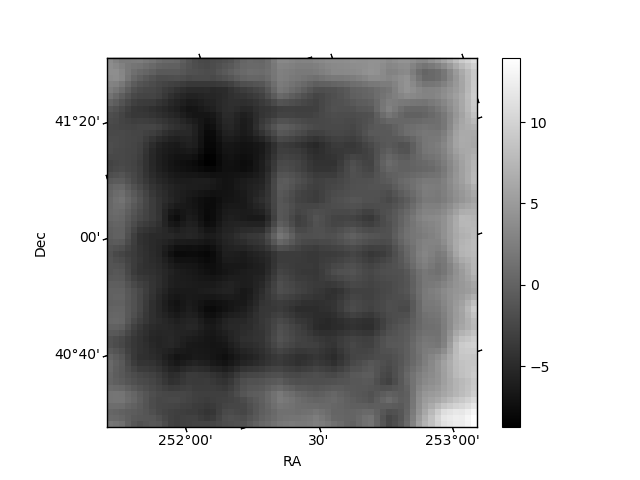
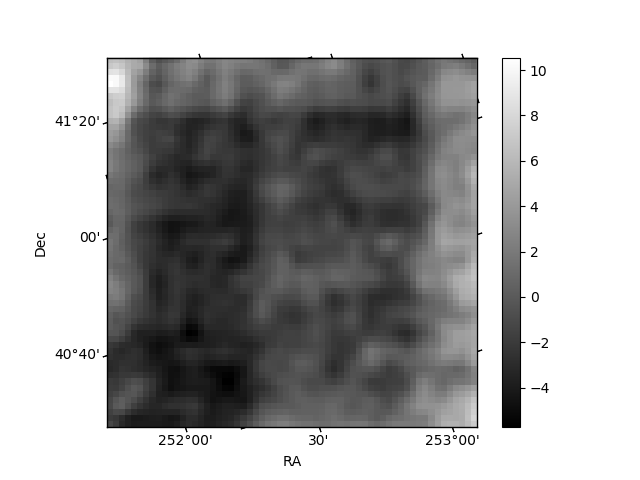
Histogram calculated using DETX and DETY for each event in the final _common_clean file
| Quadrant A | 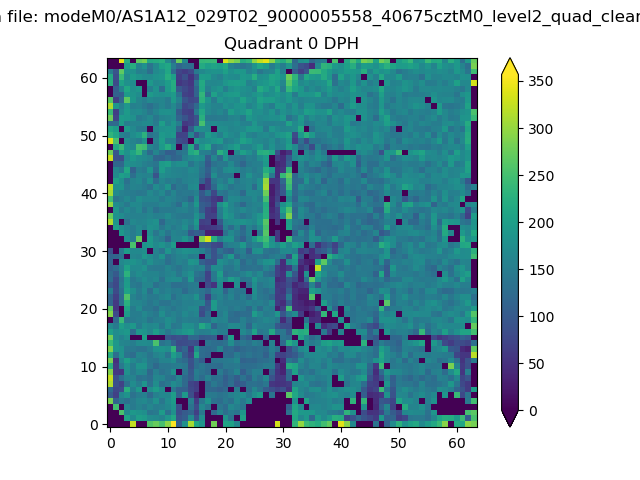 |
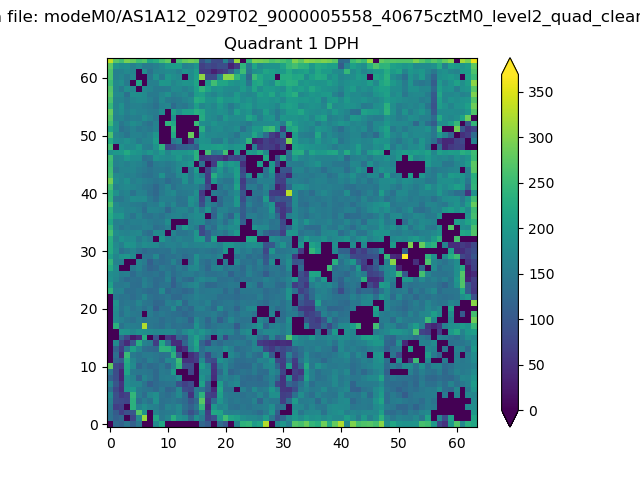 |
Quadrant B |
|---|---|---|---|
| Quadrant D | 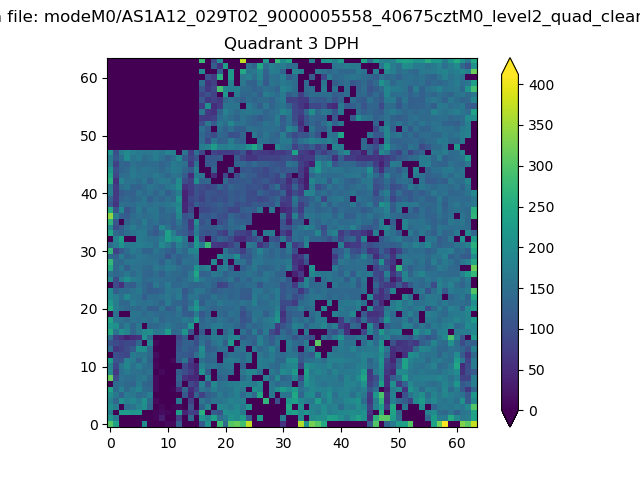 |
 |
Quadrant C |
| Plot type | Count rate plots | Images |
|---|---|---|
| Comparison with Poisson distribution Blue bars denote a histogram of data divided into 1 sec bins. Red curve is a Poisson curve with rate = median count rate of data. |
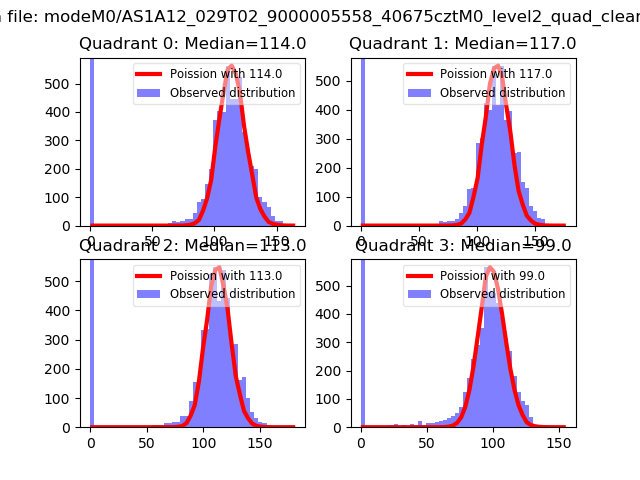 |
 |
| Quadrant-wise count rates Data is divided into 100 sec bins |
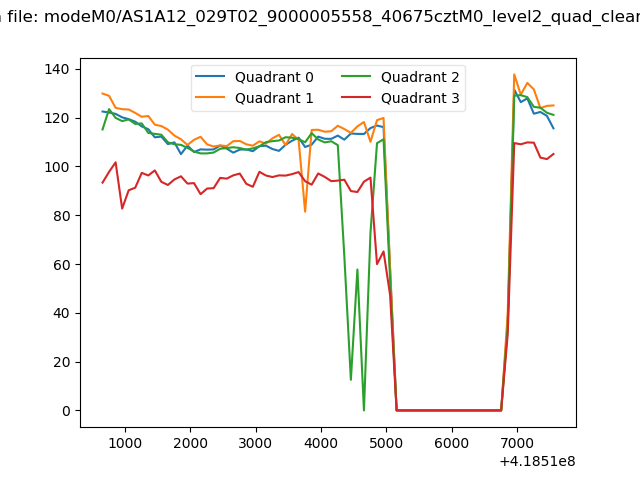 |
|
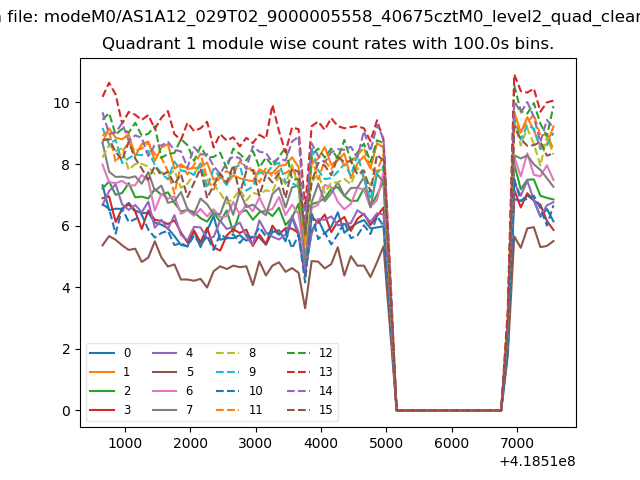
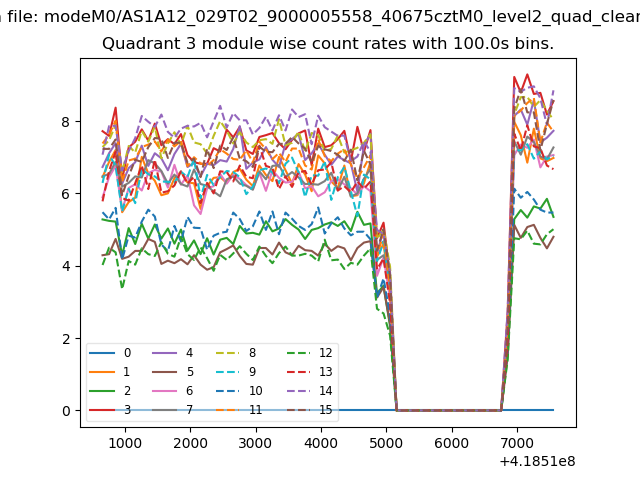
| Module-wise count rates for Quadrant A Data is divided into 100 sec bins |
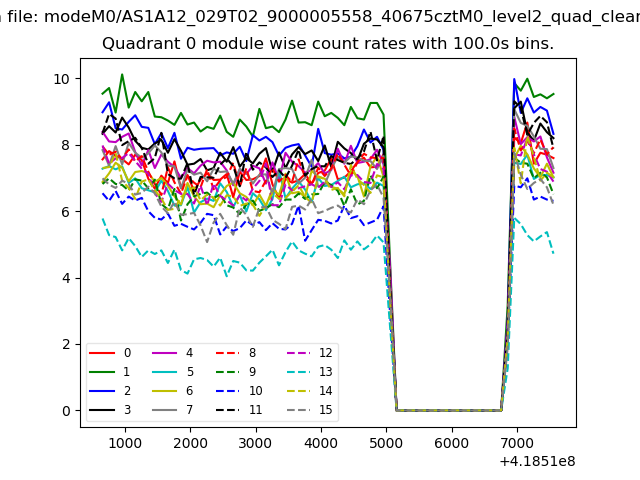 |
 |
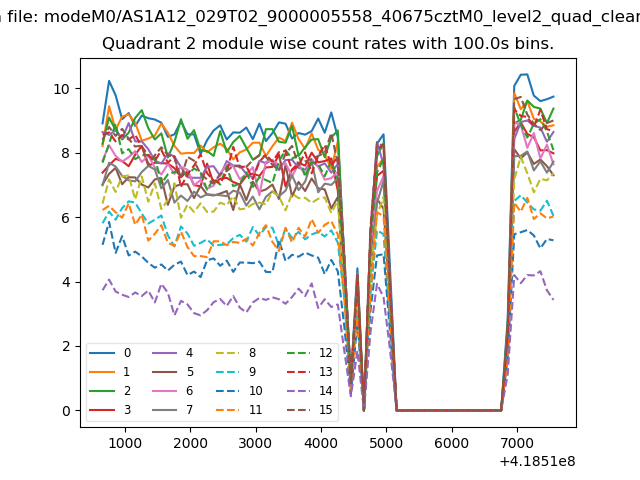
| Module-wise count rates for Quadrant B Data is divided into 100 sec bins |
 |
 |
| Module-wise count rates for Quadrant C Data is divided into 100 sec bins |
 |
 |
| Module-wise count rates for Quadrant D Data is divided into 100 sec bins |
 |
 |
| Parameter | Plot |
|---|---|
| CZT HV Monitor | 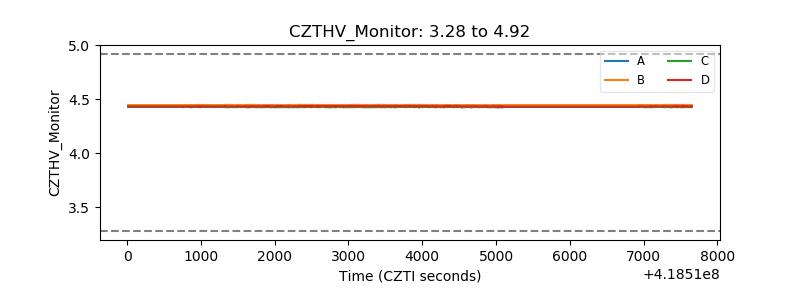 |
| D_VDD | 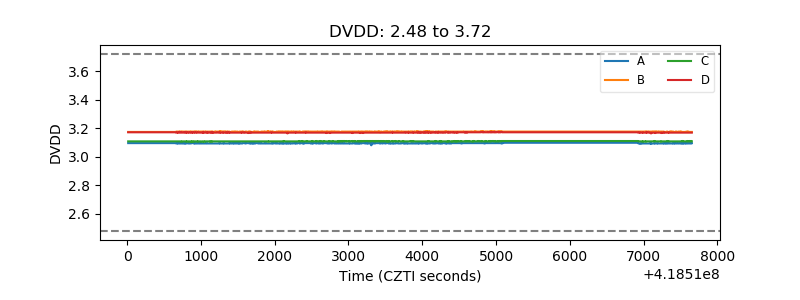 |
| Temperature 1 | 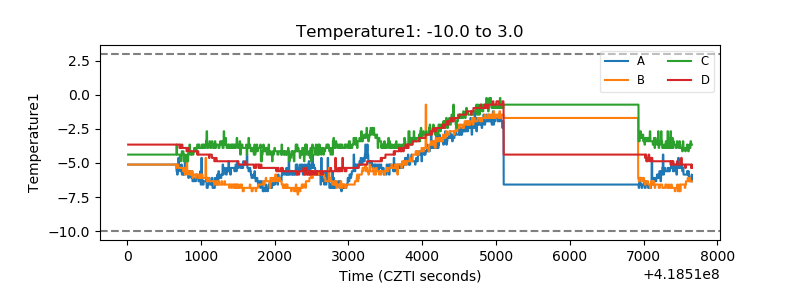 |
| Veto HV Monitor | 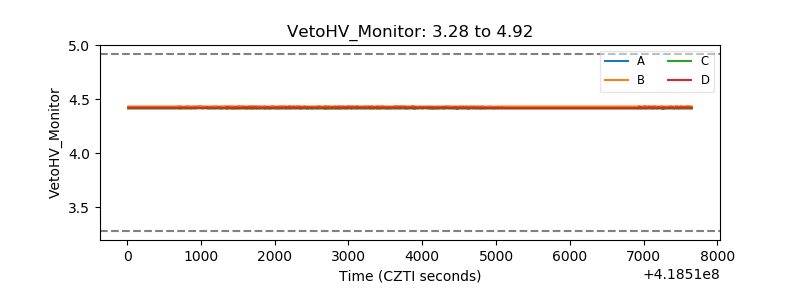 |
| Veto LLD | 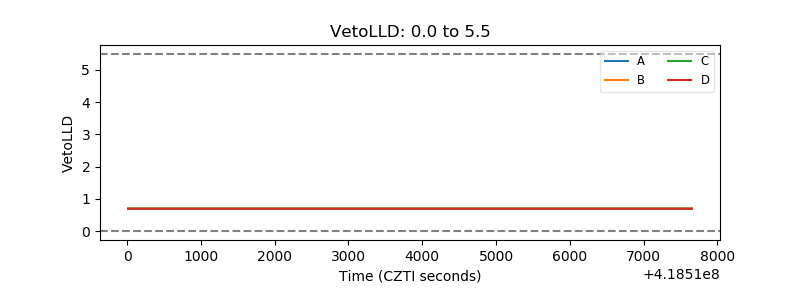 |
| Alpha Counter | 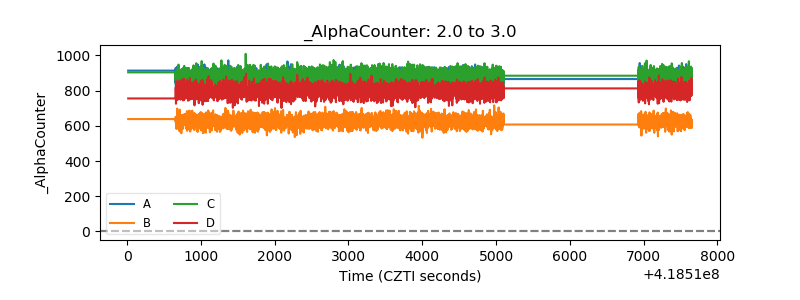 |
| _CPM_Rate | 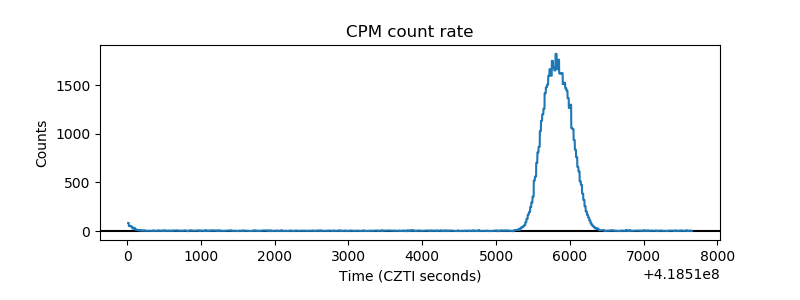 |
| CZT Counter | 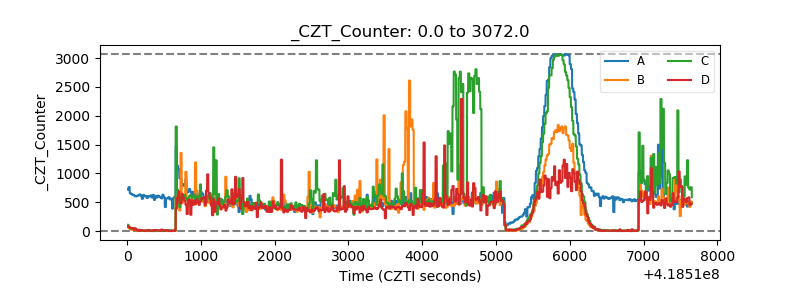 |
| +2.5 Volts monitor | 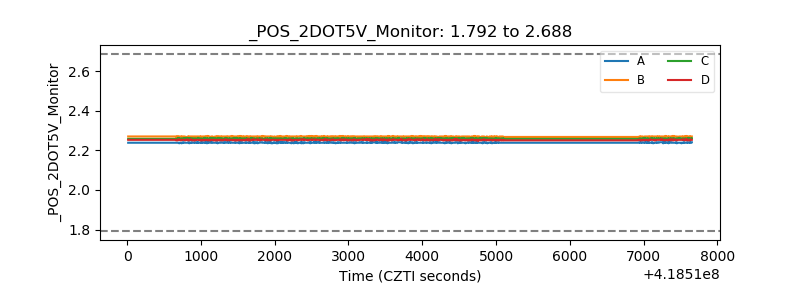 |
| +5 Volts monitor | 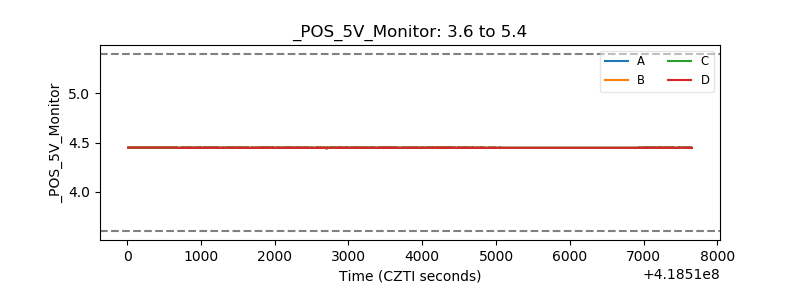 |
| _ROLL_ROT | 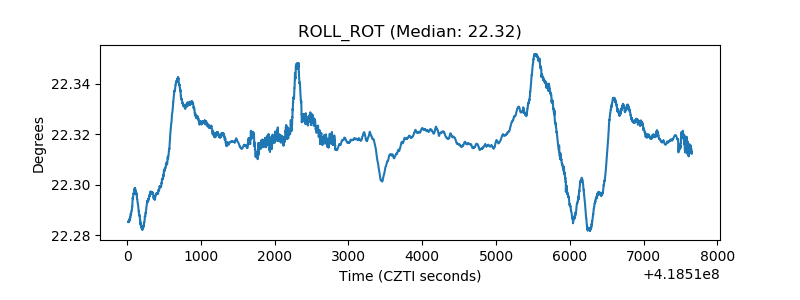 |
| _Roll_DEC | 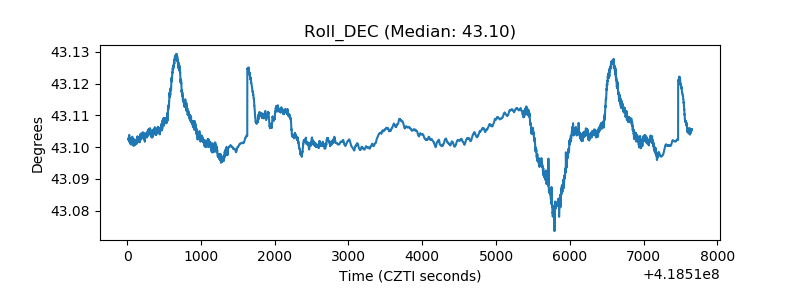 |
| _Roll_RA | 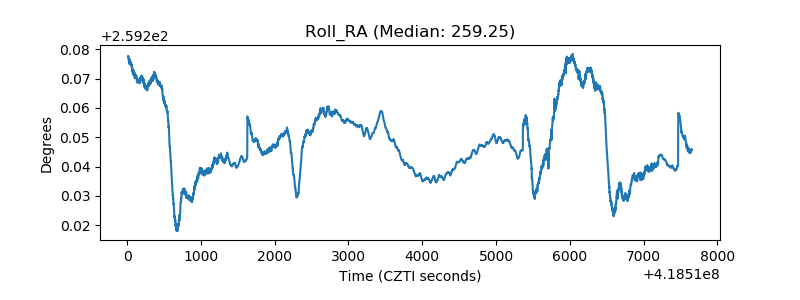 |
| Veto Counter | 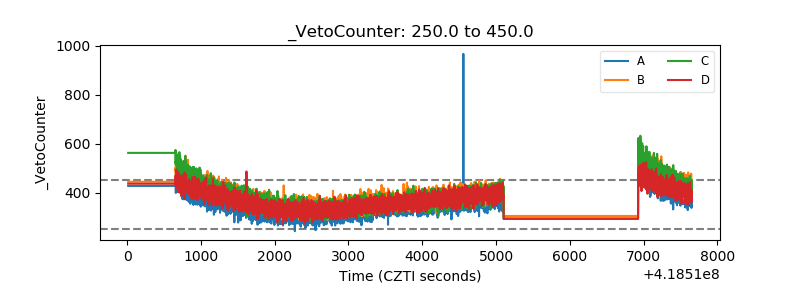 |