| Param | Original file | Final file |
|---|---|---|
| Filename | modeM0/AS1A12_029T02_9000005558_40676cztM0_level2.fits | modeM0/AS1A12_029T02_9000005558_40676cztM0_level2_quad_clean.evt |
| Size (bytes) | 367,421,760 | 88,951,680 |
| Size | 350.4 MB | 84.8 MB |
| Events in quadrant A | 4,048,568 | 582,270 |
| Events in quadrant B | 2,865,422 | 631,014 |
| Events in quadrant C | 3,812,690 | 596,877 |
| Events in quadrant D | 2,469,606 | 519,257 |
| Mode M0 | |||
|---|---|---|---|
| Quadrant | BADHDUFLAG | Total packets | Discarded packets |
| A | 0 | 15413 | 3 |
| B | 0 | 11895 | 2 |
| C | 0 | 14717 | 2 |
| D | 0 | 11010 | 2 |
| Mode M9 | |||
|---|---|---|---|
| Quadrant | BADHDUFLAG | Total packets | Discarded packets |
| A | 0 | 29 | 0 |
| B | 0 | 29 | 0 |
| C | 0 | 29 | 0 |
| D | 0 | 30 | 0 |
| Mode SS | |||
|---|---|---|---|
| Quadrant | BADHDUFLAG | Total packets | Discarded packets |
| A | 0 | 106 | 0 |
| B | 0 | 106 | 0 |
| C | 0 | 106 | 0 |
| D | 0 | 106 | 0 |
| Quadrant | Total seconds | Saturated seconds | Saturation percentage |
|---|---|---|---|
| A | 5195 | 357 | 6.871992% |
| B | 5195 | 72 | 1.385948% |
| C | 5195 | 123 | 2.367661% |
| D | 5195 | 323 | 6.217517% |
Noise dominated data is calculated using 1-second bins in cleaned event files. If a bin has >2000 counts, and if more than 50% of those come from <1% of pixels, then it is considered to be noise-dominated and hence unusable.
| Quadrant | # 1 sec bins | Bins with >0 counts | Bins with >2000 counts | High rate bins dominated by noise | Noise dominated (total time) | Noise dominated (detector-on time) | Marked lightcurve |
|---|---|---|---|---|---|---|---|
| A | 7108 | 5196 | 303 | 303 | 4.26% | 5.83% | 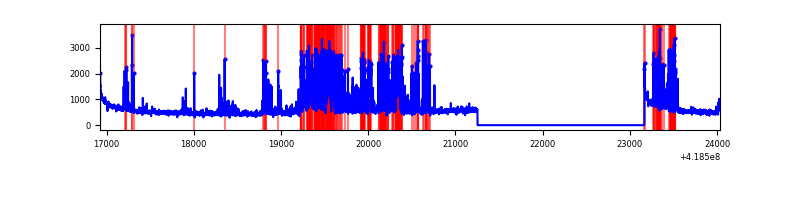 |
| B | 7108 | 5196 | 33 | 33 | 0.46% | 0.64% | 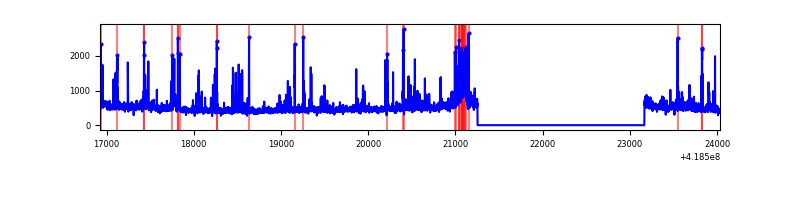 |
| C | 7108 | 5196 | 127 | 127 | 1.79% | 2.44% | 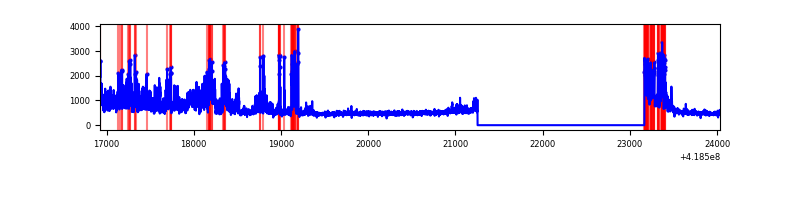 |
| D | 7108 | 5196 | 14 | 14 | 0.20% | 0.27% | 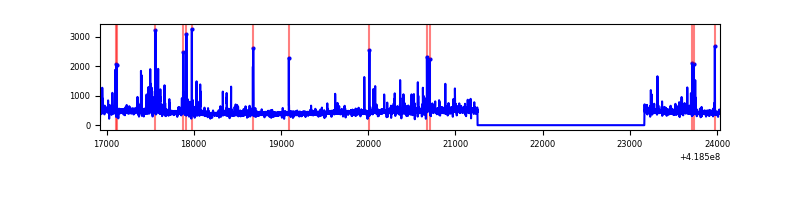 |
Top three noisy pixels from each quadrant. If the there are fewer than three noisy pixels in the level2.evt file, extra rows are filled as -1
| Pixel properties | Quadrant properties | ||||||
|---|---|---|---|---|---|---|---|
| Quadrant | DetID | PixID | Counts | Sigma | Mean | Median | Sigma |
| A | 13 | 248 | 974763 | 8474.62 | 565 | 557 | 115.0 |
| A | 10 | 83 | 469264 | 4077.29 | 565 | 557 | 115.0 |
| A | 6 | 10 | 410924 | 3569.79 | 565 | 557 | 115.0 |
| B | 0 | 229 | 339626 | 3073.77 | 579 | 566 | 110.3 |
| B | 5 | 255 | 72935 | 656.07 | 579 | 566 | 110.3 |
| B | 0 | 230 | 69708 | 626.81 | 579 | 566 | 110.3 |
| C | 9 | 187 | 1199558 | 9120.98 | 565 | 571 | 131.5 |
| C | 15 | 214 | 224731 | 1705.24 | 565 | 571 | 131.5 |
| C | 14 | 254 | 111137 | 841.1 | 565 | 571 | 131.5 |
| D | 2 | 250 | 141594 | 1062.51 | 540 | 525 | 132.8 |
| D | 12 | 191 | 136068 | 1020.89 | 540 | 525 | 132.8 |
| D | 5 | 51 | 32678 | 242.17 | 540 | 525 | 132.8 |
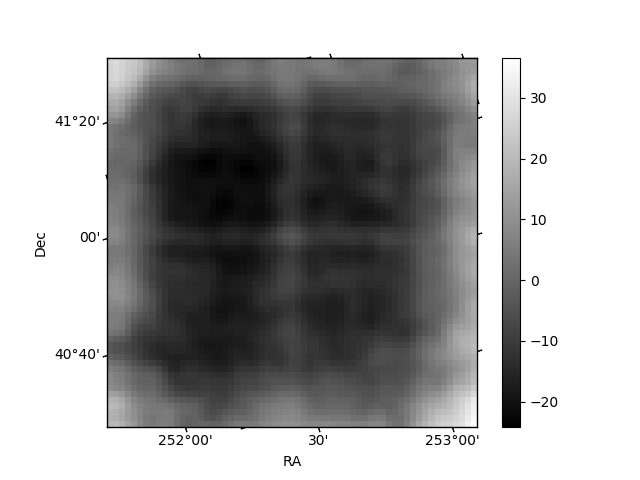
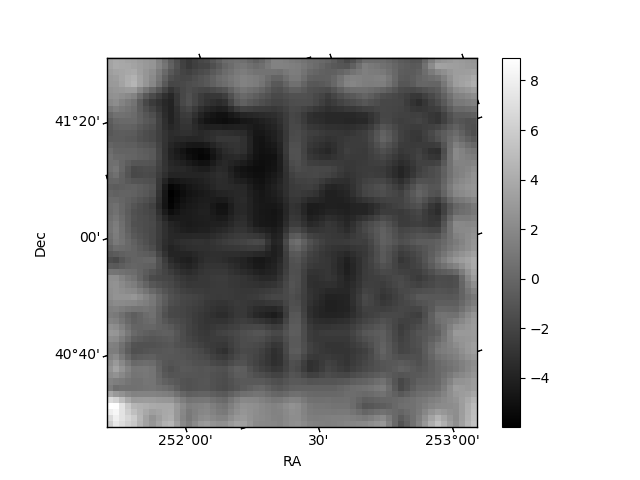
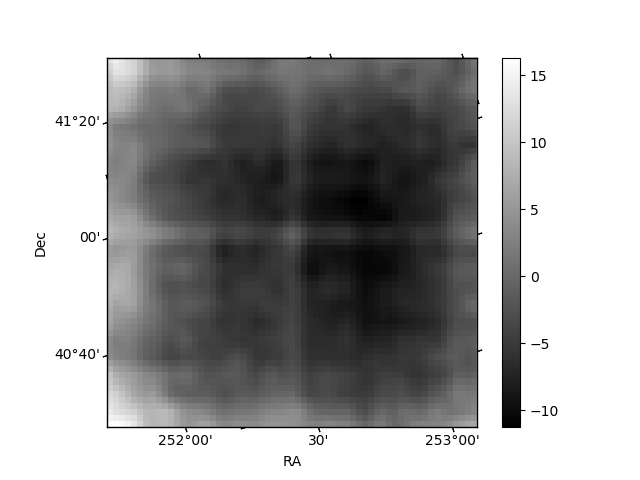
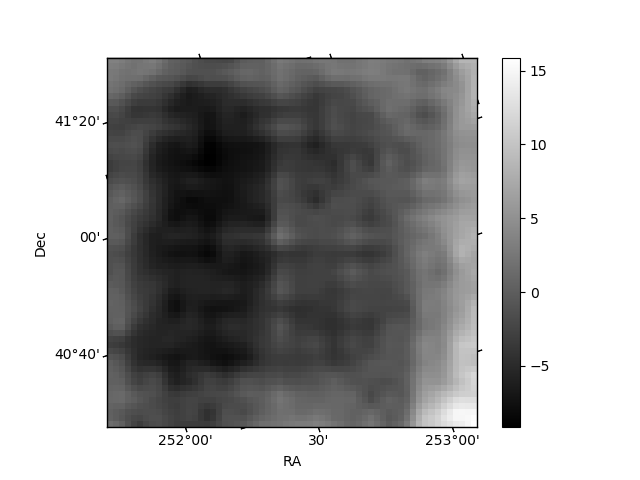
Histogram calculated using DETX and DETY for each event in the final _common_clean file
| Quadrant A | 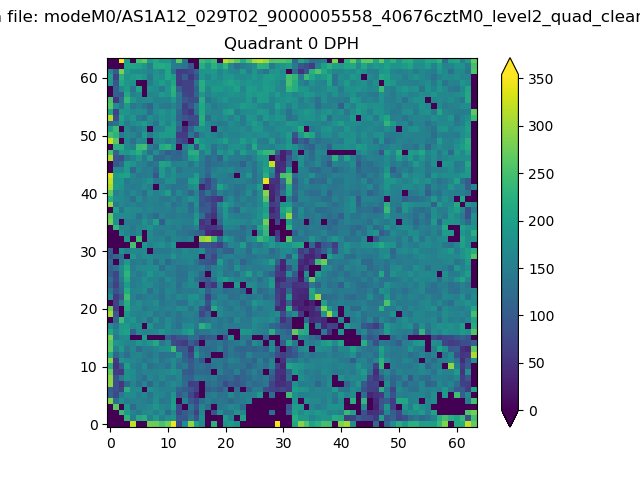 |
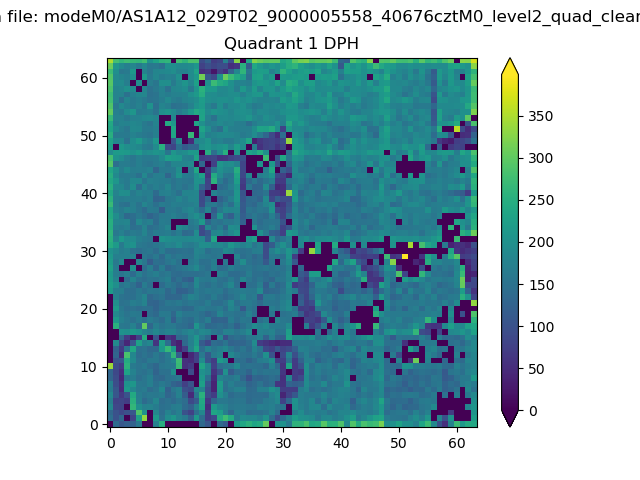 |
Quadrant B |
|---|---|---|---|
| Quadrant D | 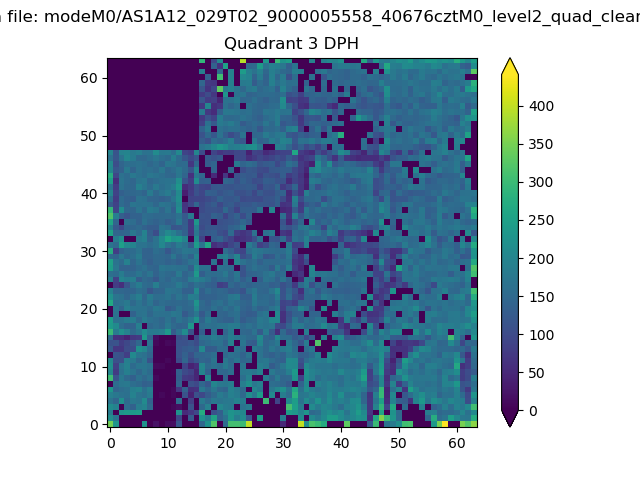 |
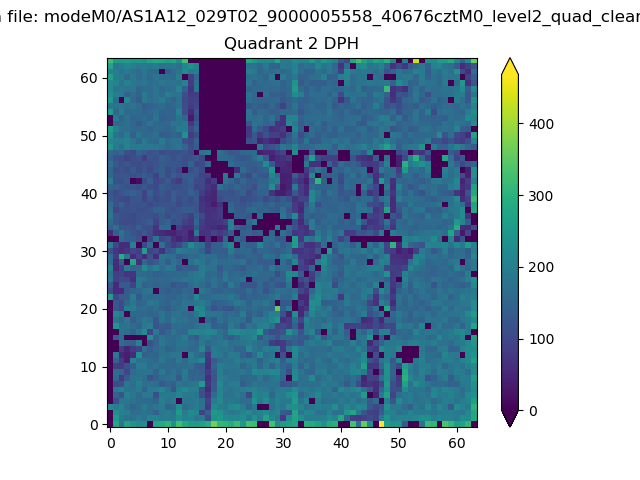 |
Quadrant C |
| Plot type | Count rate plots | Images |
|---|---|---|
| Comparison with Poisson distribution Blue bars denote a histogram of data divided into 1 sec bins. Red curve is a Poisson curve with rate = median count rate of data. |
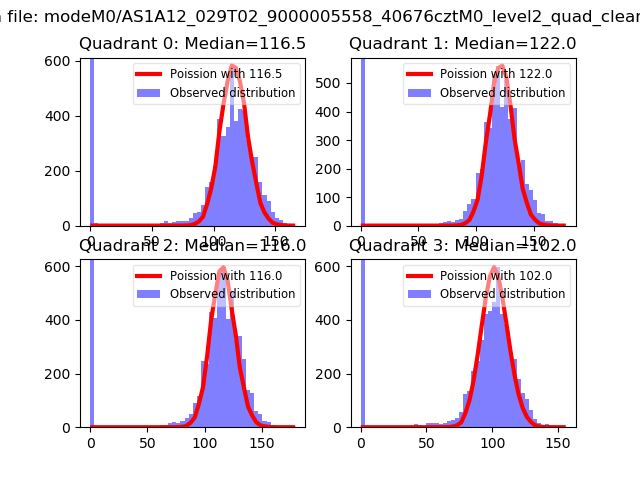 |
 |
| Quadrant-wise count rates Data is divided into 100 sec bins |
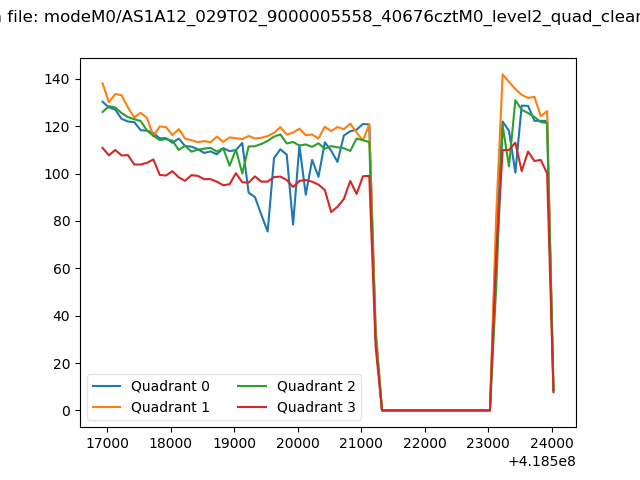 |
|
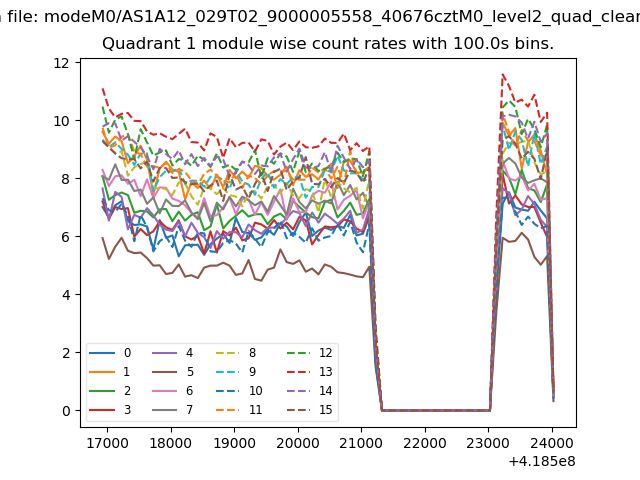
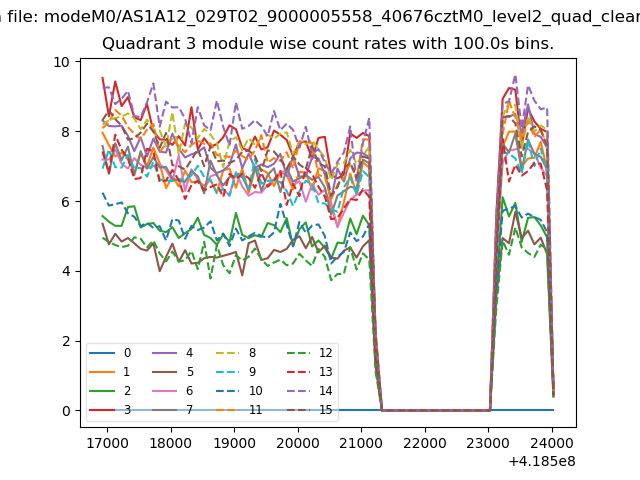
| Module-wise count rates for Quadrant A Data is divided into 100 sec bins |
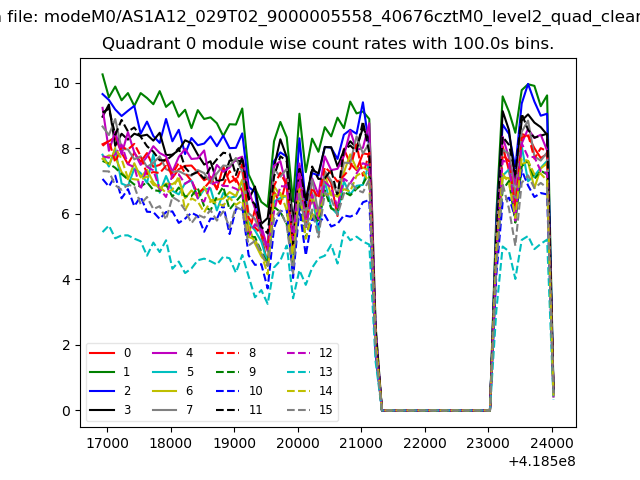 |
 |
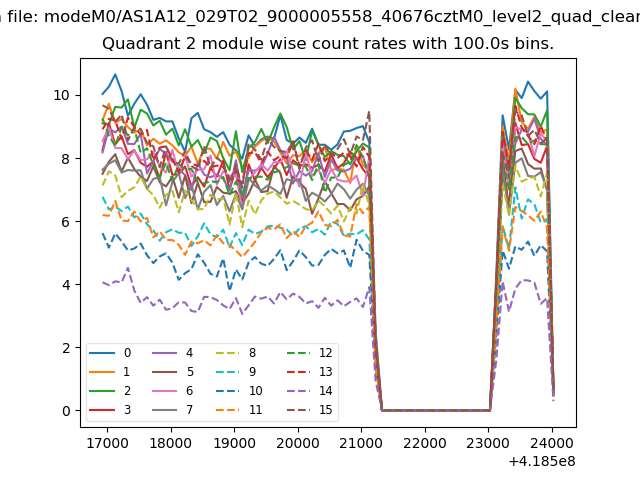
| Module-wise count rates for Quadrant B Data is divided into 100 sec bins |
 |
 |
| Module-wise count rates for Quadrant C Data is divided into 100 sec bins |
 |
 |
| Module-wise count rates for Quadrant D Data is divided into 100 sec bins |
 |
 |
| Parameter | Plot |
|---|---|
| CZT HV Monitor | 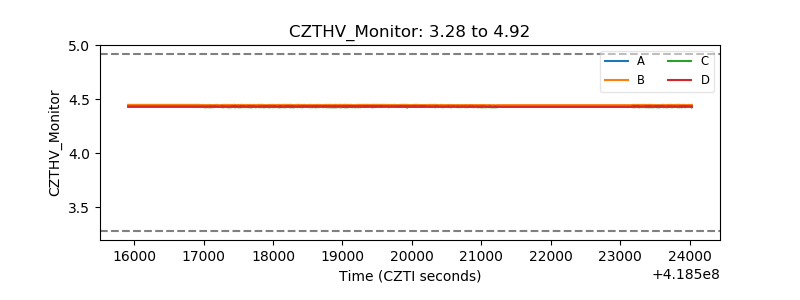 |
| D_VDD | 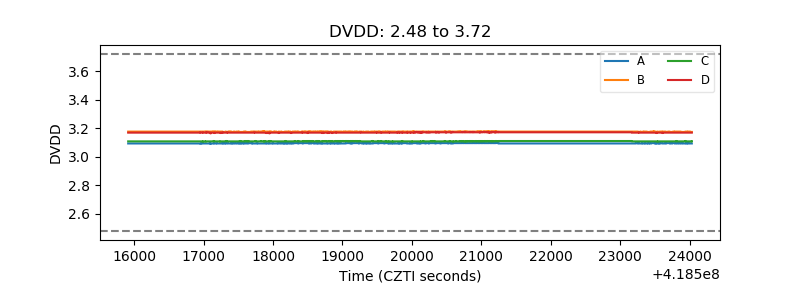 |
| Temperature 1 | 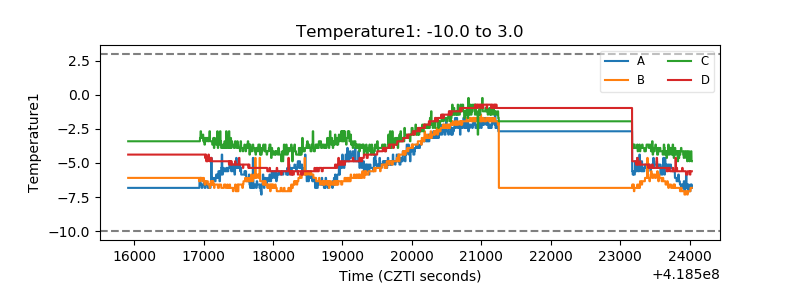 |
| Veto HV Monitor | 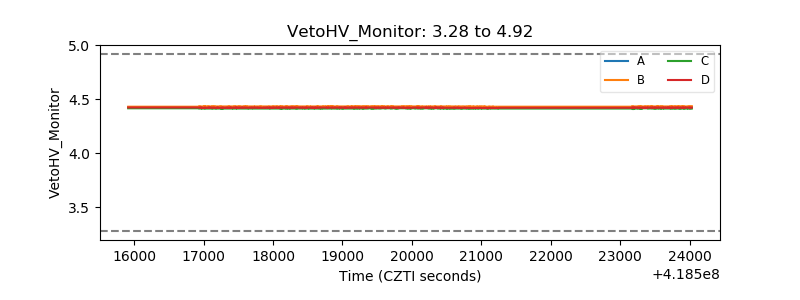 |
| Veto LLD | 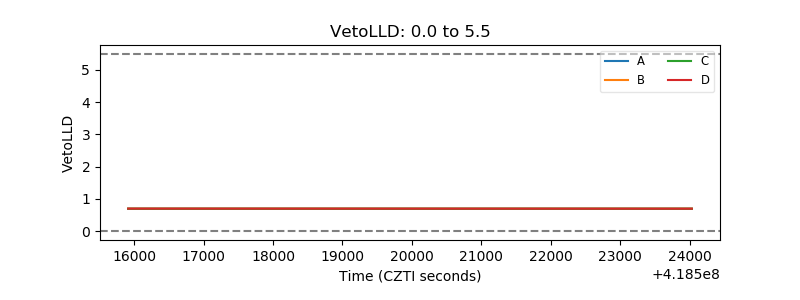 |
| Alpha Counter | 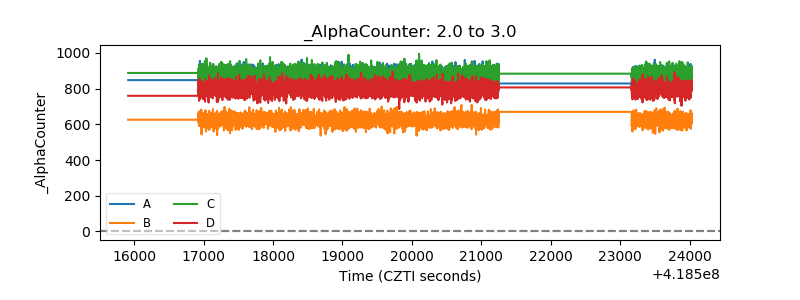 |
| _CPM_Rate | 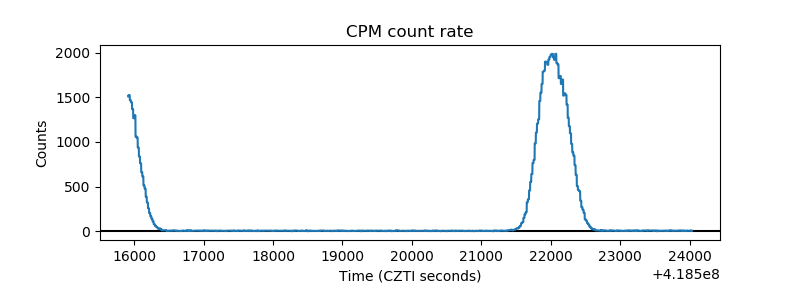 |
| CZT Counter | 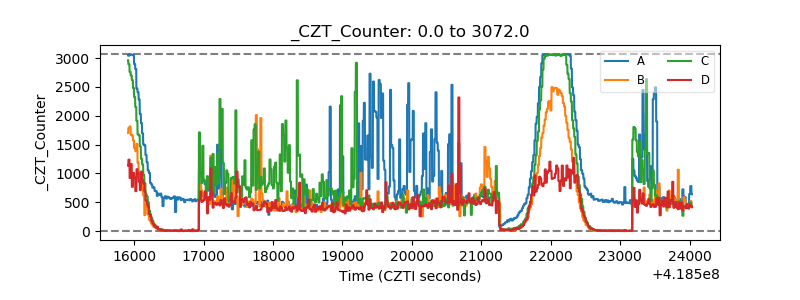 |
| +2.5 Volts monitor | 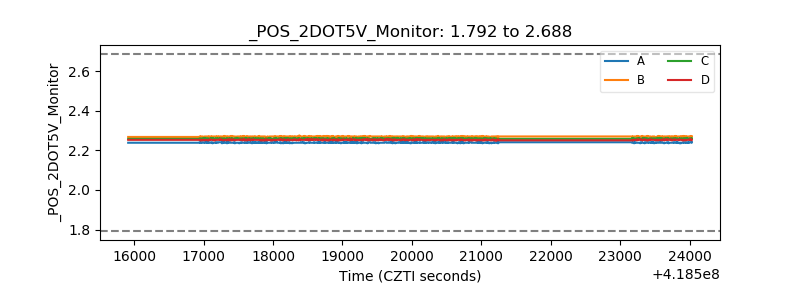 |
| +5 Volts monitor | 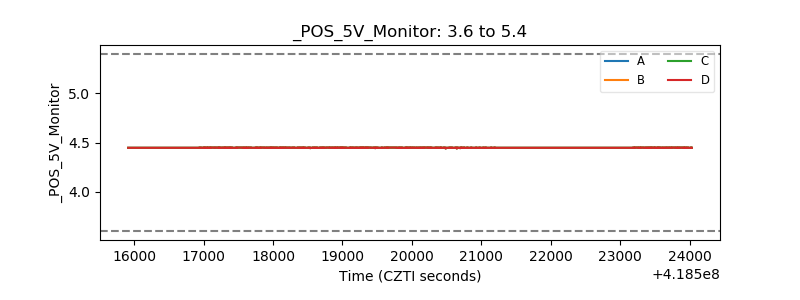 |
| _ROLL_ROT | 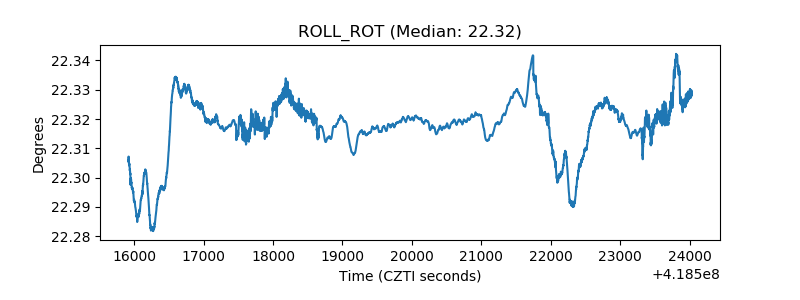 |
| _Roll_DEC | 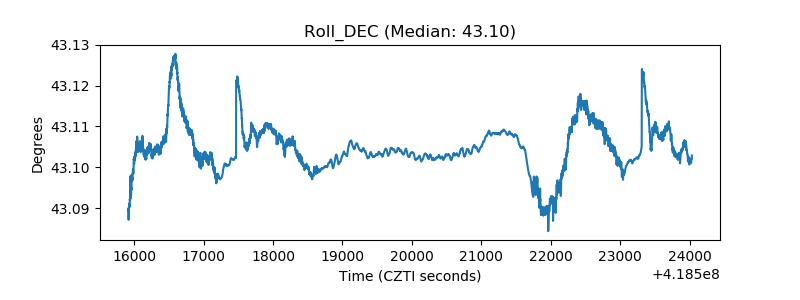 |
| _Roll_RA | 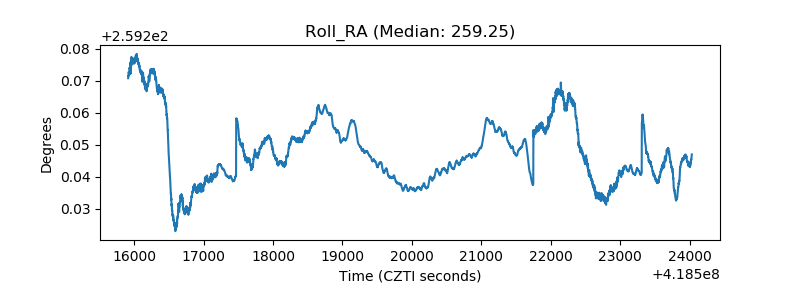 |
| Veto Counter | 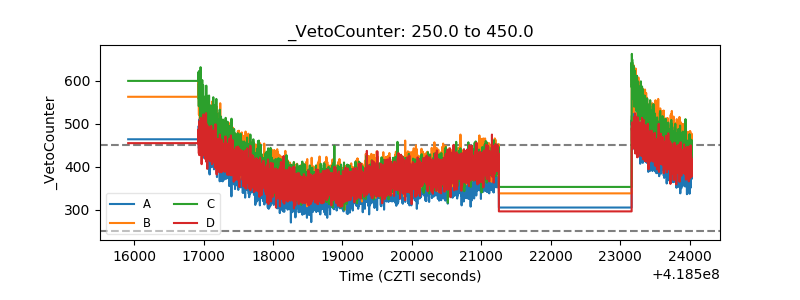 |