| Param | Original file | Final file |
|---|---|---|
| Filename | modeM0/AS1A12_029T02_9000005558_40677cztM0_level2.fits | modeM0/AS1A12_029T02_9000005558_40677cztM0_level2_quad_clean.evt |
| Size (bytes) | 325,687,680 | 87,520,320 |
| Size | 310.6 MB | 83.5 MB |
| Events in quadrant A | 3,011,048 | 597,524 |
| Events in quadrant B | 2,997,040 | 610,667 |
| Events in quadrant C | 3,204,385 | 589,457 |
| Events in quadrant D | 2,451,466 | 500,214 |
| Mode M0 | |||
|---|---|---|---|
| Quadrant | BADHDUFLAG | Total packets | Discarded packets |
| A | 0 | 12051 | 3 |
| B | 0 | 12236 | 2 |
| C | 0 | 12653 | 2 |
| D | 0 | 10818 | 2 |
| Mode M9 | |||
|---|---|---|---|
| Quadrant | BADHDUFLAG | Total packets | Discarded packets |
| A | 0 | 35 | 0 |
| B | 0 | 35 | 0 |
| C | 0 | 35 | 0 |
| D | 0 | 36 | 0 |
| Mode SS | |||
|---|---|---|---|
| Quadrant | BADHDUFLAG | Total packets | Discarded packets |
| A | 0 | 102 | 0 |
| B | 0 | 102 | 0 |
| C | 0 | 102 | 0 |
| D | 0 | 102 | 0 |
| Quadrant | Total seconds | Saturated seconds | Saturation percentage |
|---|---|---|---|
| A | 5024 | 71 | 1.413217% |
| B | 5024 | 172 | 3.423567% |
| C | 5024 | 97 | 1.930732% |
| D | 5024 | 407 | 8.101115% |
Noise dominated data is calculated using 1-second bins in cleaned event files. If a bin has >2000 counts, and if more than 50% of those come from <1% of pixels, then it is considered to be noise-dominated and hence unusable.
| Quadrant | # 1 sec bins | Bins with >0 counts | Bins with >2000 counts | High rate bins dominated by noise | Noise dominated (total time) | Noise dominated (detector-on time) | Marked lightcurve |
|---|---|---|---|---|---|---|---|
| A | 7058 | 5025 | 56 | 56 | 0.79% | 1.11% | 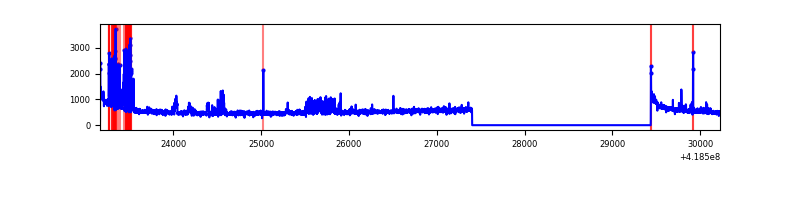 |
| B | 7058 | 5025 | 117 | 117 | 1.66% | 2.33% | 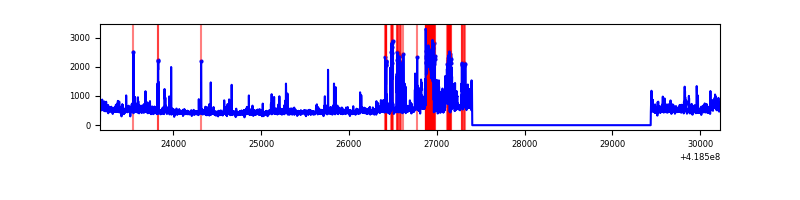 |
| C | 7058 | 5025 | 94 | 94 | 1.33% | 1.87% | 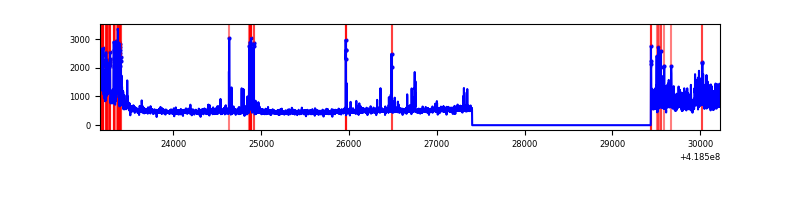 |
| D | 7058 | 5024 | 29 | 29 | 0.41% | 0.58% | 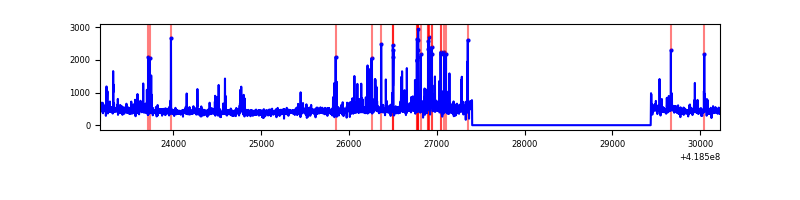 |
Top three noisy pixels from each quadrant. If the there are fewer than three noisy pixels in the level2.evt file, extra rows are filled as -1
| Pixel properties | Quadrant properties | ||||||
|---|---|---|---|---|---|---|---|
| Quadrant | DetID | PixID | Counts | Sigma | Mean | Median | Sigma |
| A | 10 | 83 | 459691 | 3961.36 | 565 | 554 | 115.9 |
| A | 13 | 248 | 214493 | 1845.83 | 565 | 554 | 115.9 |
| A | 6 | 10 | 129146 | 1109.47 | 565 | 554 | 115.9 |
| B | 5 | 255 | 359998 | 3333.09 | 564 | 549 | 107.8 |
| B | 0 | 229 | 265799 | 2459.6 | 564 | 549 | 107.8 |
| B | 0 | 230 | 78524 | 723.04 | 564 | 549 | 107.8 |
| C | 9 | 187 | 689029 | 5360.95 | 553 | 556 | 128.4 |
| C | 15 | 214 | 218950 | 1700.57 | 553 | 556 | 128.4 |
| C | 14 | 254 | 76259 | 589.48 | 553 | 556 | 128.4 |
| D | 12 | 191 | 140859 | 1098.69 | 521 | 505 | 127.7 |
| D | 2 | 250 | 87952 | 684.54 | 521 | 505 | 127.7 |
| D | 2 | 153 | 55388 | 429.63 | 521 | 505 | 127.7 |
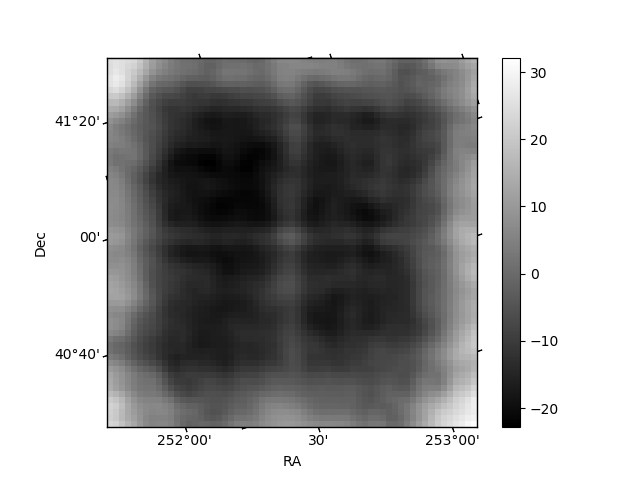
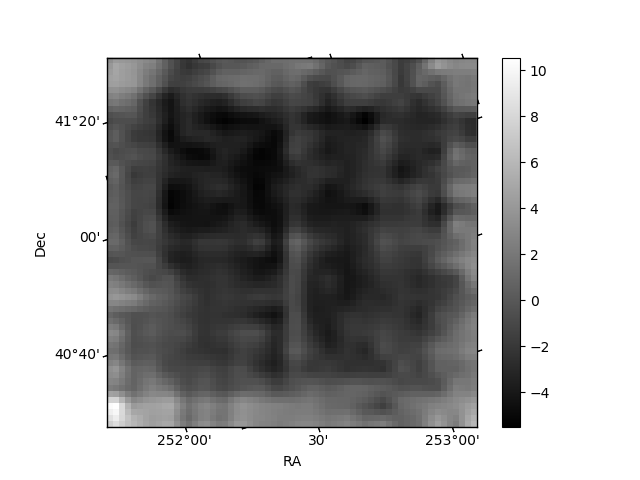
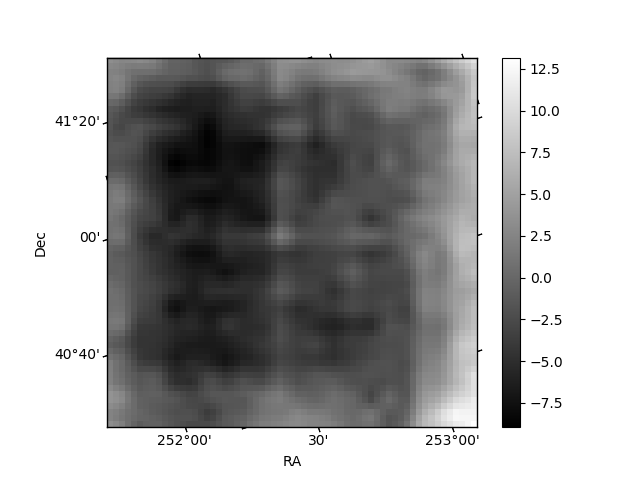
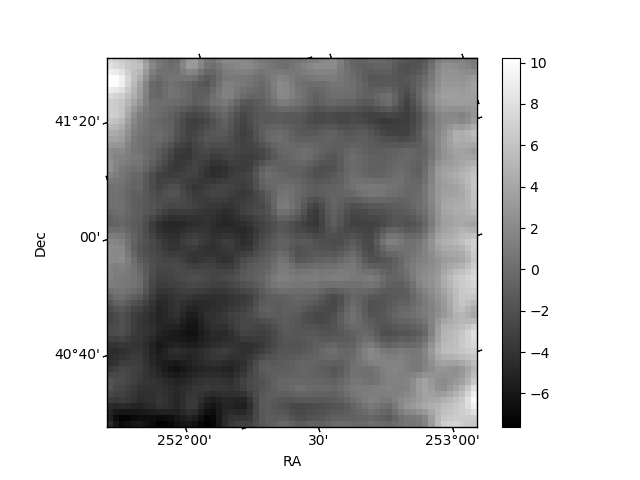
Histogram calculated using DETX and DETY for each event in the final _common_clean file
| Quadrant A | 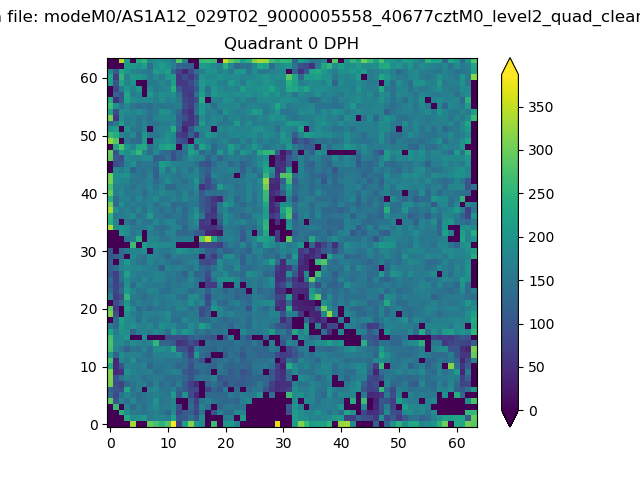 |
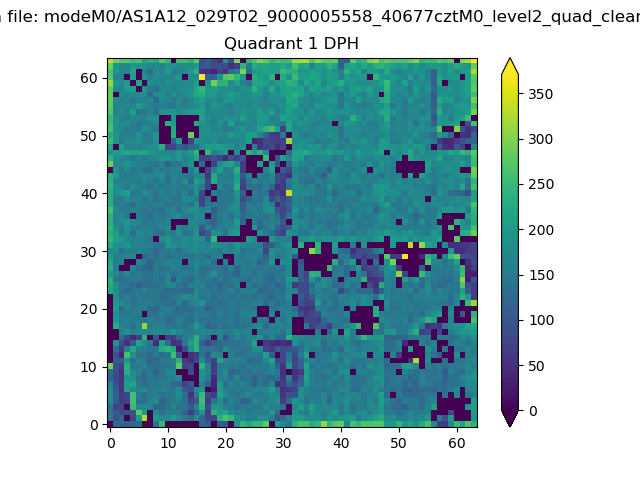 |
Quadrant B |
|---|---|---|---|
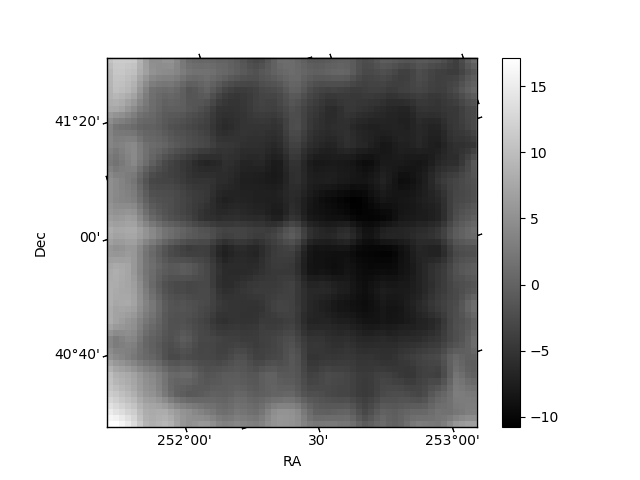
| Quadrant D | 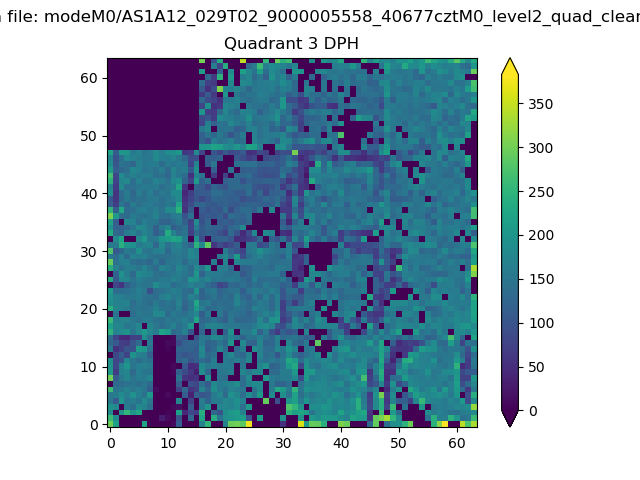 |
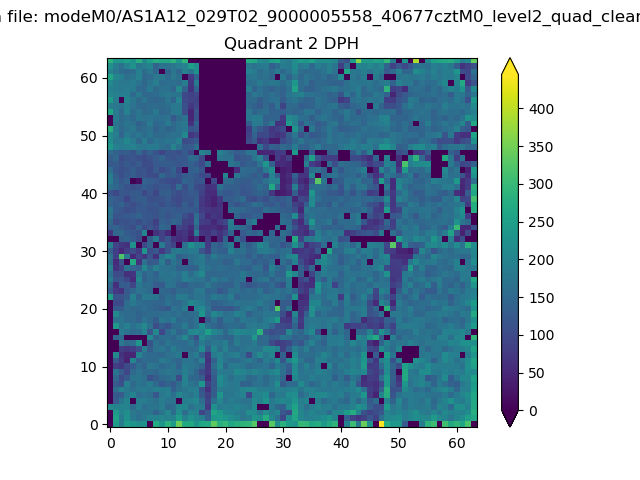 |
Quadrant C |
| Plot type | Count rate plots | Images |
|---|---|---|
| Comparison with Poisson distribution Blue bars denote a histogram of data divided into 1 sec bins. Red curve is a Poisson curve with rate = median count rate of data. |
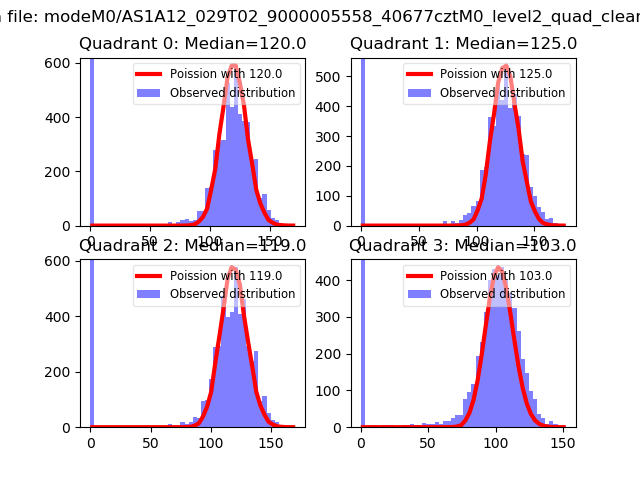 |
 |
| Quadrant-wise count rates Data is divided into 100 sec bins |
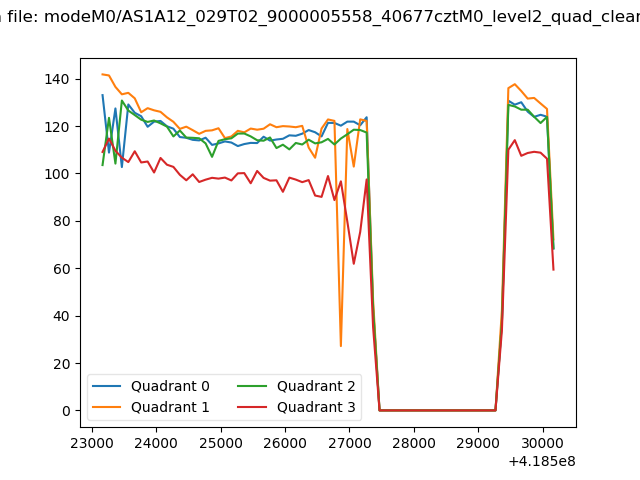 |
|
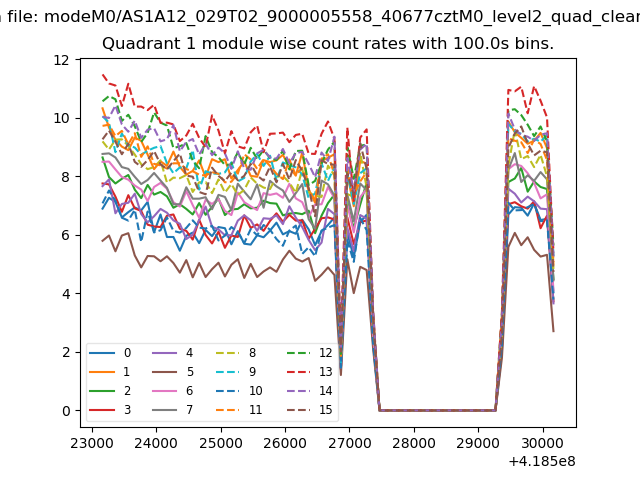
| Module-wise count rates for Quadrant A Data is divided into 100 sec bins |
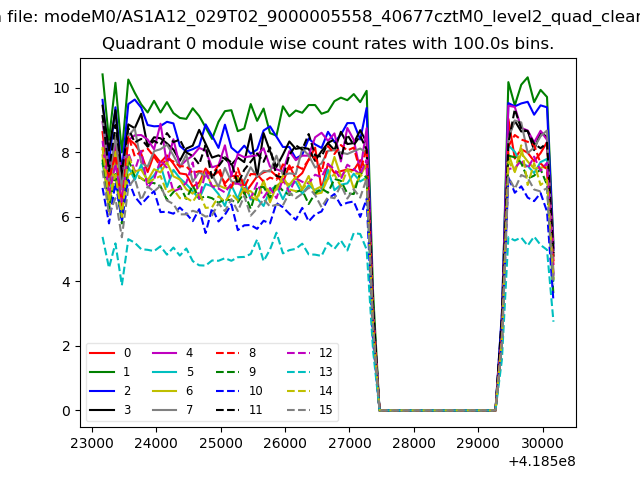 |
 |
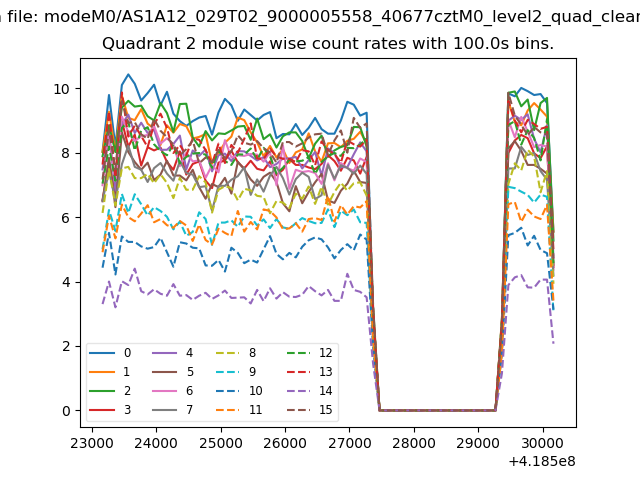
| Module-wise count rates for Quadrant B Data is divided into 100 sec bins |
 |
 |
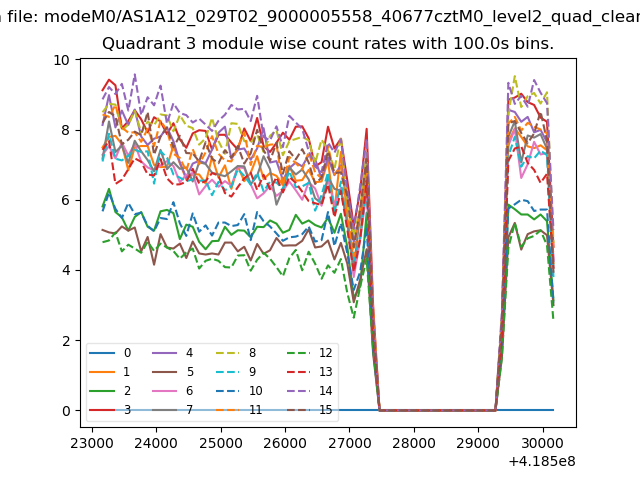
| Module-wise count rates for Quadrant C Data is divided into 100 sec bins |
 |
 |
| Module-wise count rates for Quadrant D Data is divided into 100 sec bins |
 |
 |
| Parameter | Plot |
|---|---|
| CZT HV Monitor | 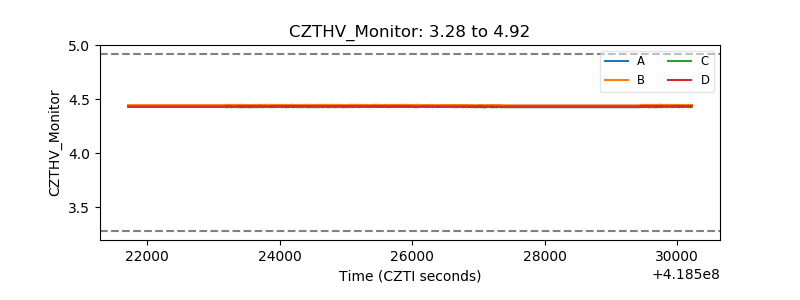 |
| D_VDD | 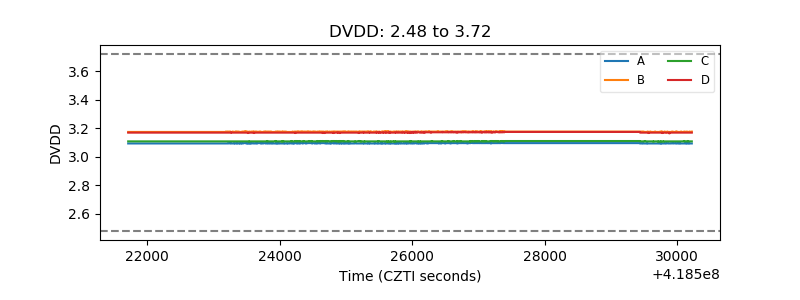 |
| Temperature 1 | 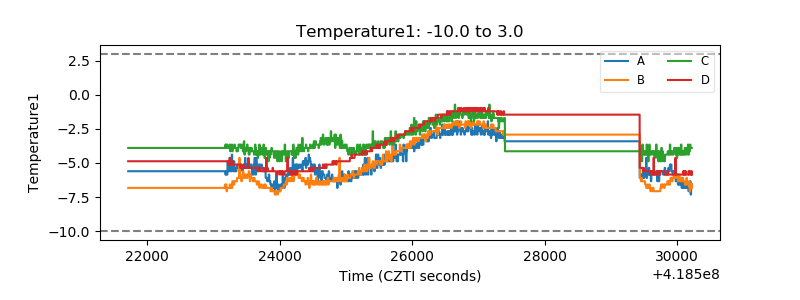 |
| Veto HV Monitor | 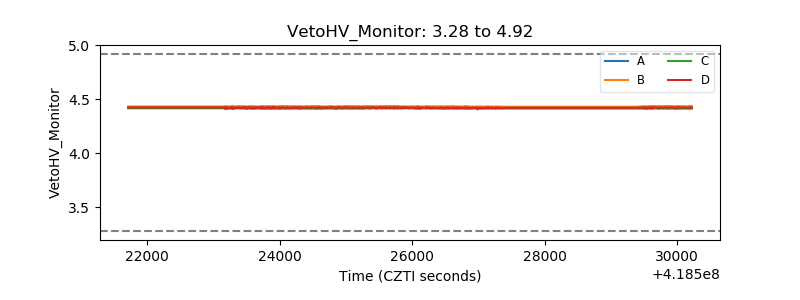 |
| Veto LLD | 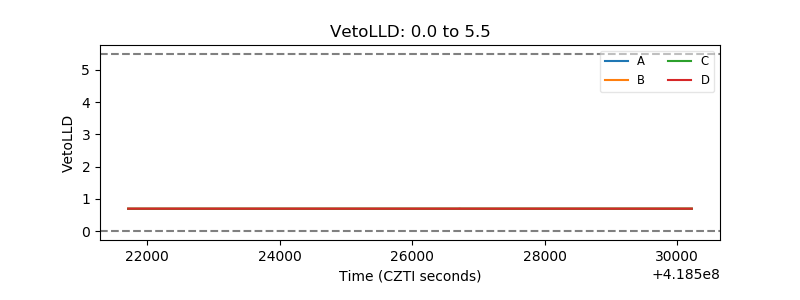 |
| Alpha Counter | 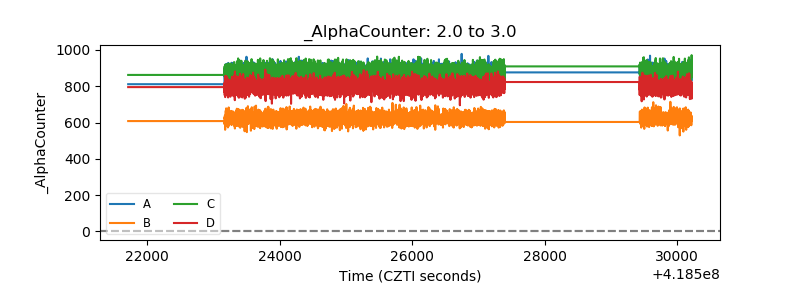 |
| _CPM_Rate | 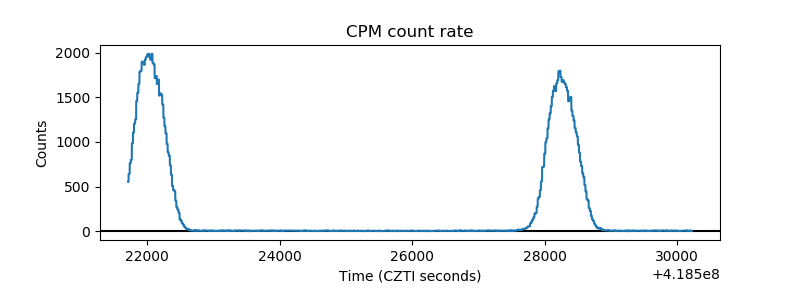 |
| CZT Counter | 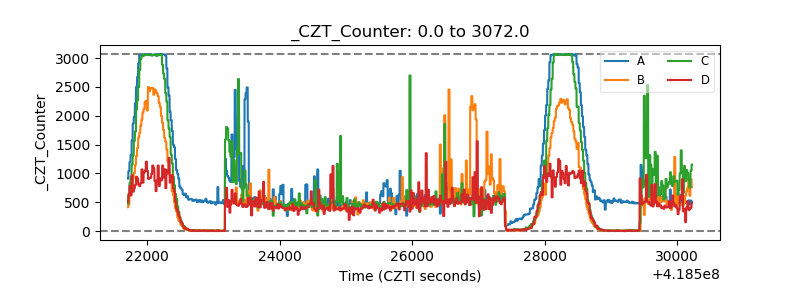 |
| +2.5 Volts monitor | 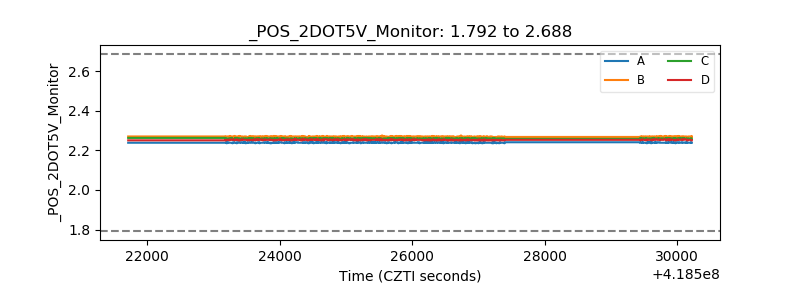 |
| +5 Volts monitor |  |
| _ROLL_ROT | 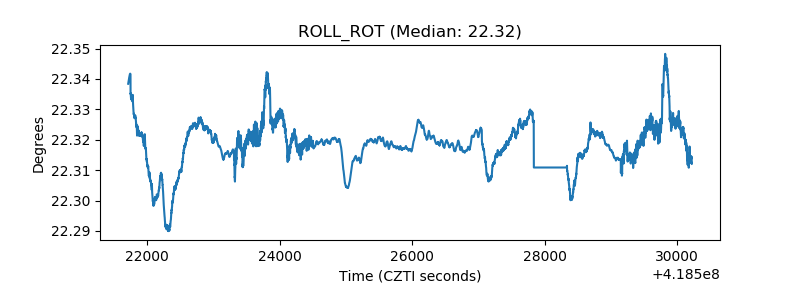 |
| _Roll_DEC | 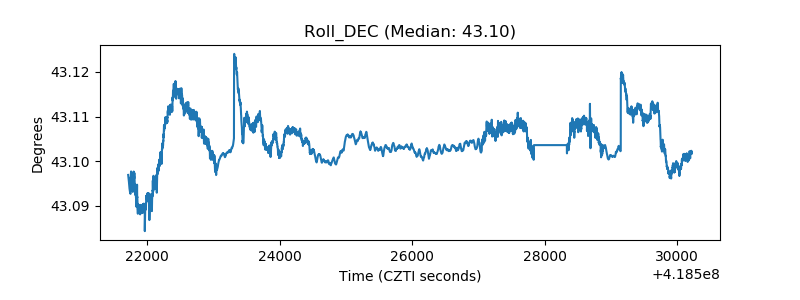 |
| _Roll_RA | 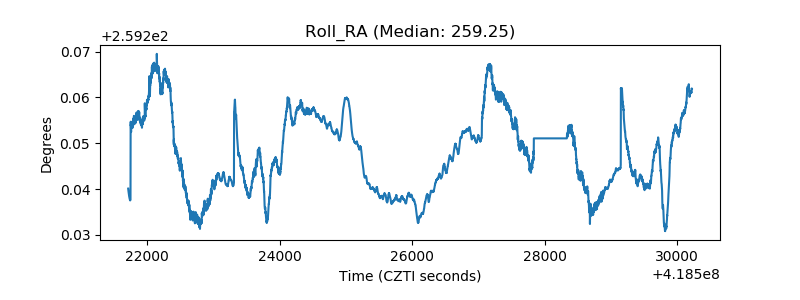 |
| Veto Counter | 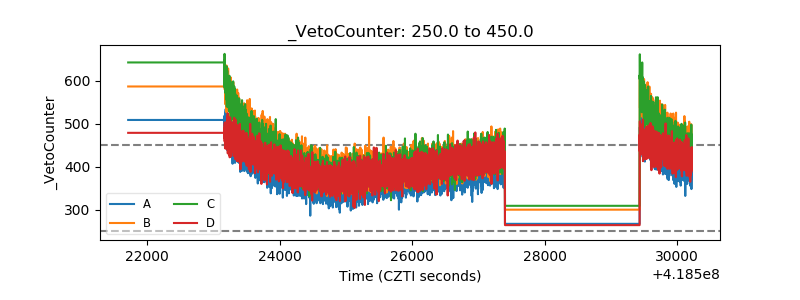 |