| Param | Original file | Final file |
|---|---|---|
| Filename | modeM0/AS1A12_029T02_9000005558_40678cztM0_level2.fits | modeM0/AS1A12_029T02_9000005558_40678cztM0_level2_quad_clean.evt |
| Size (bytes) | 348,894,720 | 84,513,600 |
| Size | 332.7 MB | 80.6 MB |
| Events in quadrant A | 2,661,485 | 583,878 |
| Events in quadrant B | 2,870,830 | 607,051 |
| Events in quadrant C | 4,107,944 | 549,690 |
| Events in quadrant D | 2,893,053 | 474,940 |
| Mode M0 | |||
|---|---|---|---|
| Quadrant | BADHDUFLAG | Total packets | Discarded packets |
| A | 0 | 10841 | 3 |
| B | 0 | 11620 | 2 |
| C | 0 | 15481 | 2 |
| D | 0 | 12071 | 2 |
| Mode M9 | |||
|---|---|---|---|
| Quadrant | BADHDUFLAG | Total packets | Discarded packets |
| A | 0 | 31 | 0 |
| B | 0 | 31 | 0 |
| C | 0 | 31 | 0 |
| D | 0 | 32 | 0 |
| Mode SS | |||
|---|---|---|---|
| Quadrant | BADHDUFLAG | Total packets | Discarded packets |
| A | 0 | 100 | 0 |
| B | 0 | 100 | 0 |
| C | 0 | 100 | 0 |
| D | 0 | 100 | 0 |
| Quadrant | Total seconds | Saturated seconds | Saturation percentage |
|---|---|---|---|
| A | 4898 | 13 | 0.265414% |
| B | 4898 | 45 | 0.918742% |
| C | 4898 | 274 | 5.594120% |
| D | 4898 | 505 | 10.310331% |
Noise dominated data is calculated using 1-second bins in cleaned event files. If a bin has >2000 counts, and if more than 50% of those come from <1% of pixels, then it is considered to be noise-dominated and hence unusable.
| Quadrant | # 1 sec bins | Bins with >0 counts | Bins with >2000 counts | High rate bins dominated by noise | Noise dominated (total time) | Noise dominated (detector-on time) | Marked lightcurve |
|---|---|---|---|---|---|---|---|
| A | 7020 | 4899 | 6 | 6 | 0.09% | 0.12% | 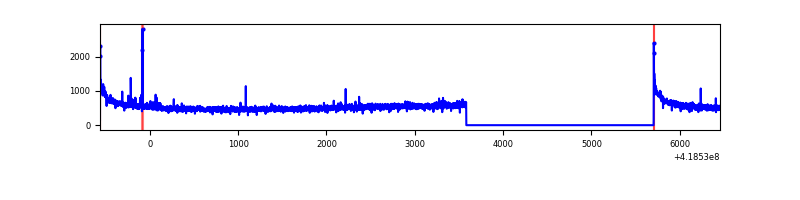 |
| B | 7020 | 4899 | 32 | 32 | 0.46% | 0.65% | 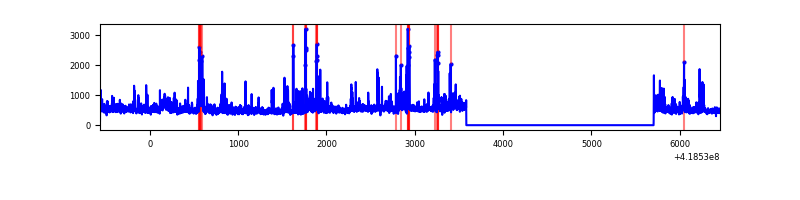 |
| C | 7020 | 4899 | 281 | 281 | 4.00% | 5.74% | 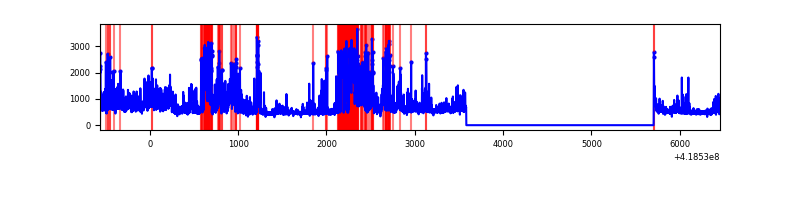 |
| D | 7020 | 4899 | 107 | 107 | 1.52% | 2.18% | 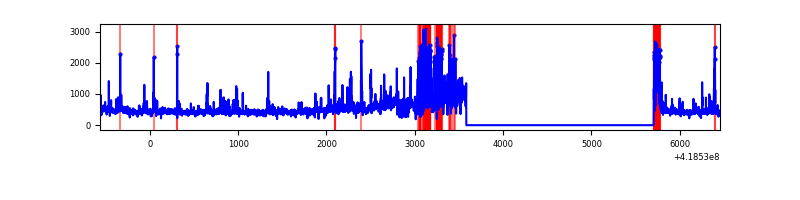 |
Top three noisy pixels from each quadrant. If the there are fewer than three noisy pixels in the level2.evt file, extra rows are filled as -1
| Pixel properties | Quadrant properties | ||||||
|---|---|---|---|---|---|---|---|
| Quadrant | DetID | PixID | Counts | Sigma | Mean | Median | Sigma |
| A | 10 | 83 | 464140 | 4071.89 | 557 | 547 | 113.9 |
| A | 13 | 248 | 21253 | 181.87 | 557 | 547 | 113.9 |
| A | 12 | 189 | 20463 | 174.93 | 557 | 547 | 113.9 |
| B | 0 | 229 | 353024 | 3304.58 | 554 | 539 | 106.7 |
| B | 0 | 230 | 171727 | 1604.9 | 554 | 539 | 106.7 |
| B | 0 | 190 | 70808 | 658.78 | 554 | 539 | 106.7 |
| C | 9 | 187 | 1201555 | 9867.16 | 527 | 530 | 121.7 |
| C | 14 | 254 | 605191 | 4967.66 | 527 | 530 | 121.7 |
| C | 15 | 214 | 212890 | 1744.67 | 527 | 530 | 121.7 |
| D | 2 | 153 | 225501 | 1797.29 | 505 | 491 | 125.2 |
| D | 1 | 52 | 196813 | 1568.14 | 505 | 491 | 125.2 |
| D | 2 | 250 | 169571 | 1350.54 | 505 | 491 | 125.2 |
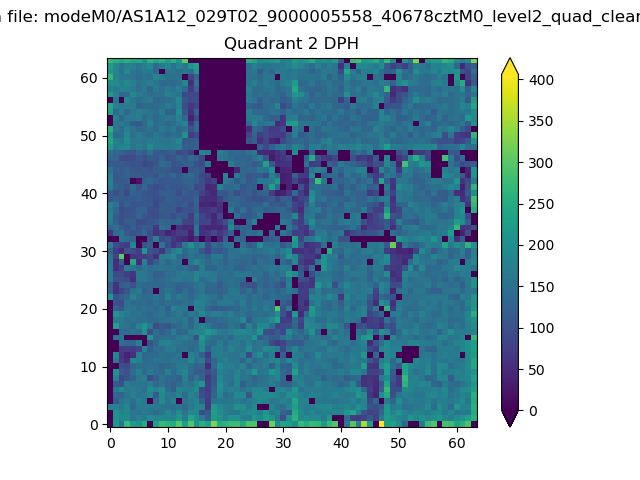
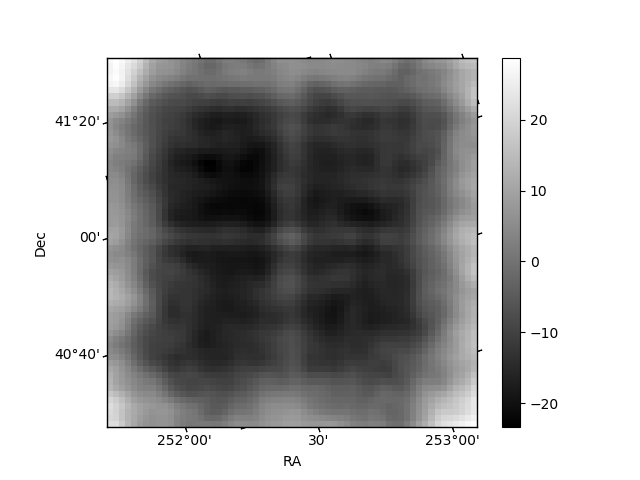
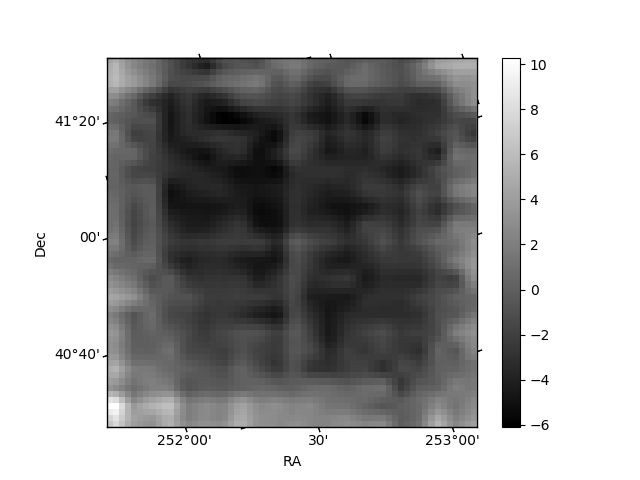
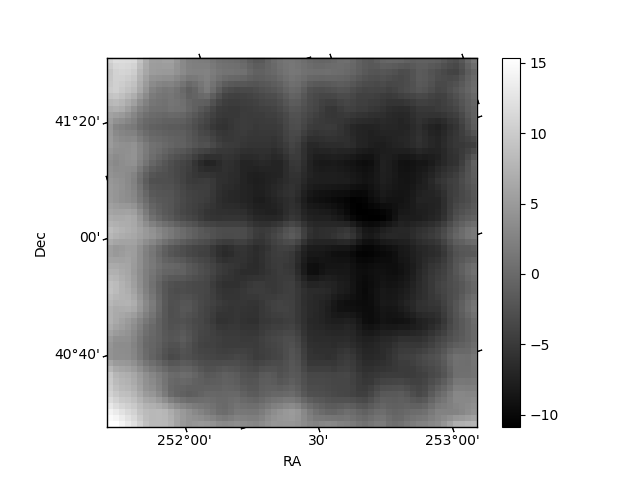
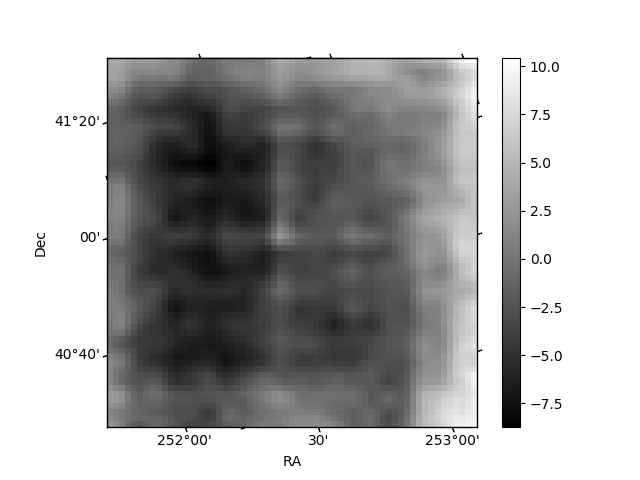
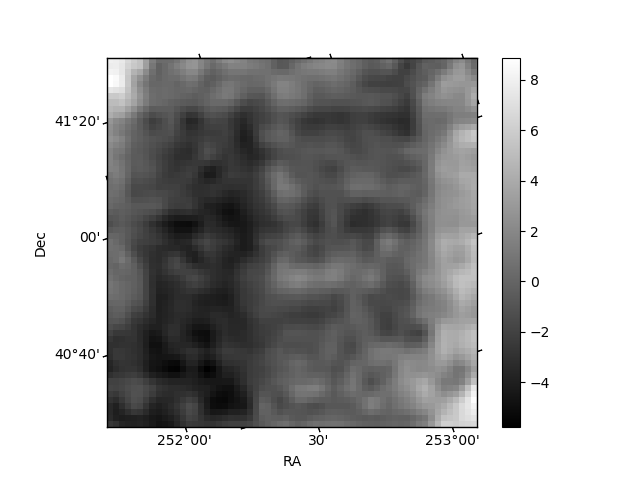
Histogram calculated using DETX and DETY for each event in the final _common_clean file
| Quadrant A | 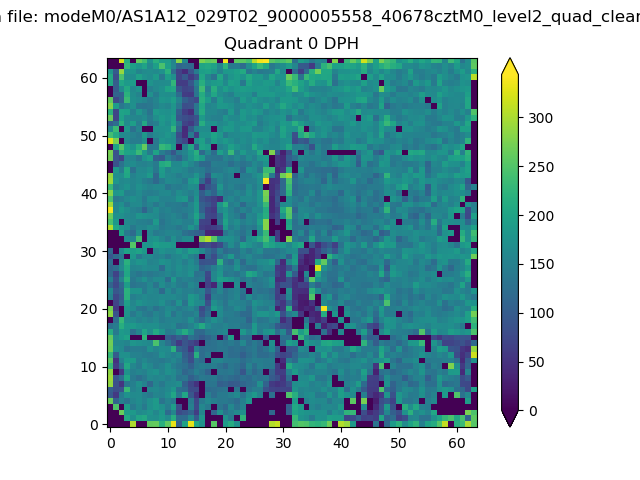 |
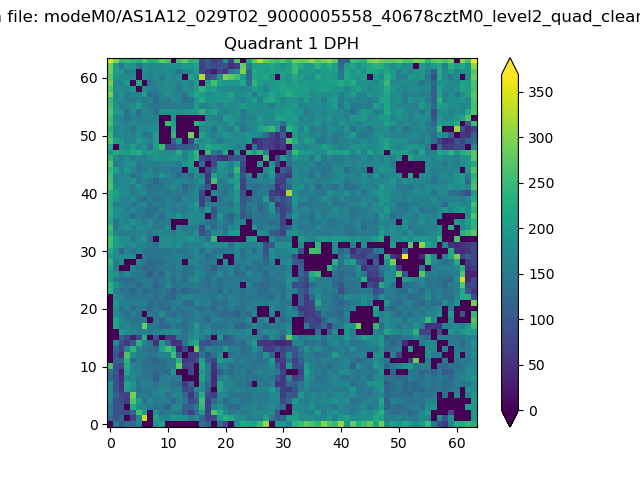 |
Quadrant B |
|---|---|---|---|
| Quadrant D | 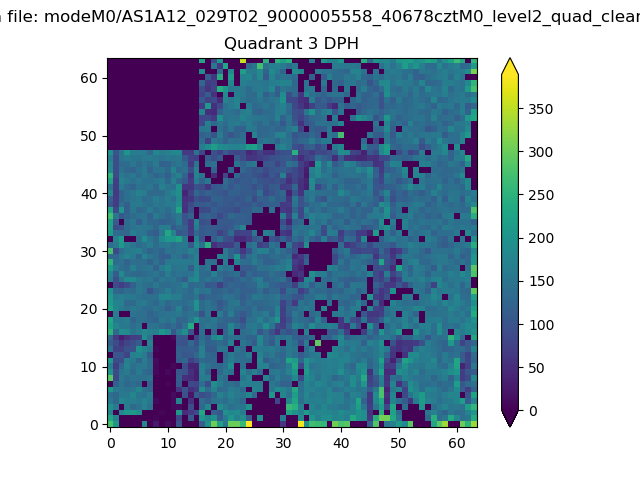 |
 |
Quadrant C |
| Plot type | Count rate plots | Images |
|---|---|---|
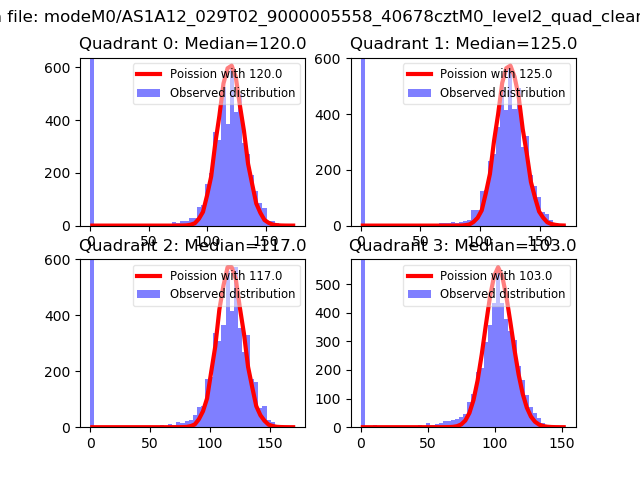
| Comparison with Poisson distribution Blue bars denote a histogram of data divided into 1 sec bins. Red curve is a Poisson curve with rate = median count rate of data. |
 |
 |
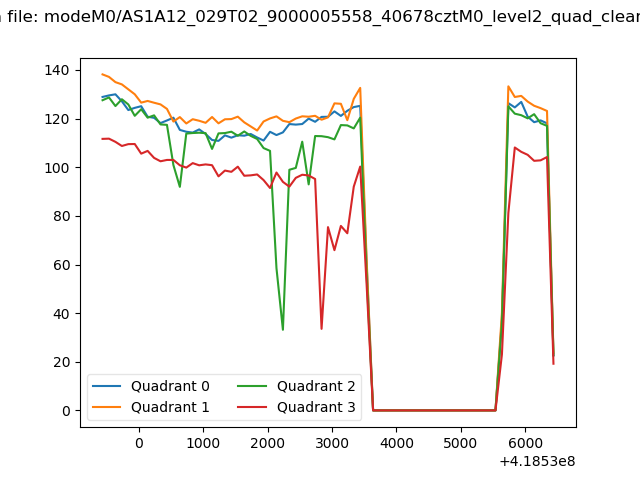
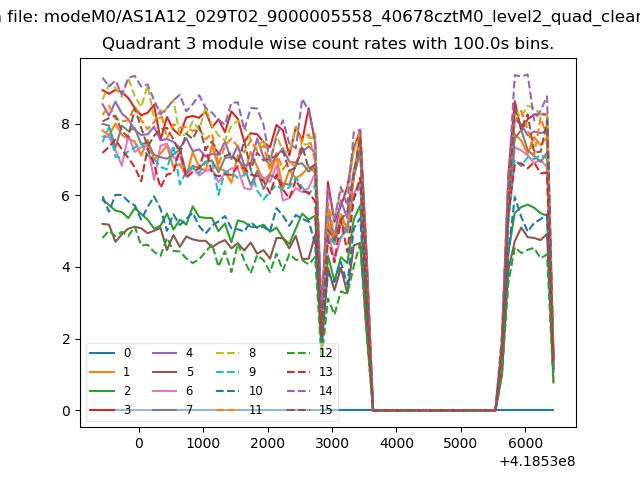
| Quadrant-wise count rates Data is divided into 100 sec bins |
 |
|
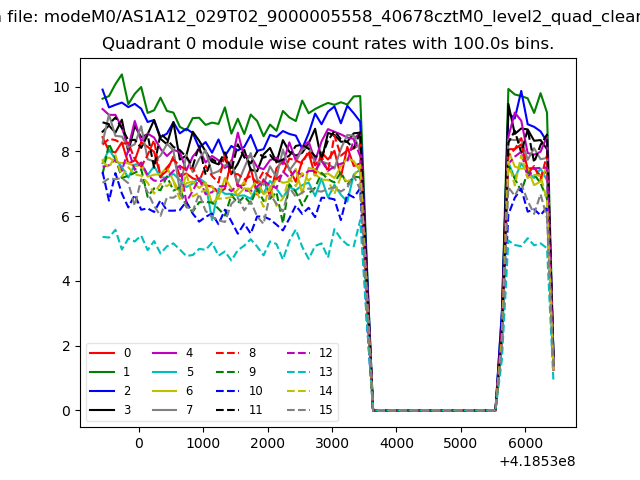
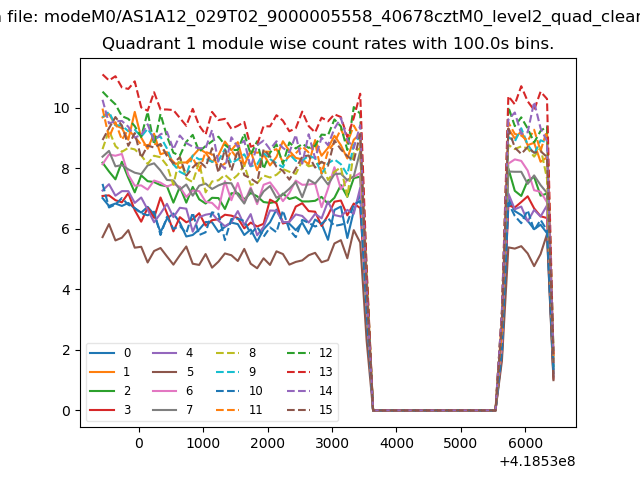
| Module-wise count rates for Quadrant A Data is divided into 100 sec bins |
 |
 |
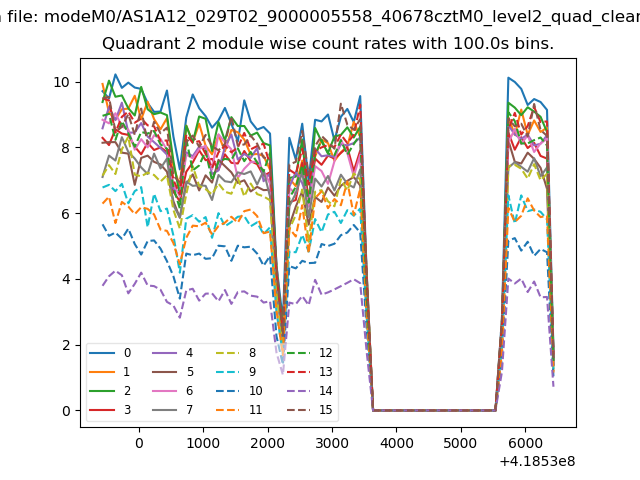
| Module-wise count rates for Quadrant B Data is divided into 100 sec bins |
 |
 |
| Module-wise count rates for Quadrant C Data is divided into 100 sec bins |
 |
 |
| Module-wise count rates for Quadrant D Data is divided into 100 sec bins |
 |
 |
| Parameter | Plot |
|---|---|
| CZT HV Monitor | 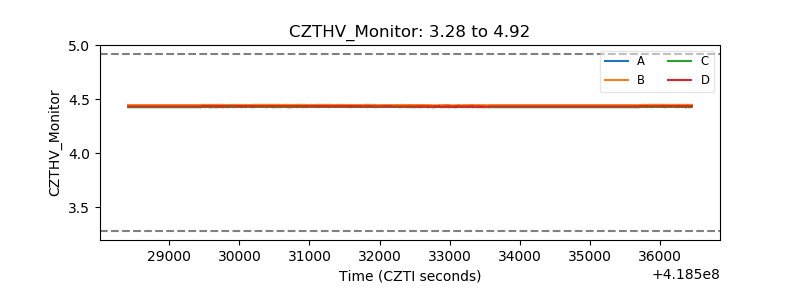 |
| D_VDD | 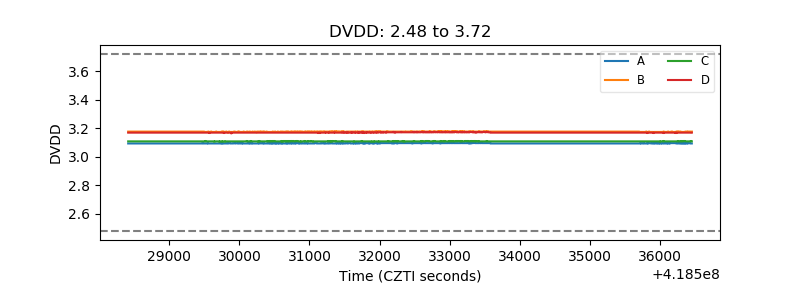 |
| Temperature 1 | 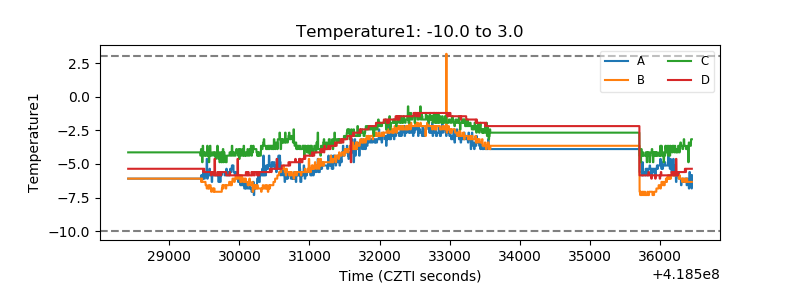 |
| Veto HV Monitor | 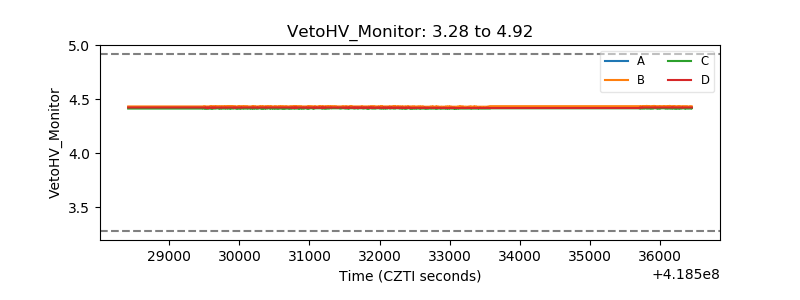 |
| Veto LLD | 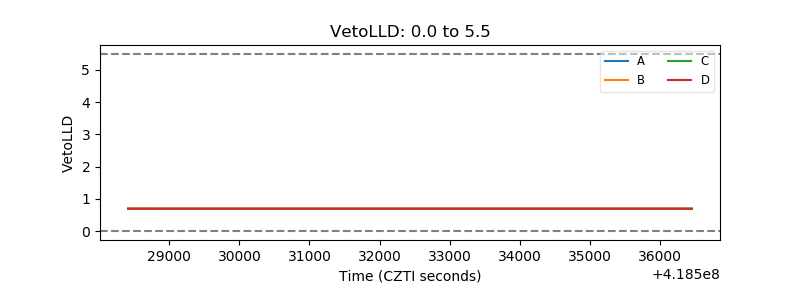 |
| Alpha Counter | 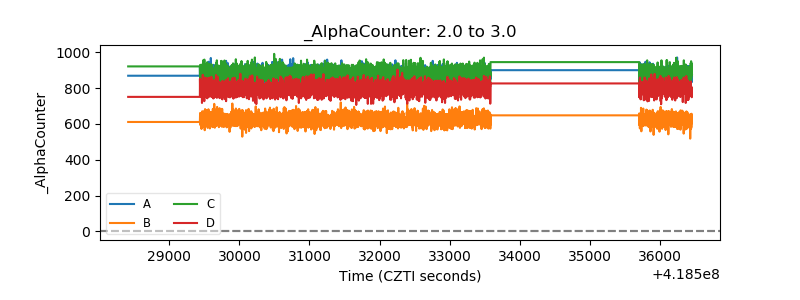 |
| _CPM_Rate | 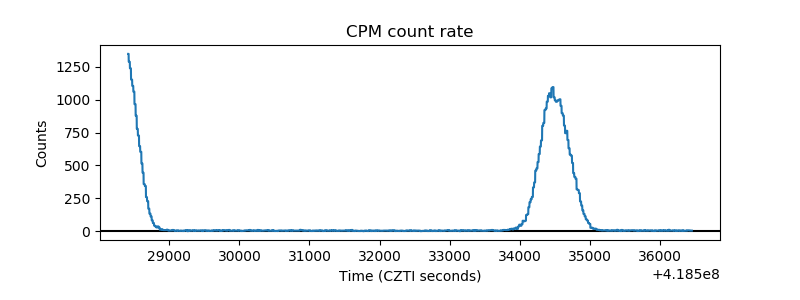 |
| CZT Counter | 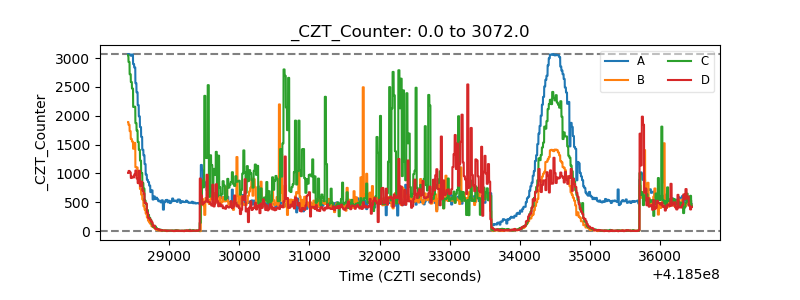 |
| +2.5 Volts monitor | 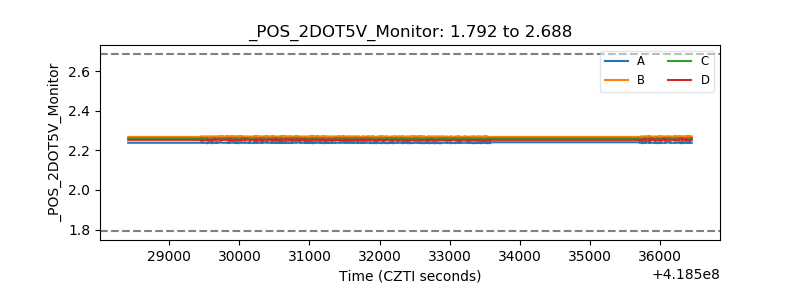 |
| +5 Volts monitor | 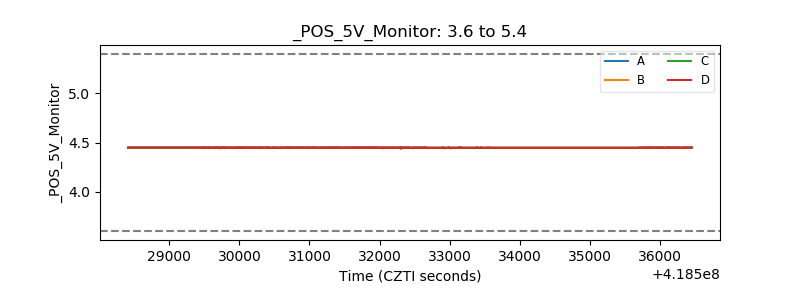 |
| _ROLL_ROT | 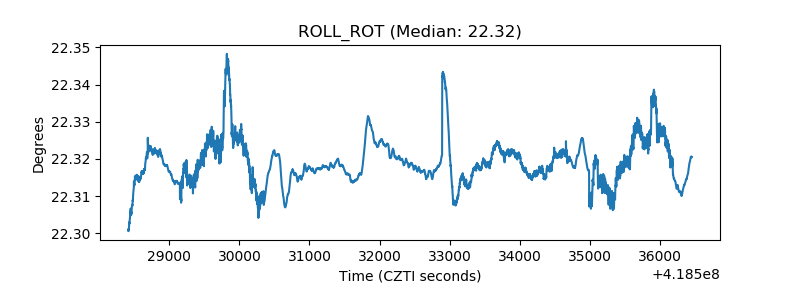 |
| _Roll_DEC | 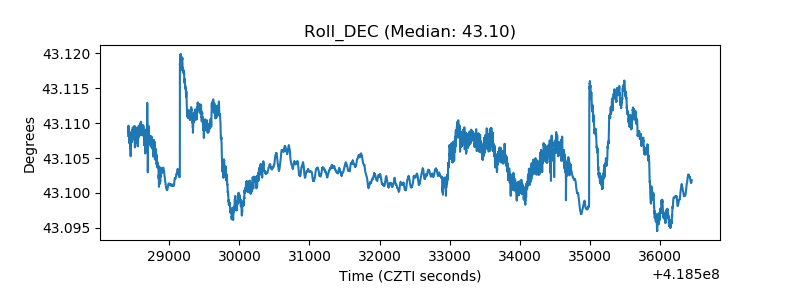 |
| _Roll_RA | 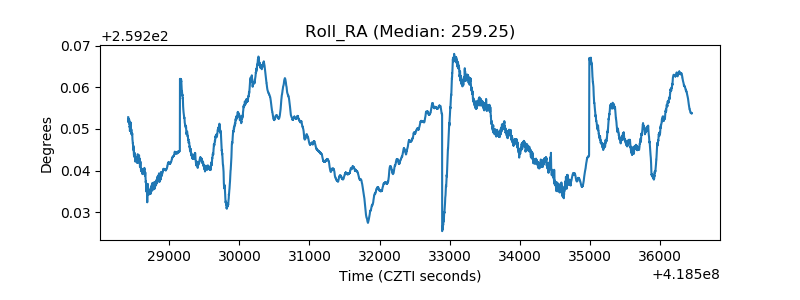 |
| Veto Counter | 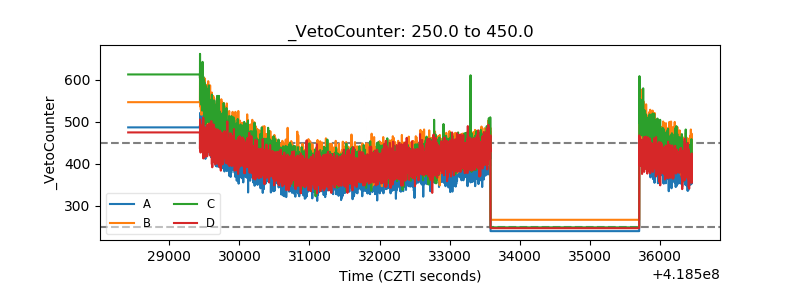 |