| Param | Original file | Final file |
|---|---|---|
| Filename | modeM0/AS1A12_029T02_9000005558_40679cztM0_level2.fits | modeM0/AS1A12_029T02_9000005558_40679cztM0_level2_quad_clean.evt |
| Size (bytes) | 336,968,640 | 87,240,960 |
| Size | 321.4 MB | 83.2 MB |
| Events in quadrant A | 2,858,480 | 598,683 |
| Events in quadrant B | 3,199,646 | 607,326 |
| Events in quadrant C | 3,324,482 | 585,434 |
| Events in quadrant D | 2,687,567 | 487,822 |
| Mode M0 | |||
|---|---|---|---|
| Quadrant | BADHDUFLAG | Total packets | Discarded packets |
| A | 0 | 11511 | 3 |
| B | 0 | 12916 | 2 |
| C | 0 | 13197 | 2 |
| D | 0 | 11596 | 2 |
| Mode M9 | |||
|---|---|---|---|
| Quadrant | BADHDUFLAG | Total packets | Discarded packets |
| A | 0 | 23 | 0 |
| B | 0 | 23 | 0 |
| C | 0 | 23 | 0 |
| D | 0 | 24 | 0 |
| Mode SS | |||
|---|---|---|---|
| Quadrant | BADHDUFLAG | Total packets | Discarded packets |
| A | 0 | 106 | 0 |
| B | 0 | 106 | 0 |
| C | 0 | 106 | 0 |
| D | 0 | 106 | 0 |
| Quadrant | Total seconds | Saturated seconds | Saturation percentage |
|---|---|---|---|
| A | 5172 | 13 | 0.251353% |
| B | 5172 | 173 | 3.344934% |
| C | 5172 | 48 | 0.928074% |
| D | 5172 | 535 | 10.344161% |
Noise dominated data is calculated using 1-second bins in cleaned event files. If a bin has >2000 counts, and if more than 50% of those come from <1% of pixels, then it is considered to be noise-dominated and hence unusable.
| Quadrant | # 1 sec bins | Bins with >0 counts | Bins with >2000 counts | High rate bins dominated by noise | Noise dominated (total time) | Noise dominated (detector-on time) | Marked lightcurve |
|---|---|---|---|---|---|---|---|
| A | 7295 | 5173 | 7 | 7 | 0.10% | 0.14% | 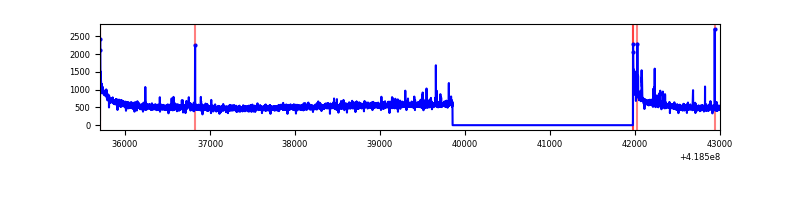 |
| B | 7295 | 5173 | 120 | 120 | 1.64% | 2.32% | 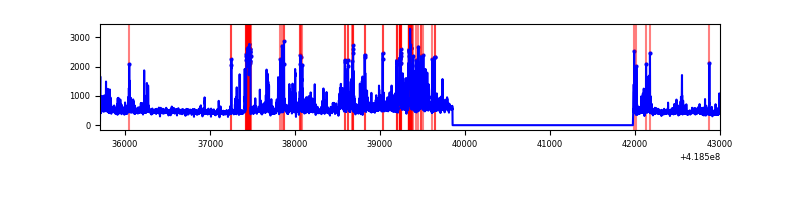 |
| C | 7295 | 5173 | 49 | 49 | 0.67% | 0.95% | 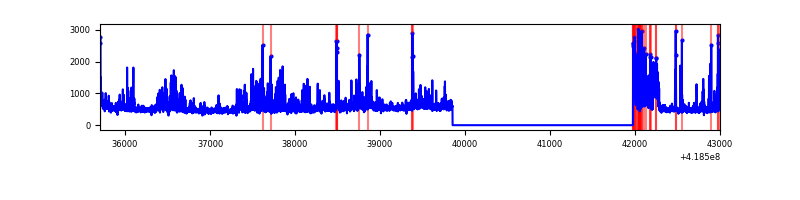 |
| D | 7295 | 5173 | 45 | 45 | 0.62% | 0.87% | 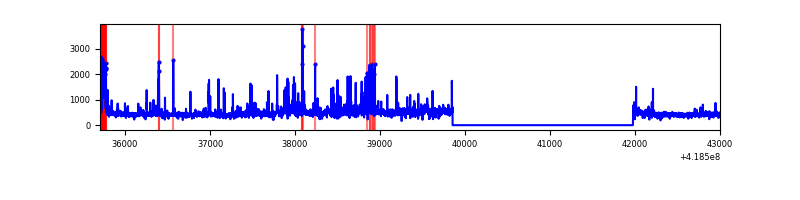 |
Top three noisy pixels from each quadrant. If the there are fewer than three noisy pixels in the level2.evt file, extra rows are filled as -1
| Pixel properties | Quadrant properties | ||||||
|---|---|---|---|---|---|---|---|
| Quadrant | DetID | PixID | Counts | Sigma | Mean | Median | Sigma |
| A | 10 | 83 | 502382 | 4206.96 | 582 | 570 | 119.3 |
| A | 13 | 248 | 32828 | 270.44 | 582 | 570 | 119.3 |
| A | 12 | 189 | 27640 | 226.94 | 582 | 570 | 119.3 |
| B | 0 | 229 | 496222 | 4436.7 | 573 | 558 | 111.7 |
| B | 5 | 255 | 133912 | 1193.66 | 573 | 558 | 111.7 |
| B | 0 | 190 | 131354 | 1170.76 | 573 | 558 | 111.7 |
| C | 9 | 187 | 758413 | 5891.99 | 560 | 564 | 128.6 |
| C | 15 | 214 | 227251 | 1762.4 | 560 | 564 | 128.6 |
| C | 14 | 254 | 99069 | 765.84 | 560 | 564 | 128.6 |
| D | 12 | 191 | 157075 | 1194.09 | 530 | 514 | 131.1 |
| D | 13 | 171 | 118284 | 898.23 | 530 | 514 | 131.1 |
| D | 2 | 153 | 93312 | 707.77 | 530 | 514 | 131.1 |
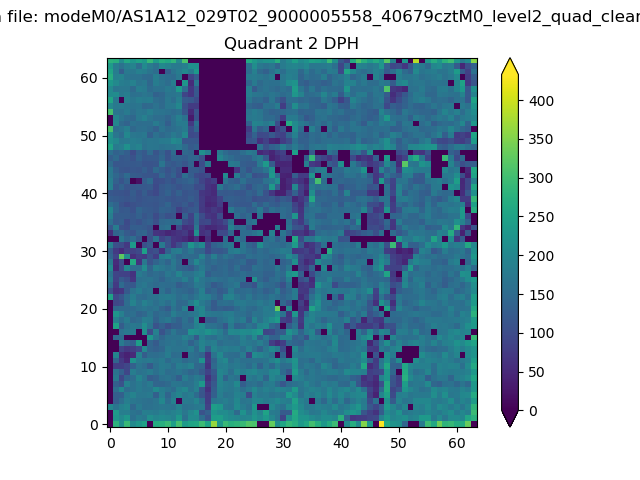
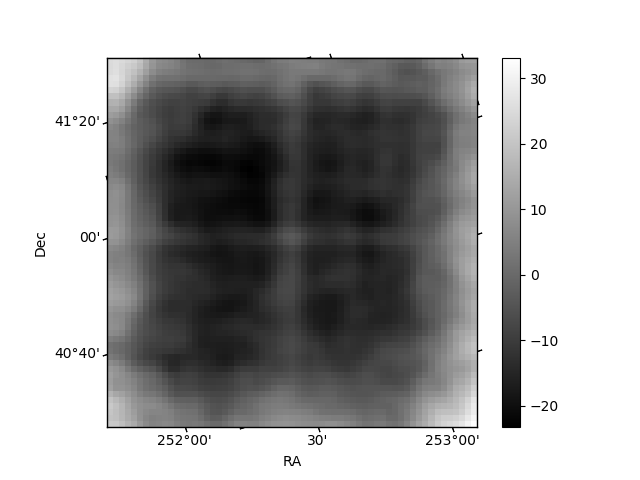
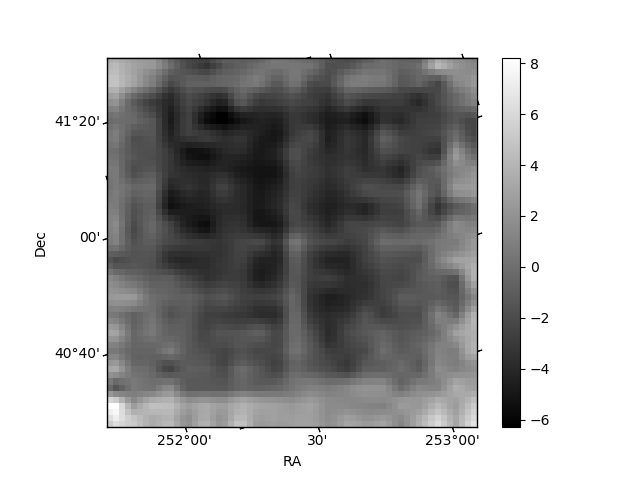
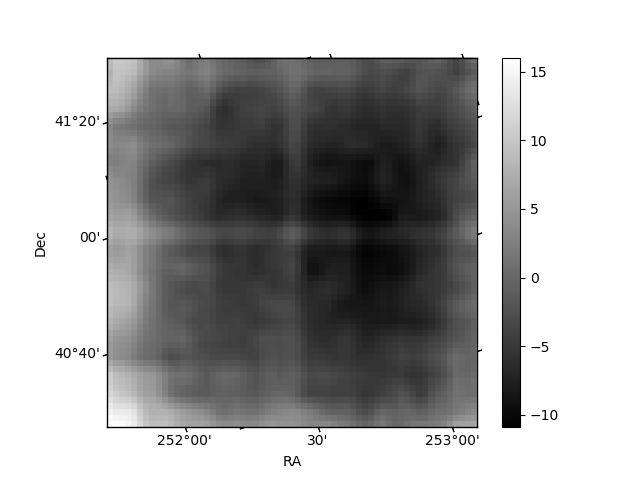
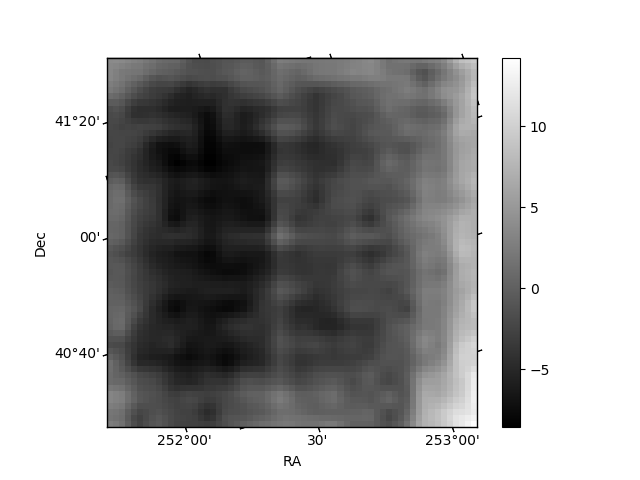
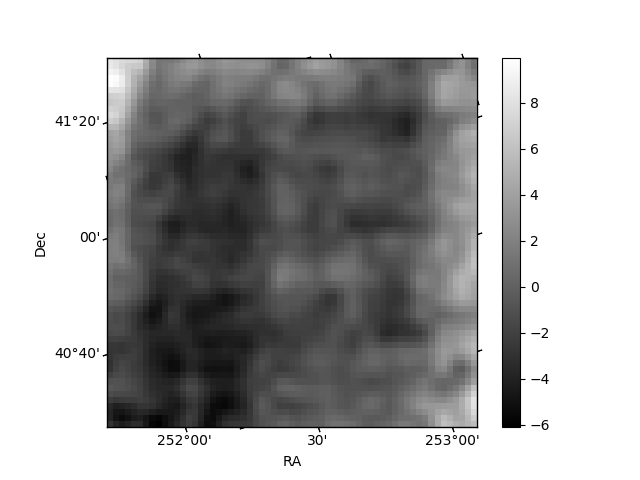
Histogram calculated using DETX and DETY for each event in the final _common_clean file
| Quadrant A | 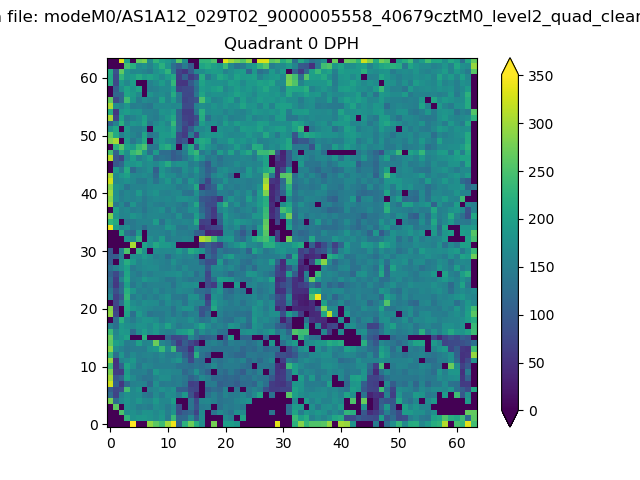 |
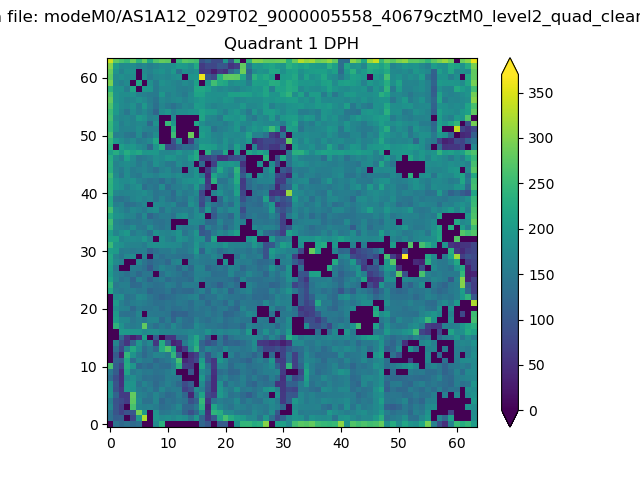 |
Quadrant B |
|---|---|---|---|
| Quadrant D | 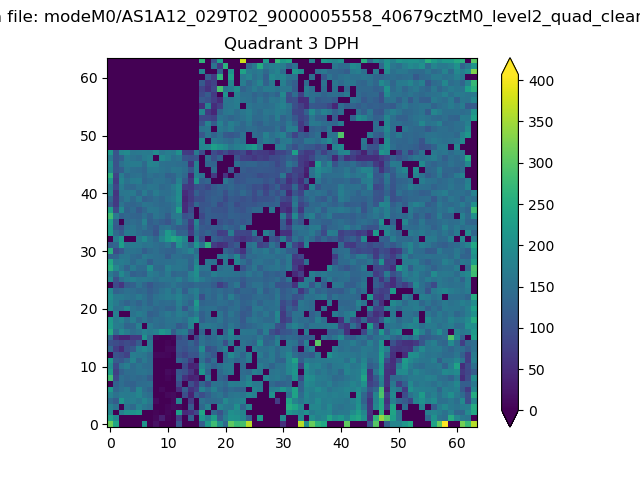 |
 |
Quadrant C |
| Plot type | Count rate plots | Images |
|---|---|---|
| Comparison with Poisson distribution Blue bars denote a histogram of data divided into 1 sec bins. Red curve is a Poisson curve with rate = median count rate of data. |
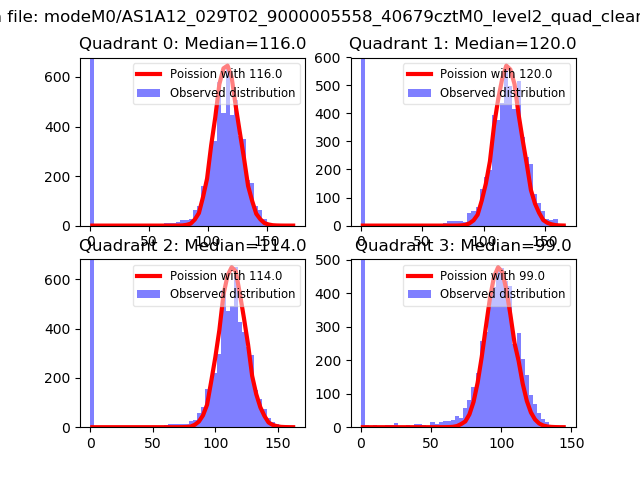 |
 |
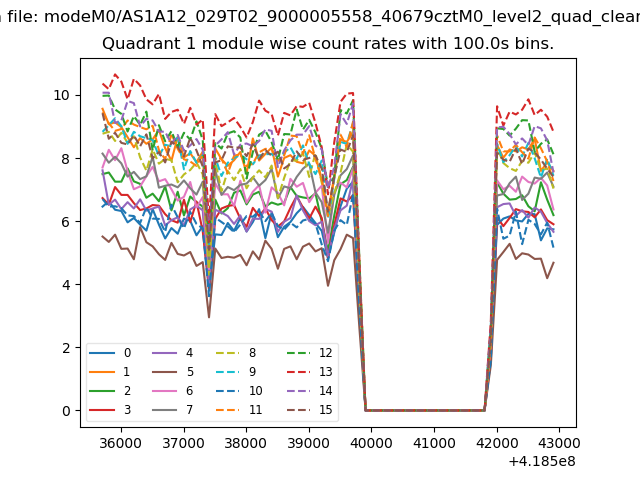
| Quadrant-wise count rates Data is divided into 100 sec bins |
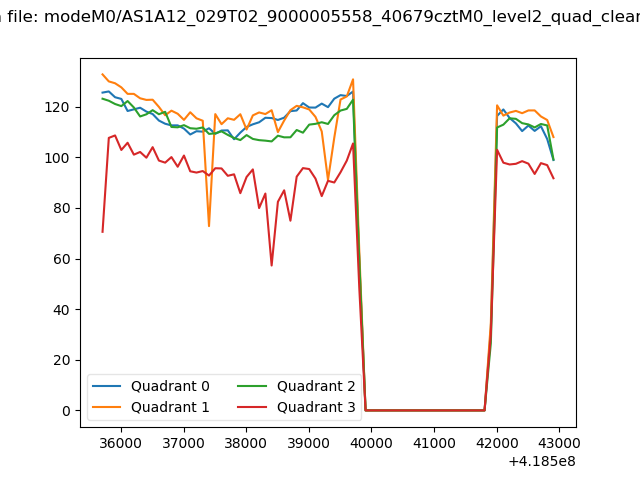 |
|
| Module-wise count rates for Quadrant A Data is divided into 100 sec bins |
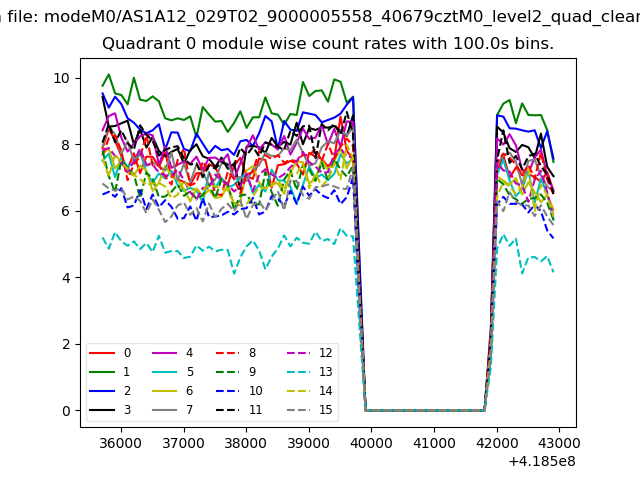 |
 |
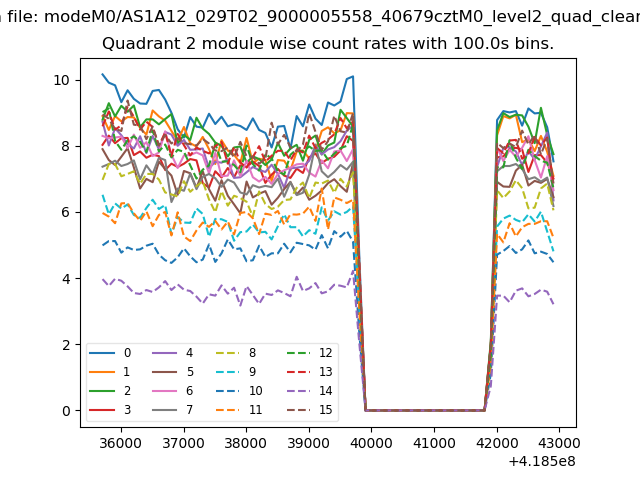
| Module-wise count rates for Quadrant B Data is divided into 100 sec bins |
 |
 |
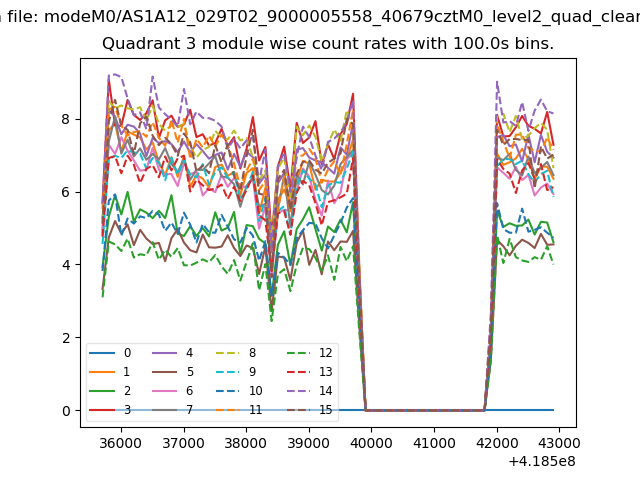
| Module-wise count rates for Quadrant C Data is divided into 100 sec bins |
 |
 |
| Module-wise count rates for Quadrant D Data is divided into 100 sec bins |
 |
 |
| Parameter | Plot |
|---|---|
| CZT HV Monitor | 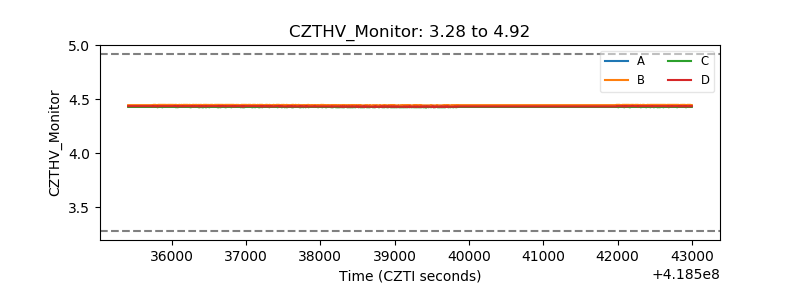 |
| D_VDD | 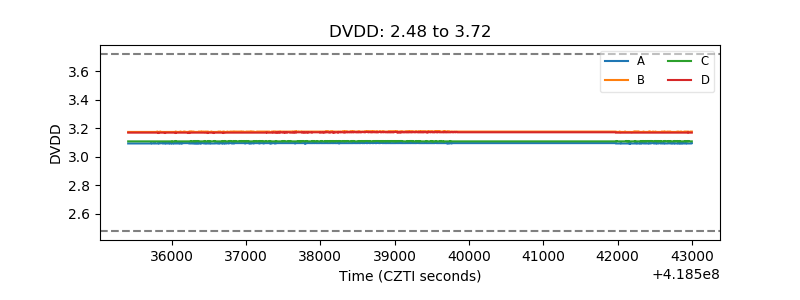 |
| Temperature 1 | 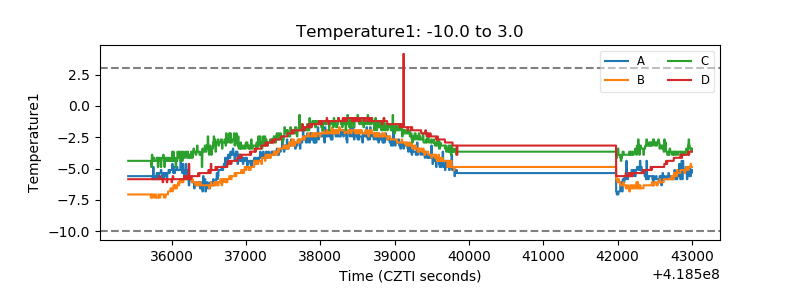 |
| Veto HV Monitor | 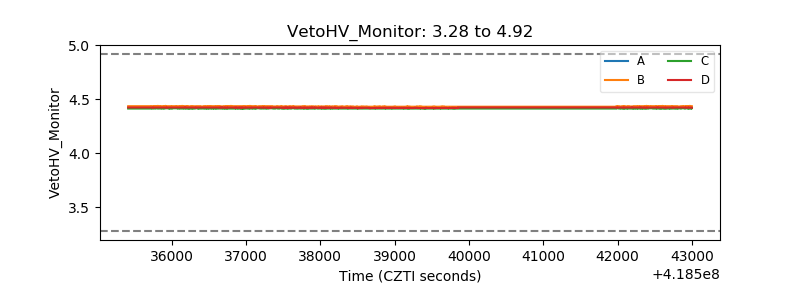 |
| Veto LLD | 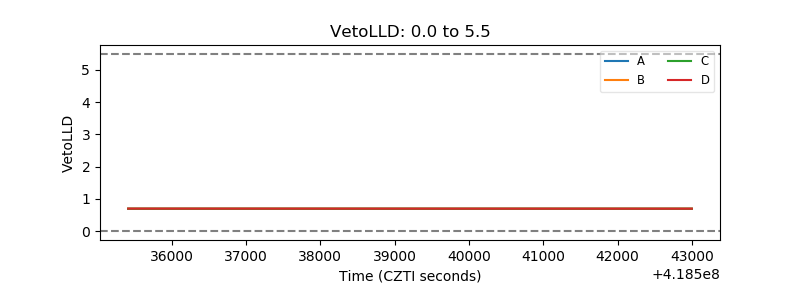 |
| Alpha Counter | 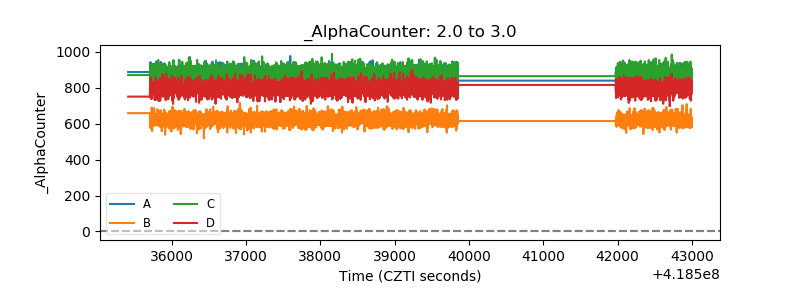 |
| _CPM_Rate | 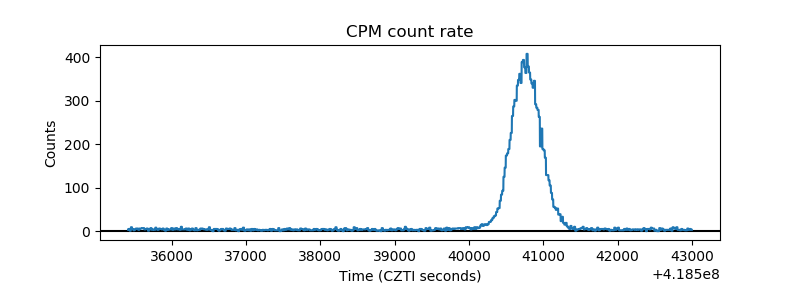 |
| CZT Counter | 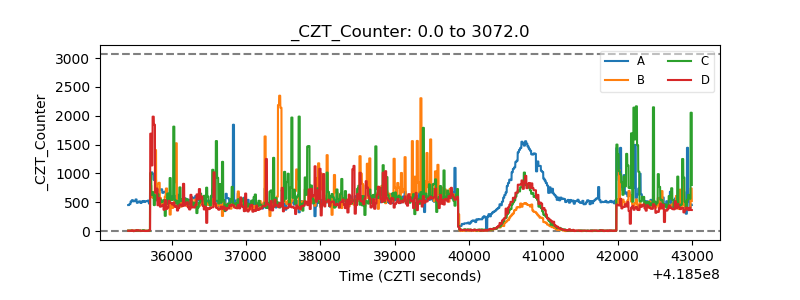 |
| +2.5 Volts monitor | 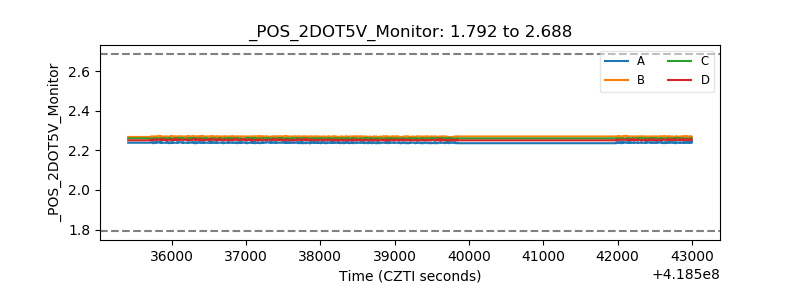 |
| +5 Volts monitor | 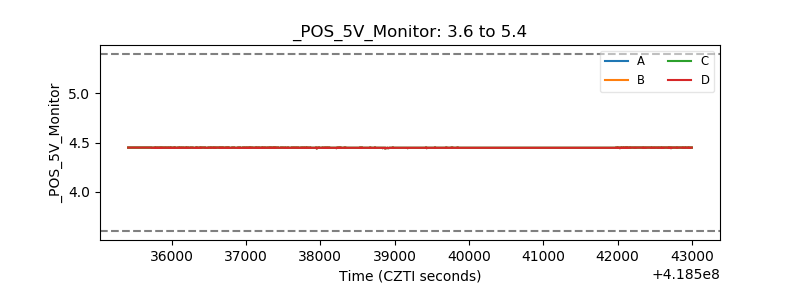 |
| _ROLL_ROT | 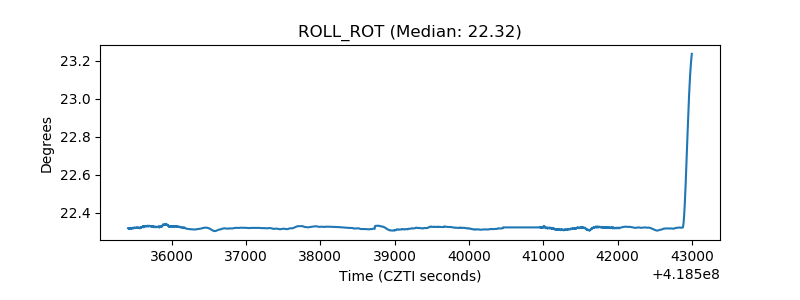 |
| _Roll_DEC | 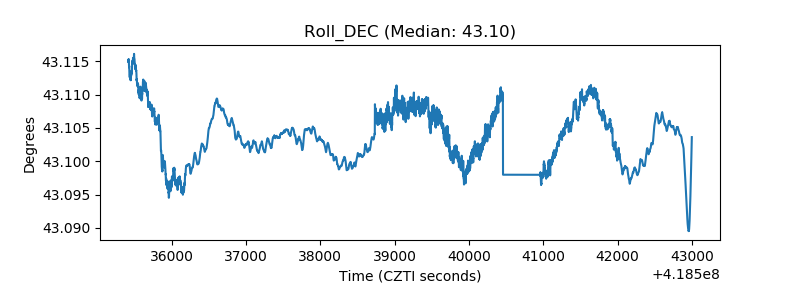 |
| _Roll_RA | 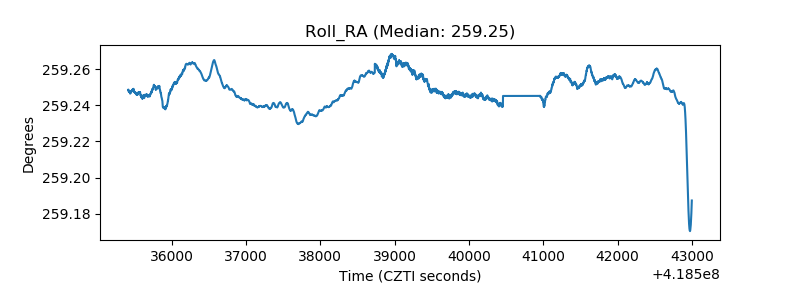 |
| Veto Counter | 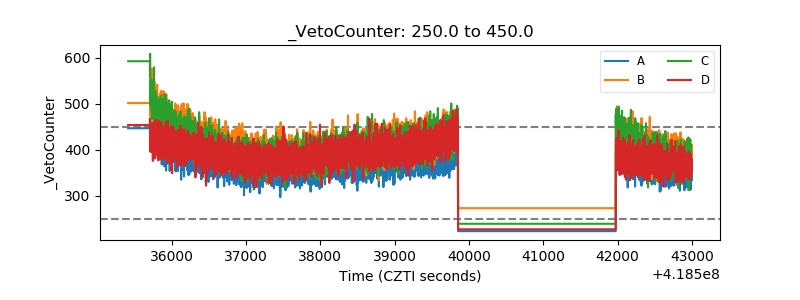 |