| Param | Original file | Final file |
|---|---|---|
| Filename | modeM0/AS1A12_029T02_9000005558_40680cztM0_level2.fits | modeM0/AS1A12_029T02_9000005558_40680cztM0_level2_quad_clean.evt |
| Size (bytes) | 360,947,520 | 82,359,360 |
| Size | 344.2 MB | 78.5 MB |
| Events in quadrant A | 2,932,235 | 581,824 |
| Events in quadrant B | 3,019,217 | 599,677 |
| Events in quadrant C | 4,397,413 | 558,782 |
| Events in quadrant D | 2,604,219 | 387,148 |
| Mode M0 | |||
|---|---|---|---|
| Quadrant | BADHDUFLAG | Total packets | Discarded packets |
| A | 0 | 11705 | 3 |
| B | 0 | 12377 | 2 |
| C | 0 | 16455 | 2 |
| D | 0 | 11669 | 2 |
| Mode M9 | |||
|---|---|---|---|
| Quadrant | BADHDUFLAG | Total packets | Discarded packets |
| A | 0 | 29 | 0 |
| B | 0 | 29 | 0 |
| C | 0 | 29 | 0 |
| D | 0 | 30 | 0 |
| Mode SS | |||
|---|---|---|---|
| Quadrant | BADHDUFLAG | Total packets | Discarded packets |
| A | 0 | 108 | 0 |
| B | 0 | 108 | 0 |
| C | 0 | 108 | 0 |
| D | 0 | 108 | 0 |
| Quadrant | Total seconds | Saturated seconds | Saturation percentage |
|---|---|---|---|
| A | 5224 | 33 | 0.631700% |
| B | 5224 | 74 | 1.416539% |
| C | 5224 | 235 | 4.498469% |
| D | 5224 | 1422 | 27.220521% |
Noise dominated data is calculated using 1-second bins in cleaned event files. If a bin has >2000 counts, and if more than 50% of those come from <1% of pixels, then it is considered to be noise-dominated and hence unusable.
| Quadrant | # 1 sec bins | Bins with >0 counts | Bins with >2000 counts | High rate bins dominated by noise | Noise dominated (total time) | Noise dominated (detector-on time) | Marked lightcurve |
|---|---|---|---|---|---|---|---|
| A | 7257 | 5225 | 23 | 23 | 0.32% | 0.44% | 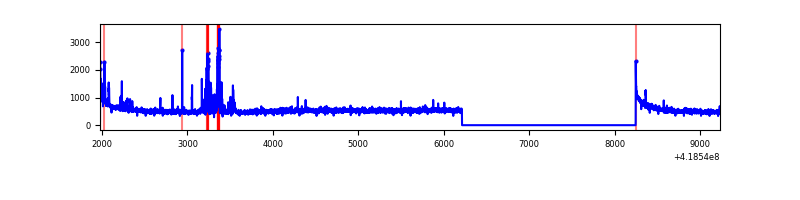 |
| B | 7257 | 5225 | 41 | 41 | 0.56% | 0.78% | 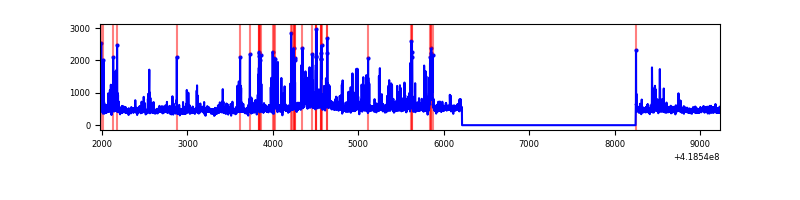 |
| C | 7257 | 5225 | 294 | 294 | 4.05% | 5.63% | 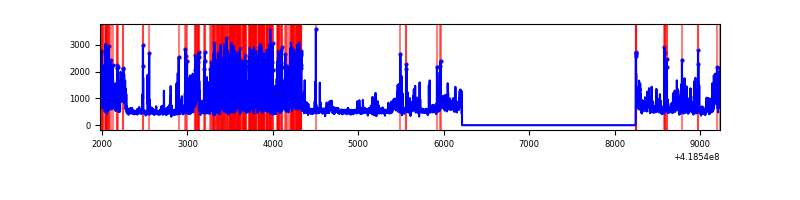 |
| D | 7257 | 5225 | 47 | 47 | 0.65% | 0.90% | 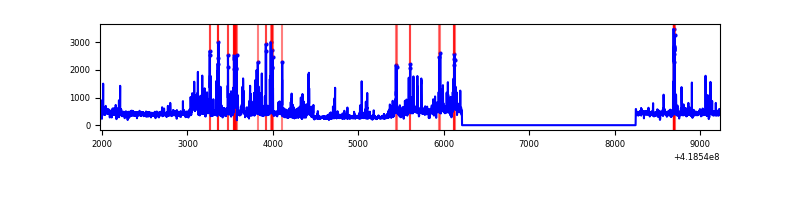 |
Top three noisy pixels from each quadrant. If the there are fewer than three noisy pixels in the level2.evt file, extra rows are filled as -1
| Pixel properties | Quadrant properties | ||||||
|---|---|---|---|---|---|---|---|
| Quadrant | DetID | PixID | Counts | Sigma | Mean | Median | Sigma |
| A | 10 | 83 | 486710 | 4058.65 | 583 | 570 | 119.8 |
| A | 13 | 248 | 157165 | 1307.37 | 583 | 570 | 119.8 |
| A | 6 | 10 | 14947 | 120.03 | 583 | 570 | 119.8 |
| B | 0 | 229 | 421118 | 3782.11 | 577 | 561 | 111.2 |
| B | 4 | 171 | 143380 | 1284.38 | 577 | 561 | 111.2 |
| B | 0 | 230 | 98131 | 877.46 | 577 | 561 | 111.2 |
| C | 9 | 187 | 1823656 | 14177.42 | 555 | 558 | 128.6 |
| C | 15 | 214 | 229578 | 1780.99 | 555 | 558 | 128.6 |
| C | 14 | 254 | 116104 | 898.55 | 555 | 558 | 128.6 |
| D | 12 | 191 | 293017 | 2759.96 | 437 | 425 | 106.0 |
| D | 2 | 250 | 124606 | 1171.37 | 437 | 425 | 106.0 |
| D | 12 | 227 | 100829 | 947.09 | 437 | 425 | 106.0 |
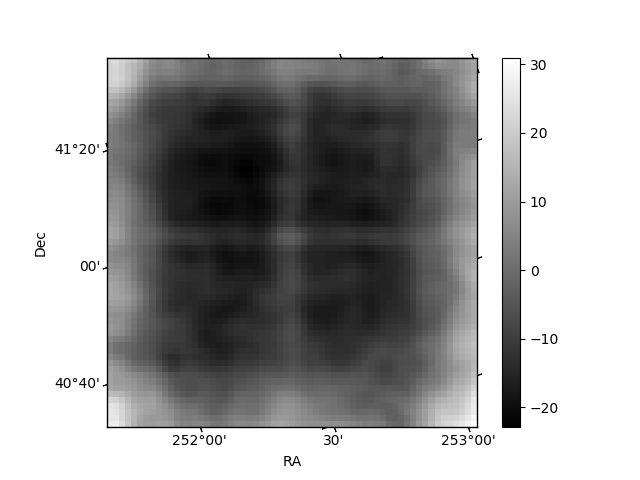
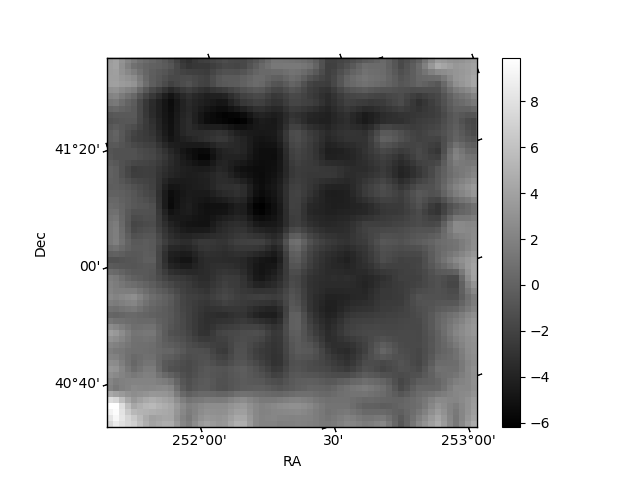
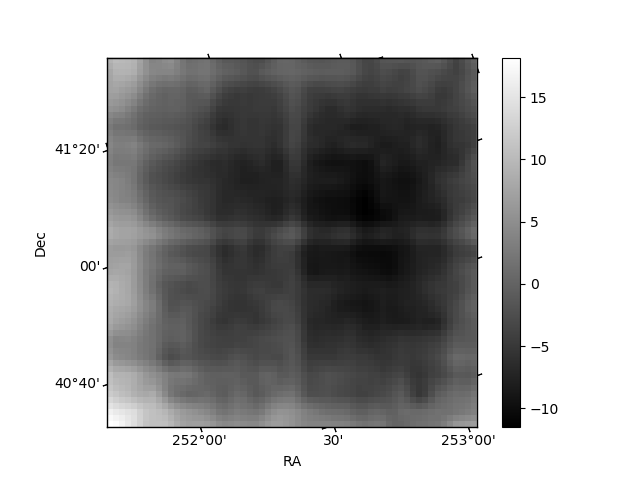
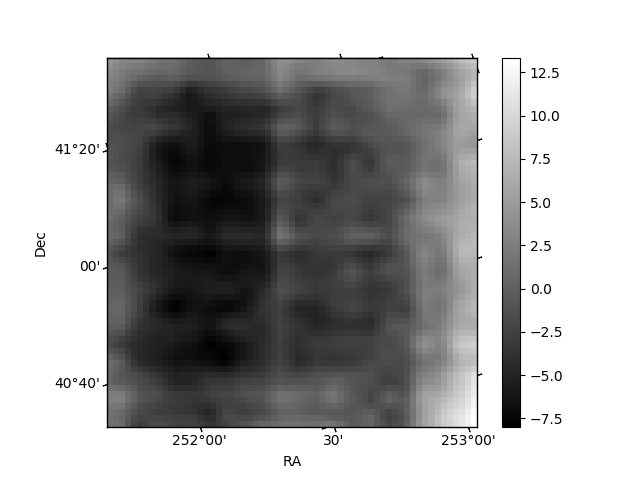
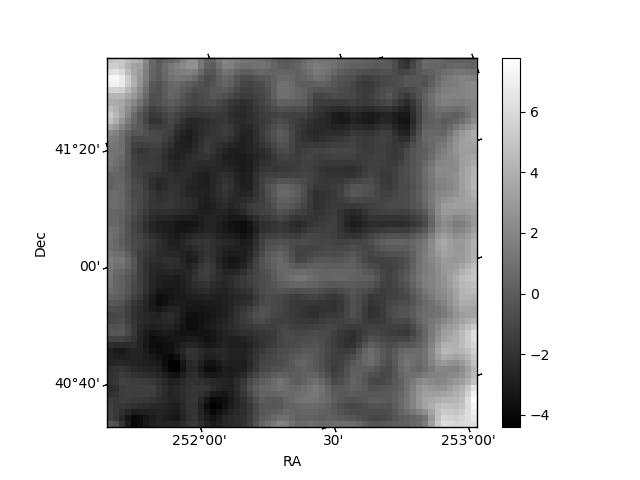
Histogram calculated using DETX and DETY for each event in the final _common_clean file
| Quadrant A | 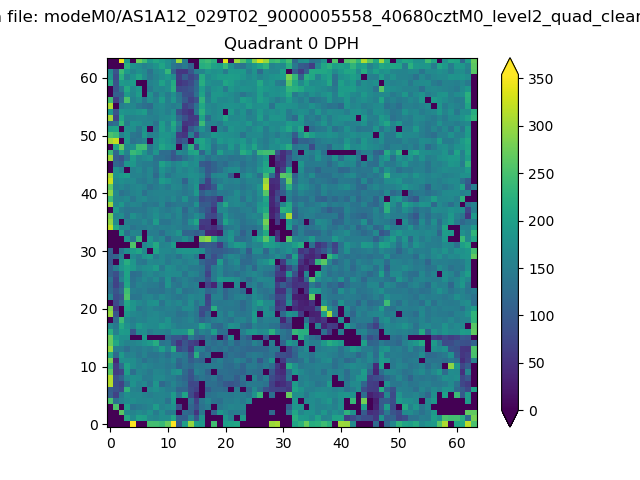 |
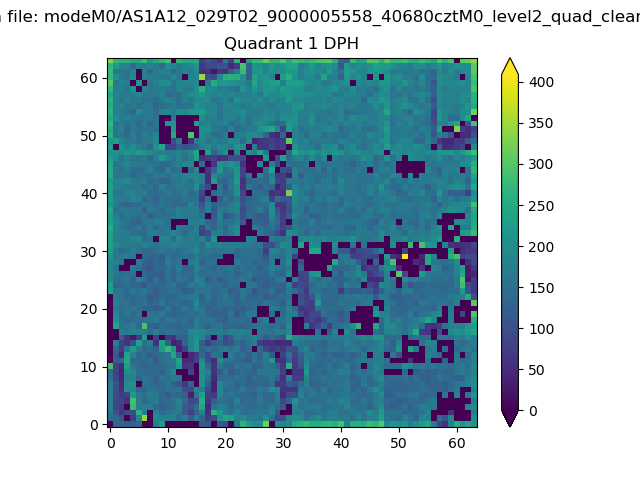 |
Quadrant B |
|---|---|---|---|
| Quadrant D | 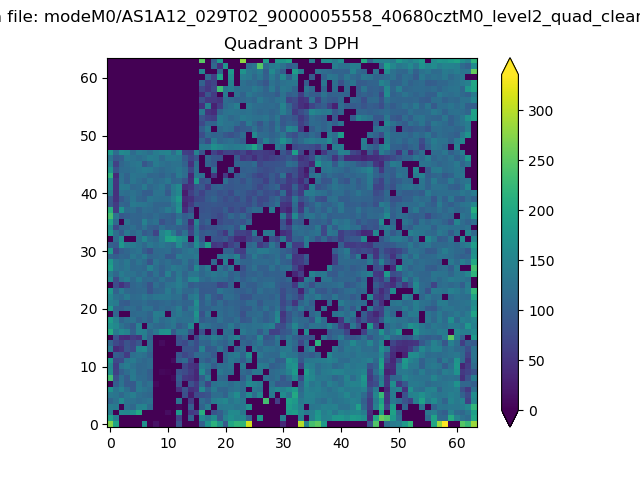 |
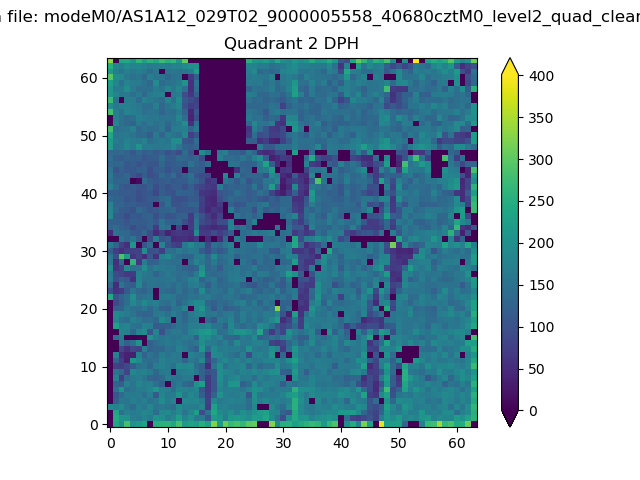 |
Quadrant C |
| Plot type | Count rate plots | Images |
|---|---|---|
| Comparison with Poisson distribution Blue bars denote a histogram of data divided into 1 sec bins. Red curve is a Poisson curve with rate = median count rate of data. |
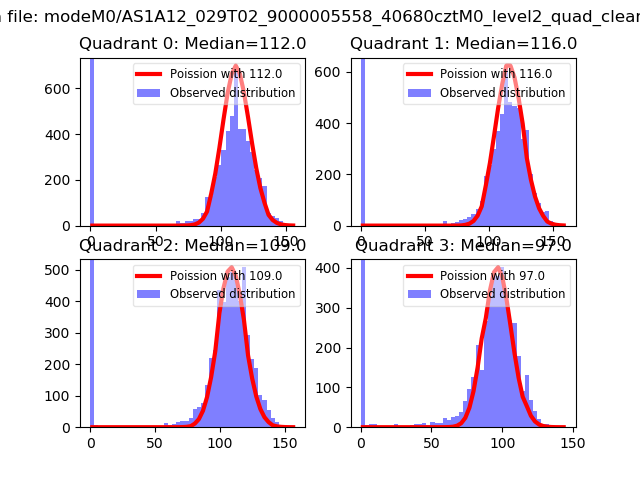 |
 |
| Quadrant-wise count rates Data is divided into 100 sec bins |
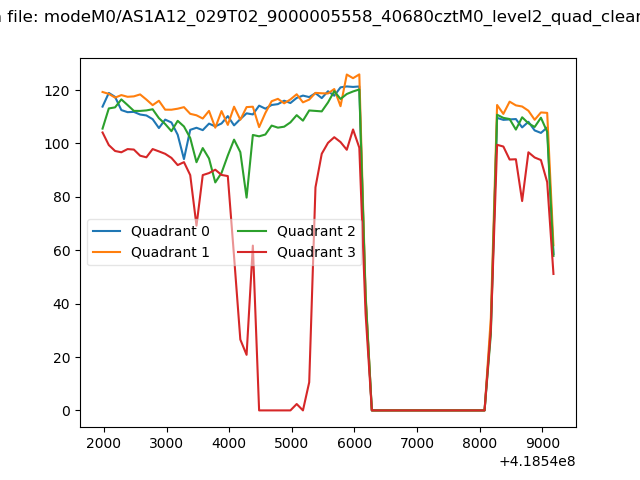 |
|
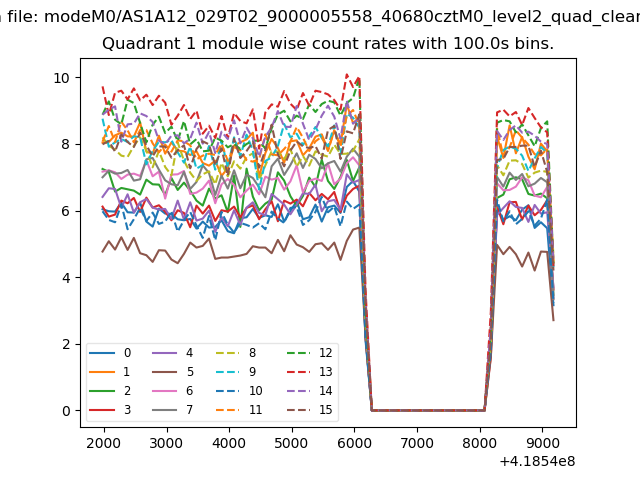
| Module-wise count rates for Quadrant A Data is divided into 100 sec bins |
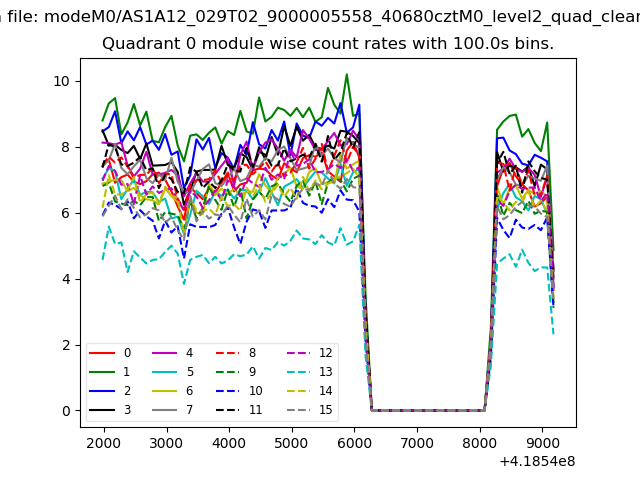 |
 |
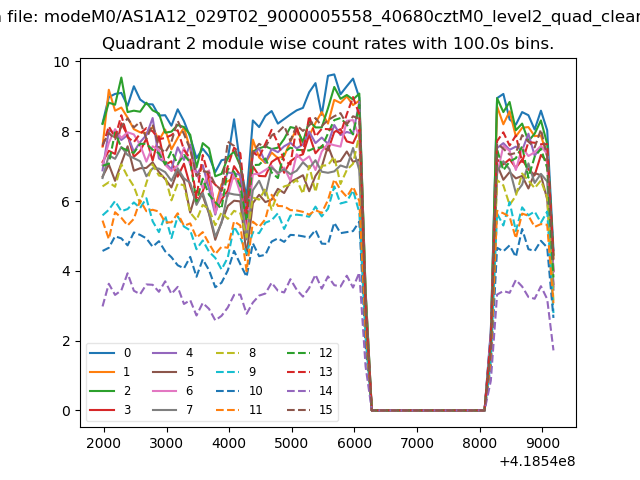
| Module-wise count rates for Quadrant B Data is divided into 100 sec bins |
 |
 |
| Module-wise count rates for Quadrant C Data is divided into 100 sec bins |
 |
 |
| Module-wise count rates for Quadrant D Data is divided into 100 sec bins |
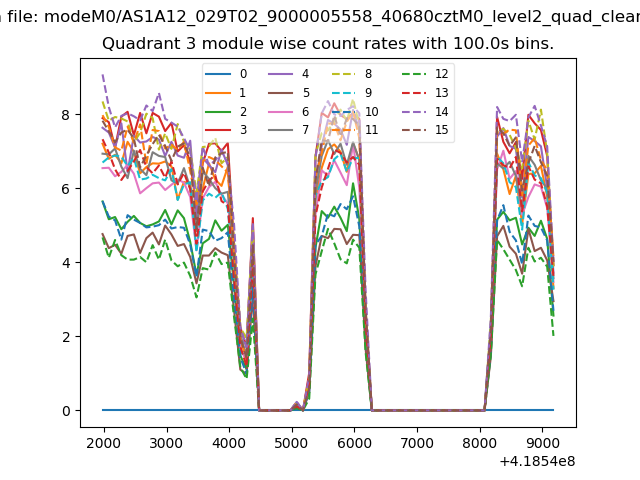 |
 |
| Parameter | Plot |
|---|---|
| CZT HV Monitor | 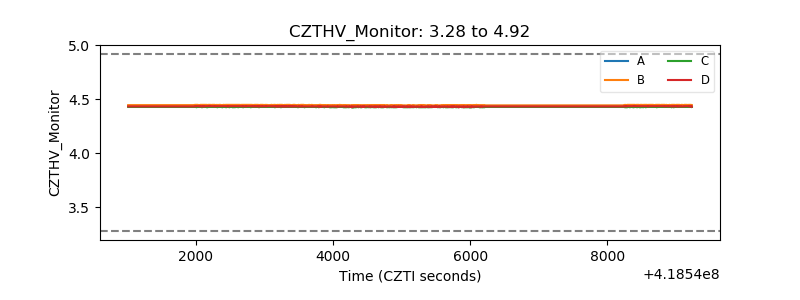 |
| D_VDD | 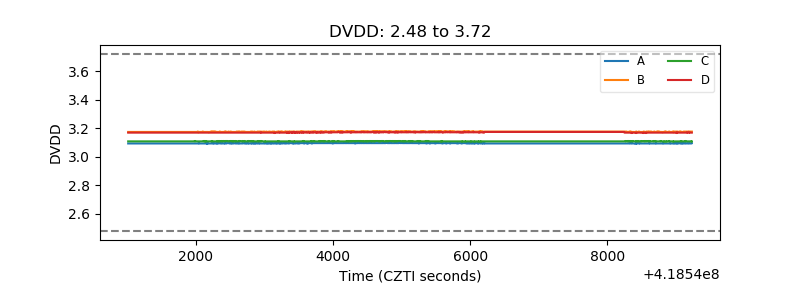 |
| Temperature 1 | 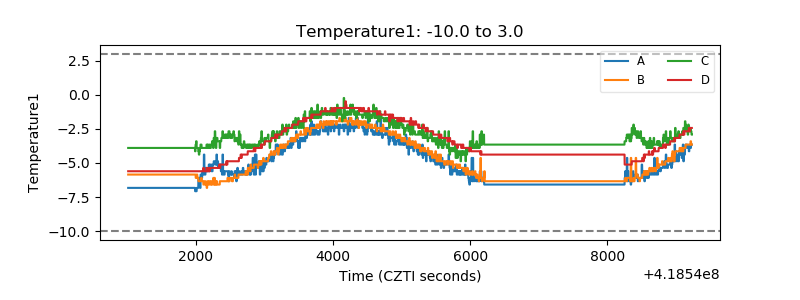 |
| Veto HV Monitor | 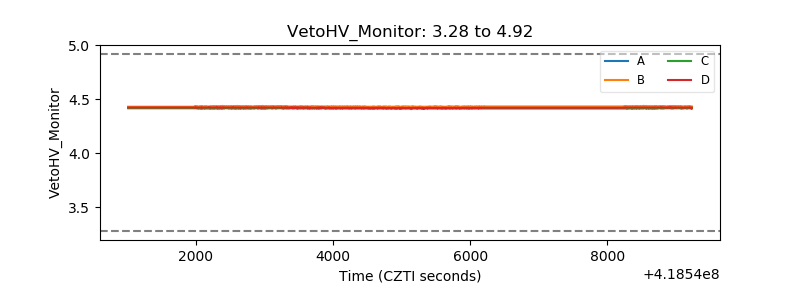 |
| Veto LLD | 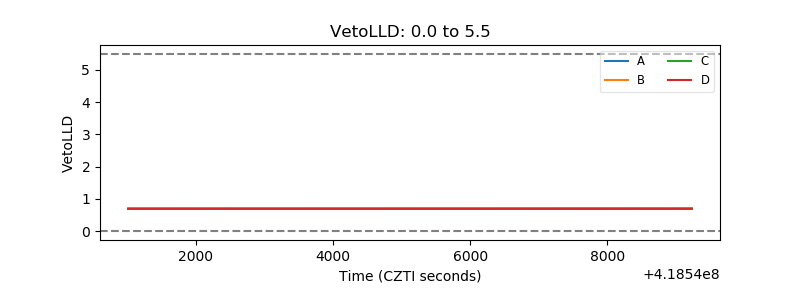 |
| Alpha Counter | 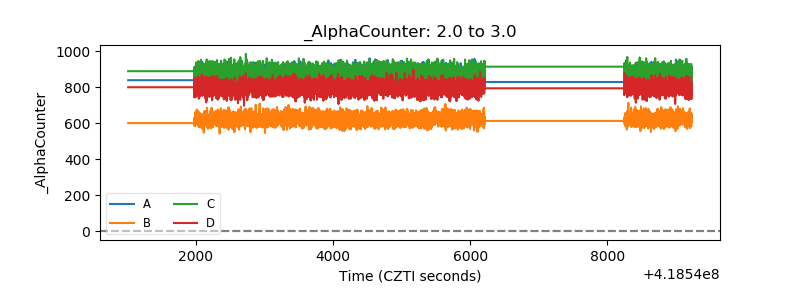 |
| _CPM_Rate | 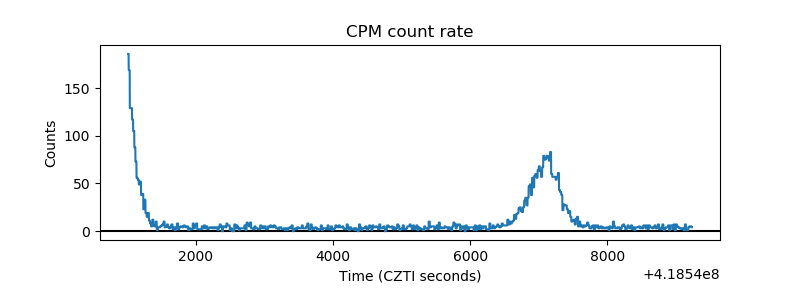 |
| CZT Counter | 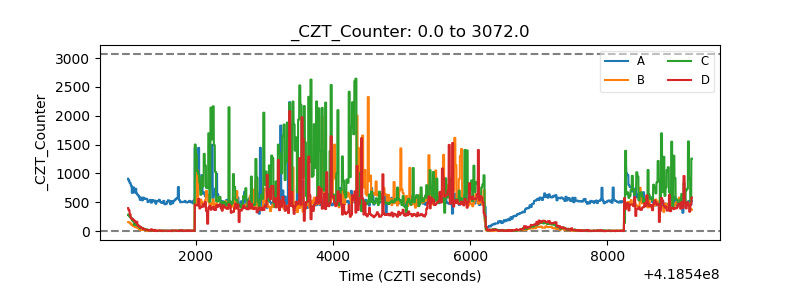 |
| +2.5 Volts monitor | 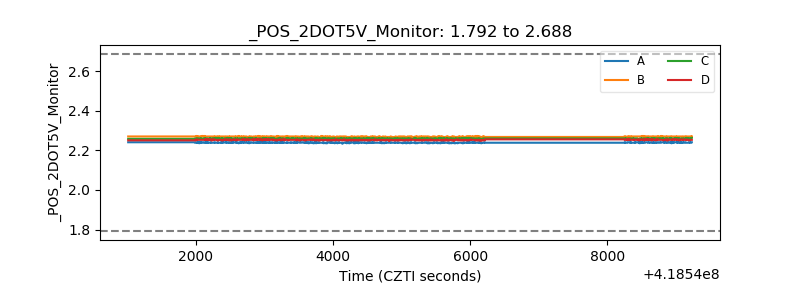 |
| +5 Volts monitor | 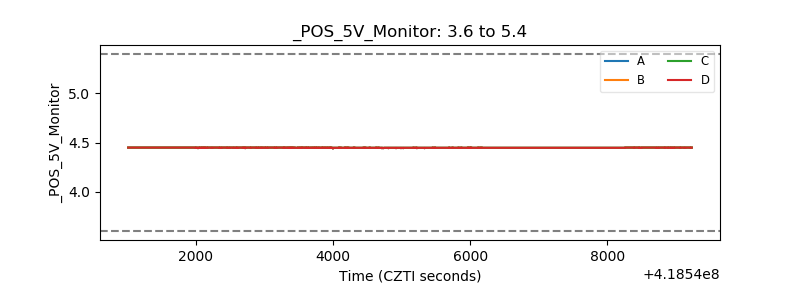 |
| _ROLL_ROT | 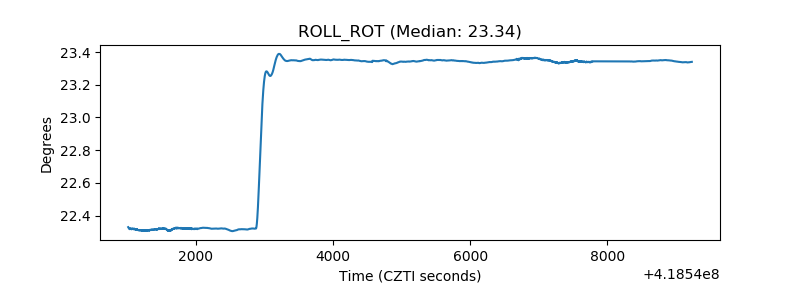 |
| _Roll_DEC | 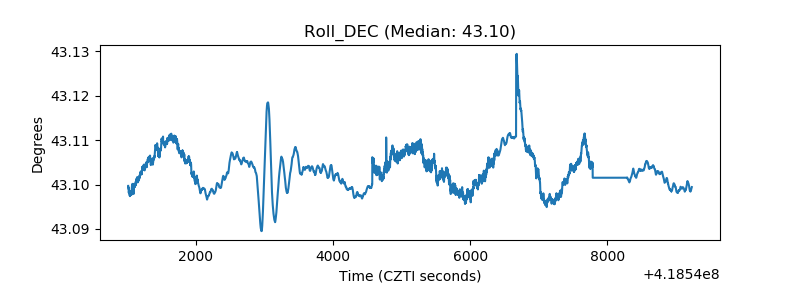 |
| _Roll_RA | 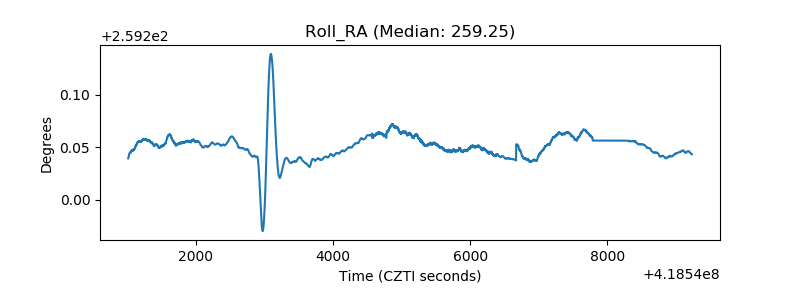 |
| Veto Counter | 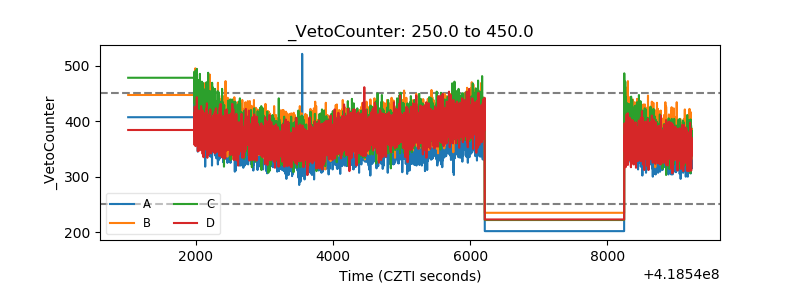 |