| Param | Original file | Final file |
|---|---|---|
| Filename | modeM0/AS1A12_029T02_9000005558_40681cztM0_level2.fits | modeM0/AS1A12_029T02_9000005558_40681cztM0_level2_quad_clean.evt |
| Size (bytes) | 365,705,280 | 85,576,320 |
| Size | 348.8 MB | 81.6 MB |
| Events in quadrant A | 2,875,045 | 585,470 |
| Events in quadrant B | 3,212,159 | 602,629 |
| Events in quadrant C | 4,039,858 | 551,932 |
| Events in quadrant D | 2,991,303 | 474,431 |
| Mode M0 | |||
|---|---|---|---|
| Quadrant | BADHDUFLAG | Total packets | Discarded packets |
| A | 0 | 11600 | 3 |
| B | 0 | 12930 | 2 |
| C | 0 | 15297 | 2 |
| D | 0 | 12551 | 2 |
| Mode M9 | |||
|---|---|---|---|
| Quadrant | BADHDUFLAG | Total packets | Discarded packets |
| A | 0 | 18 | 0 |
| B | 0 | 18 | 0 |
| C | 0 | 18 | 0 |
| D | 0 | 18 | 0 |
| Mode SS | |||
|---|---|---|---|
| Quadrant | BADHDUFLAG | Total packets | Discarded packets |
| A | 0 | 110 | 0 |
| B | 0 | 110 | 0 |
| C | 0 | 110 | 0 |
| D | 0 | 110 | 0 |
| Quadrant | Total seconds | Saturated seconds | Saturation percentage |
|---|---|---|---|
| A | 5374 | 11 | 0.204689% |
| B | 5374 | 94 | 1.749163% |
| C | 5374 | 328 | 6.103461% |
| D | 5374 | 645 | 12.002233% |
Noise dominated data is calculated using 1-second bins in cleaned event files. If a bin has >2000 counts, and if more than 50% of those come from <1% of pixels, then it is considered to be noise-dominated and hence unusable.
| Quadrant | # 1 sec bins | Bins with >0 counts | Bins with >2000 counts | High rate bins dominated by noise | Noise dominated (total time) | Noise dominated (detector-on time) | Marked lightcurve |
|---|---|---|---|---|---|---|---|
| A | 7136 | 5375 | 7 | 7 | 0.10% | 0.13% | 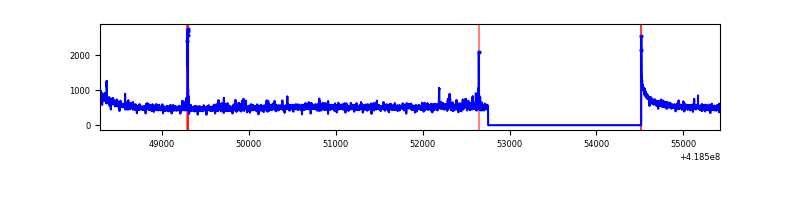 |
| B | 7136 | 5375 | 67 | 67 | 0.94% | 1.25% | 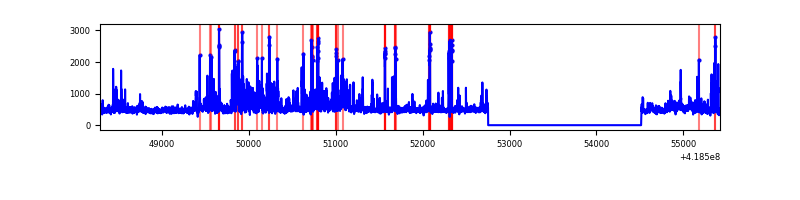 |
| C | 7136 | 5374 | 342 | 342 | 4.79% | 6.36% | 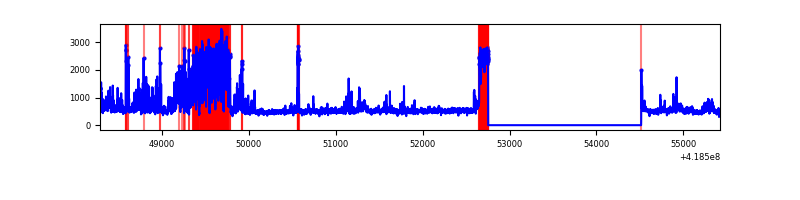 |
| D | 7136 | 5375 | 87 | 87 | 1.22% | 1.62% | 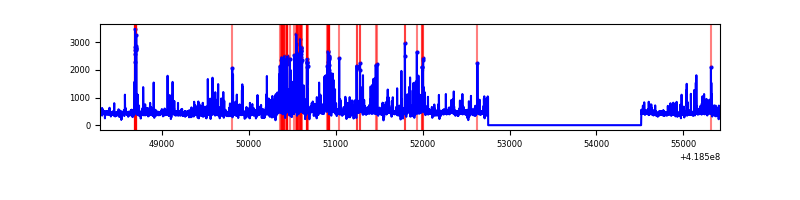 |
Top three noisy pixels from each quadrant. If the there are fewer than three noisy pixels in the level2.evt file, extra rows are filled as -1
| Pixel properties | Quadrant properties | ||||||
|---|---|---|---|---|---|---|---|
| Quadrant | DetID | PixID | Counts | Sigma | Mean | Median | Sigma |
| A | 10 | 83 | 475427 | 3875.29 | 596 | 583 | 122.5 |
| A | 12 | 189 | 71561 | 579.26 | 596 | 583 | 122.5 |
| A | 6 | 10 | 14839 | 116.35 | 596 | 583 | 122.5 |
| B | 0 | 229 | 291614 | 2526.08 | 589 | 574 | 115.2 |
| B | 4 | 171 | 254647 | 2205.23 | 589 | 574 | 115.2 |
| B | 5 | 255 | 176593 | 1527.76 | 589 | 574 | 115.2 |
| C | 9 | 187 | 1525506 | 11541.11 | 567 | 570 | 132.1 |
| C | 15 | 214 | 230500 | 1740.17 | 567 | 570 | 132.1 |
| C | 0 | 207 | 28467 | 211.13 | 567 | 570 | 132.1 |
| D | 12 | 227 | 214590 | 1607.65 | 543 | 527 | 133.2 |
| D | 12 | 191 | 170148 | 1273.89 | 543 | 527 | 133.2 |
| D | 2 | 250 | 144988 | 1084.93 | 543 | 527 | 133.2 |
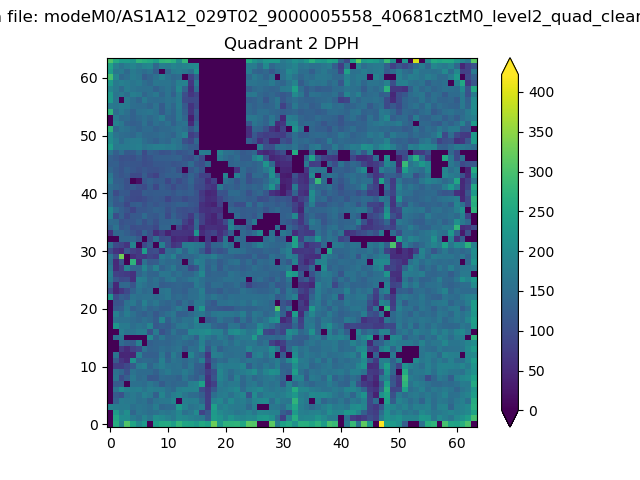
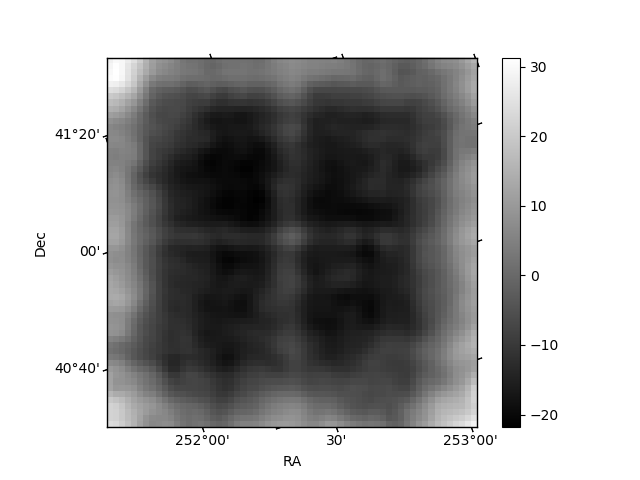
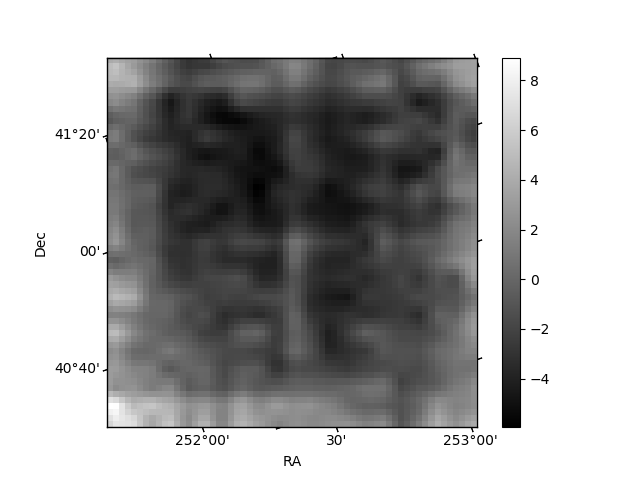
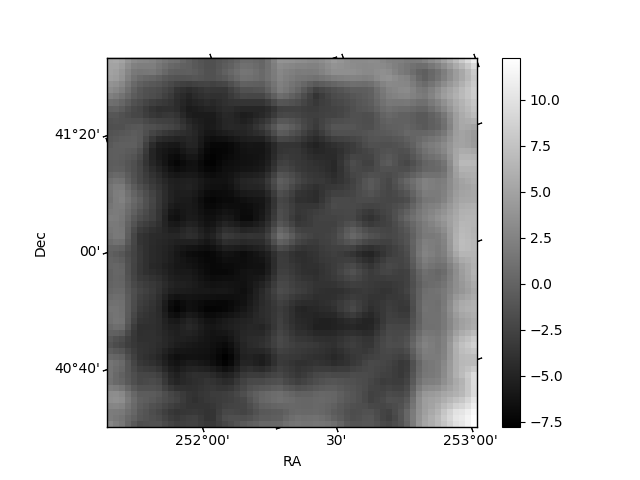
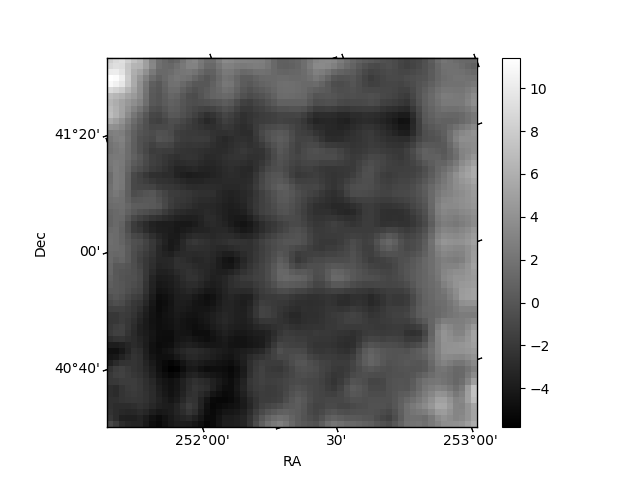
Histogram calculated using DETX and DETY for each event in the final _common_clean file
| Quadrant A | 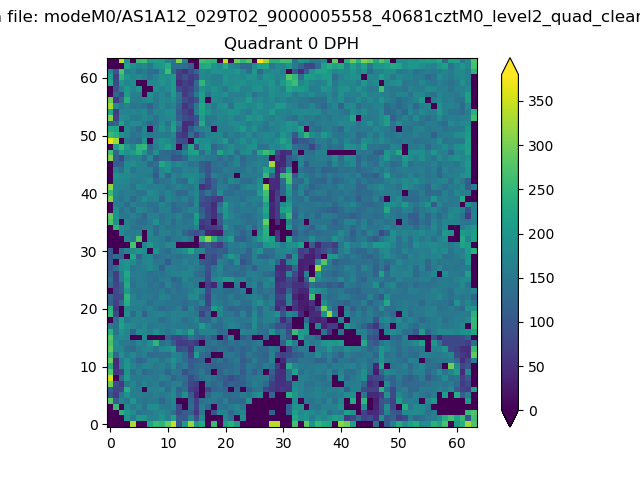 |
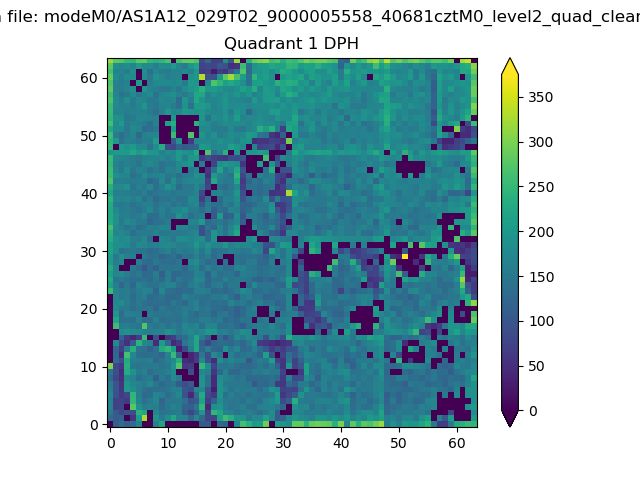 |
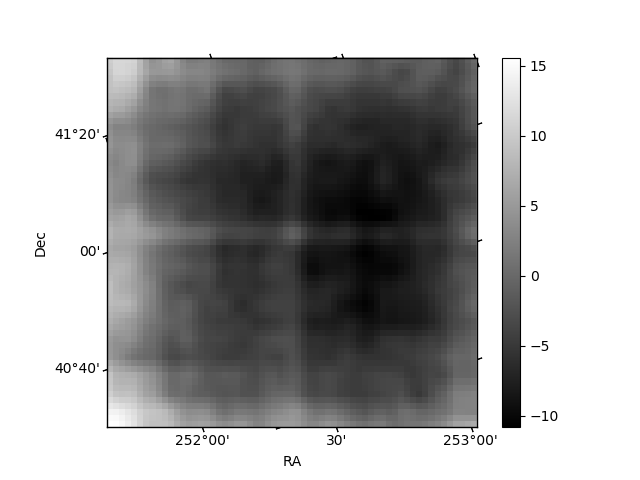
Quadrant B |
|---|---|---|---|
| Quadrant D | 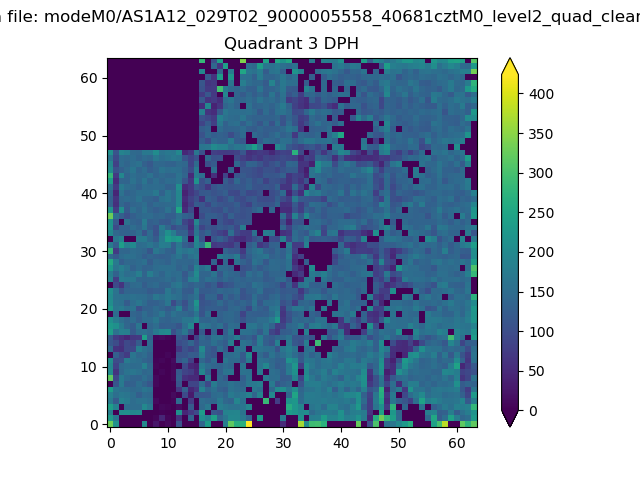 |
 |
Quadrant C |
| Plot type | Count rate plots | Images |
|---|---|---|
| Comparison with Poisson distribution Blue bars denote a histogram of data divided into 1 sec bins. Red curve is a Poisson curve with rate = median count rate of data. |
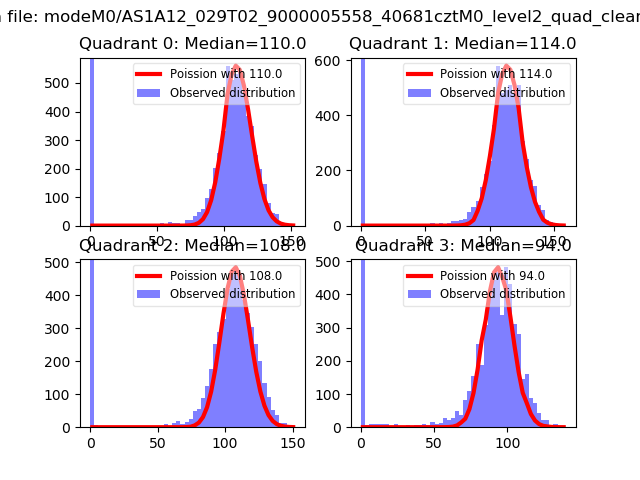 |
 |
| Quadrant-wise count rates Data is divided into 100 sec bins |
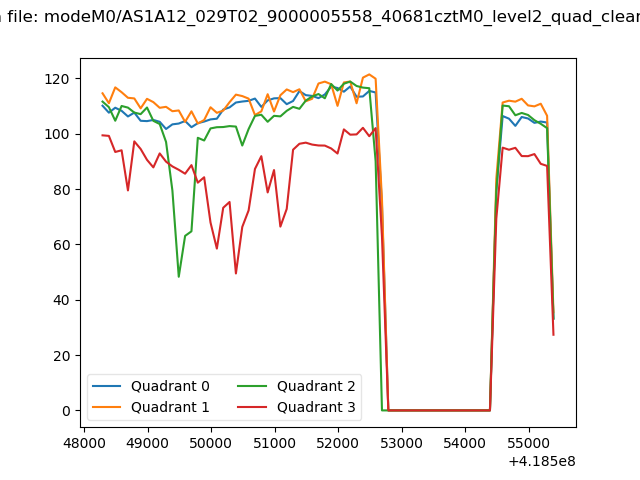 |
|
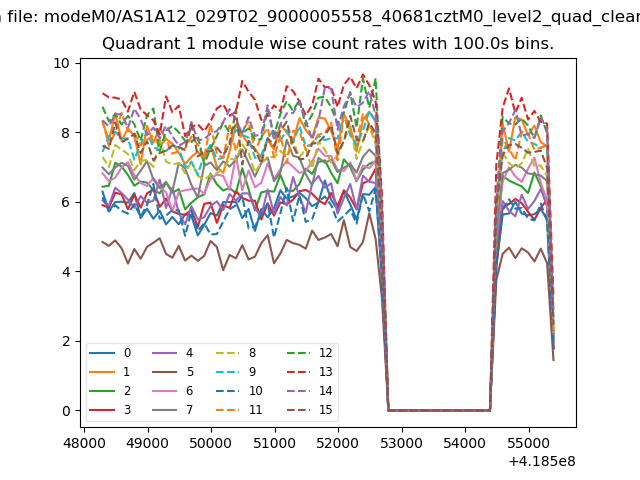
| Module-wise count rates for Quadrant A Data is divided into 100 sec bins |
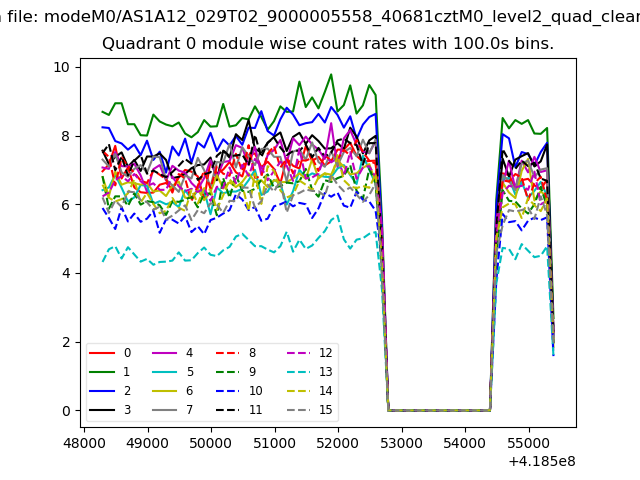 |
 |
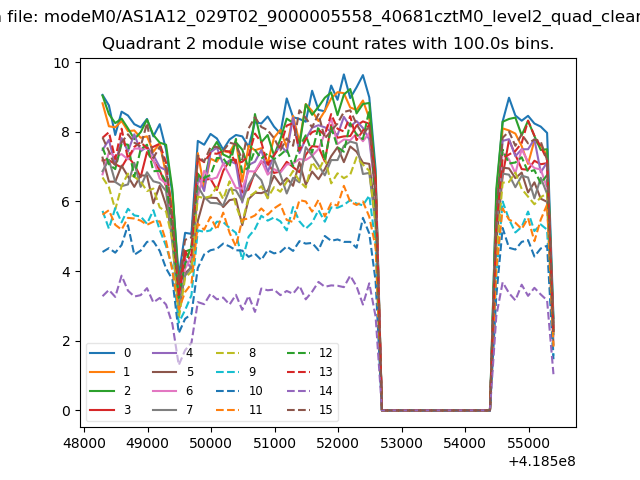
| Module-wise count rates for Quadrant B Data is divided into 100 sec bins |
 |
 |
| Module-wise count rates for Quadrant C Data is divided into 100 sec bins |
 |
 |
| Module-wise count rates for Quadrant D Data is divided into 100 sec bins |
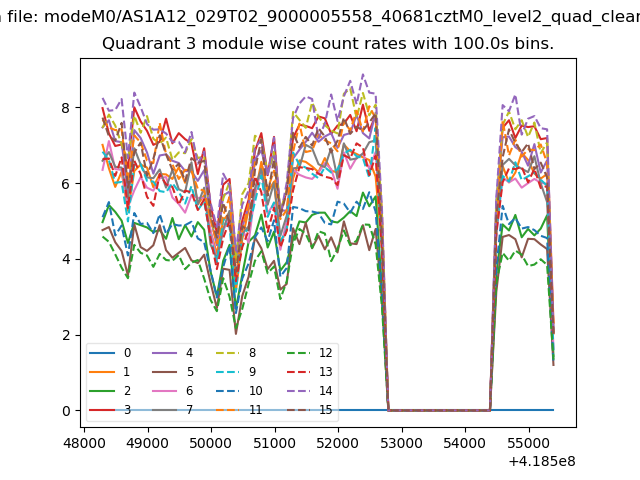 |
 |
| Parameter | Plot |
|---|---|
| CZT HV Monitor | 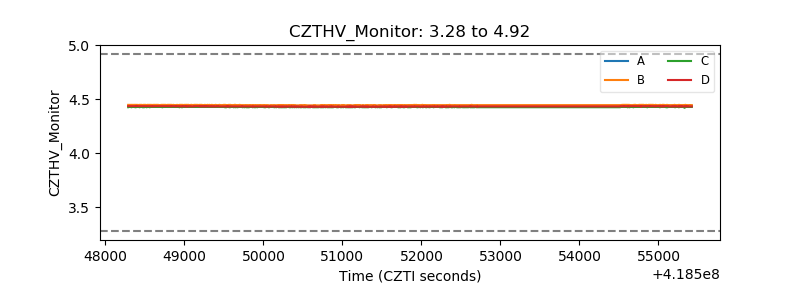 |
| D_VDD | 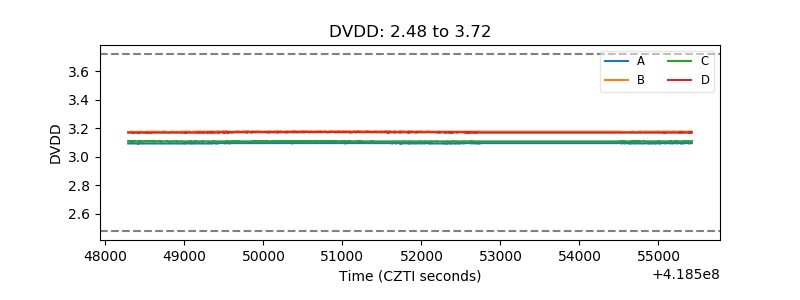 |
| Temperature 1 | 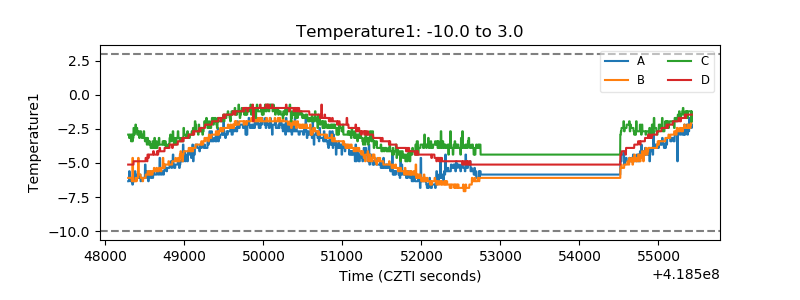 |
| Veto HV Monitor | 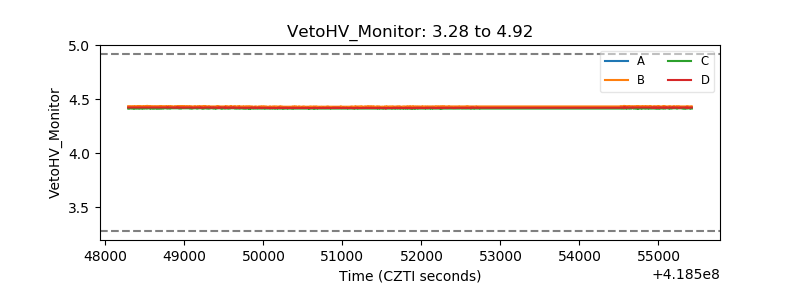 |
| Veto LLD | 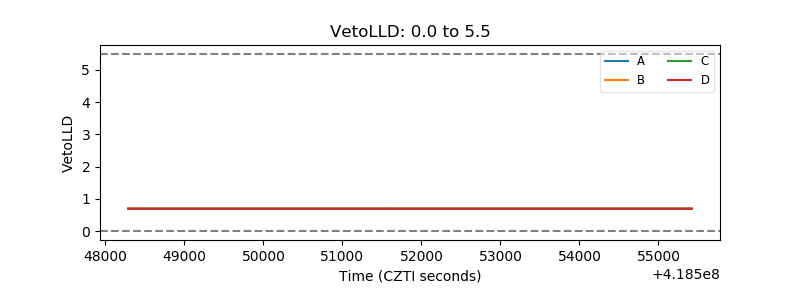 |
| Alpha Counter | 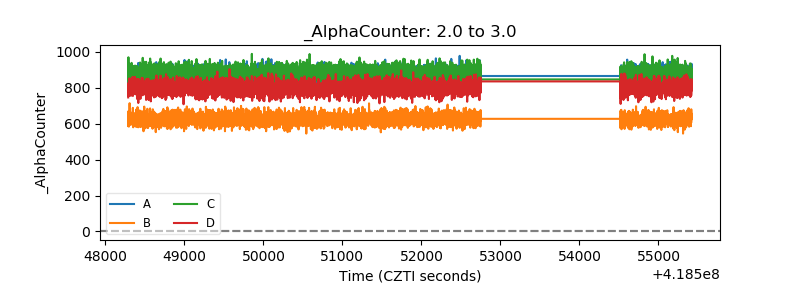 |
| _CPM_Rate | 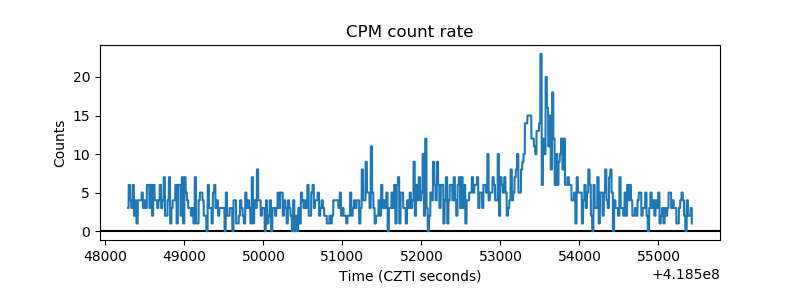 |
| CZT Counter | 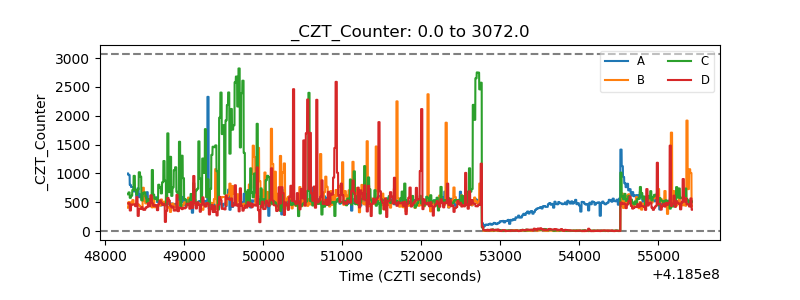 |
| +2.5 Volts monitor | 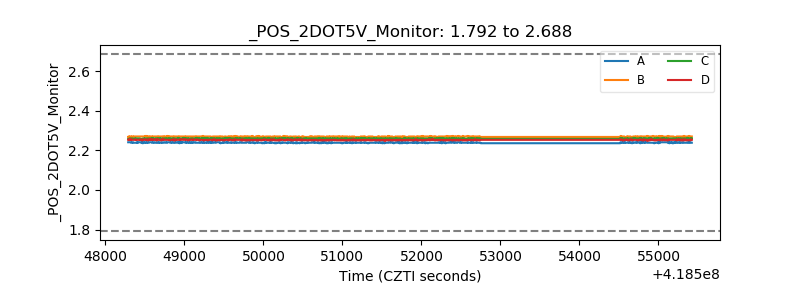 |
| +5 Volts monitor | 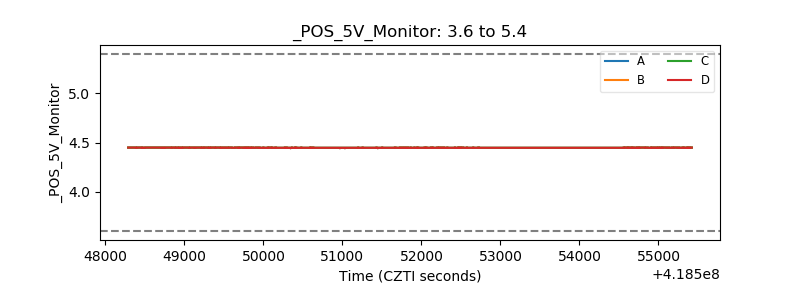 |
| _ROLL_ROT | 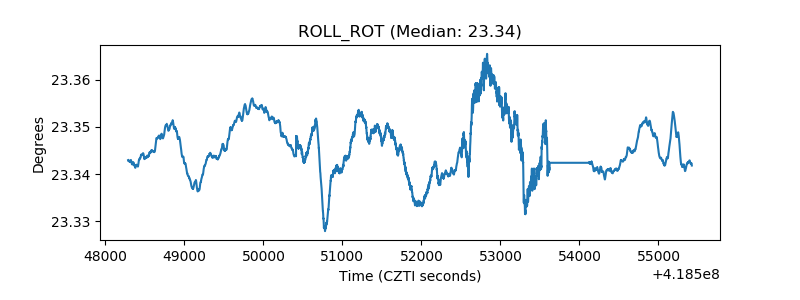 |
| _Roll_DEC | 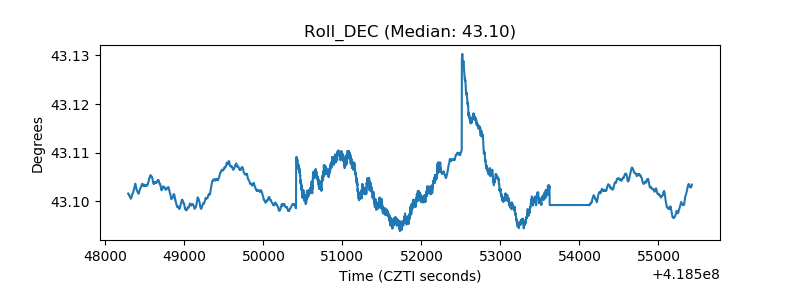 |
| _Roll_RA | 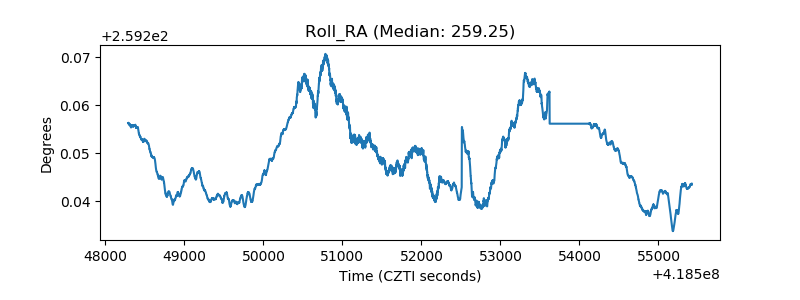 |
| Veto Counter | 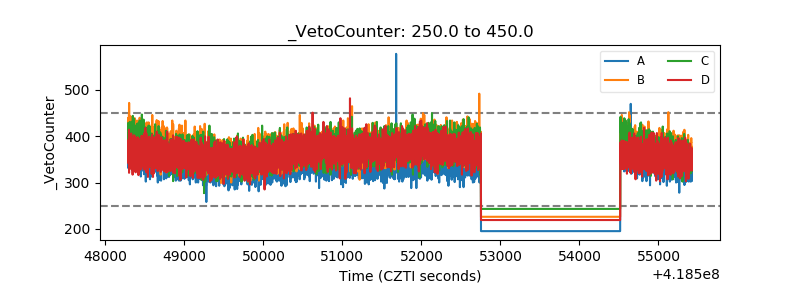 |