| Param | Original file | Final file |
|---|---|---|
| Filename | modeM0/AS1A12_029T02_9000005558_40682cztM0_level2.fits | modeM0/AS1A12_029T02_9000005558_40682cztM0_level2_quad_clean.evt |
| Size (bytes) | 358,637,760 | 89,055,360 |
| Size | 342.0 MB | 84.9 MB |
| Events in quadrant A | 3,054,149 | 628,654 |
| Events in quadrant B | 3,315,070 | 642,512 |
| Events in quadrant C | 2,935,288 | 613,735 |
| Events in quadrant D | 3,519,497 | 407,308 |
| Mode M0 | |||
|---|---|---|---|
| Quadrant | BADHDUFLAG | Total packets | Discarded packets |
| A | 0 | 12364 | 3 |
| B | 0 | 13602 | 2 |
| C | 0 | 12182 | 2 |
| D | 0 | 14715 | 2 |
| Mode M9 | |||
|---|---|---|---|
| Quadrant | BADHDUFLAG | Total packets | Discarded packets |
| A | 0 | 17 | 0 |
| B | 0 | 17 | 0 |
| C | 0 | 17 | 0 |
| D | 0 | 18 | 0 |
| Mode SS | |||
|---|---|---|---|
| Quadrant | BADHDUFLAG | Total packets | Discarded packets |
| A | 0 | 118 | 0 |
| B | 0 | 118 | 0 |
| C | 0 | 118 | 0 |
| D | 0 | 118 | 0 |
| Quadrant | Total seconds | Saturated seconds | Saturation percentage |
|---|---|---|---|
| A | 5778 | 12 | 0.207684% |
| B | 5778 | 80 | 1.384562% |
| C | 5778 | 10 | 0.173070% |
| D | 5778 | 1733 | 29.993077% |
Noise dominated data is calculated using 1-second bins in cleaned event files. If a bin has >2000 counts, and if more than 50% of those come from <1% of pixels, then it is considered to be noise-dominated and hence unusable.
| Quadrant | # 1 sec bins | Bins with >0 counts | Bins with >2000 counts | High rate bins dominated by noise | Noise dominated (total time) | Noise dominated (detector-on time) | Marked lightcurve |
|---|---|---|---|---|---|---|---|
| A | 7209 | 5779 | 3 | 3 | 0.04% | 0.05% | 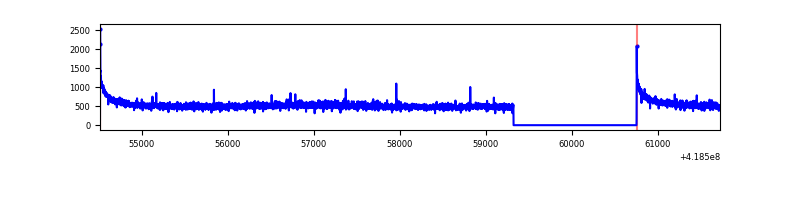 |
| B | 7209 | 5779 | 48 | 48 | 0.67% | 0.83% | 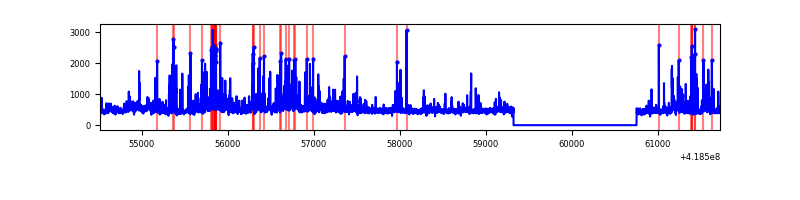 |
| C | 7209 | 5779 | 8 | 8 | 0.11% | 0.14% | 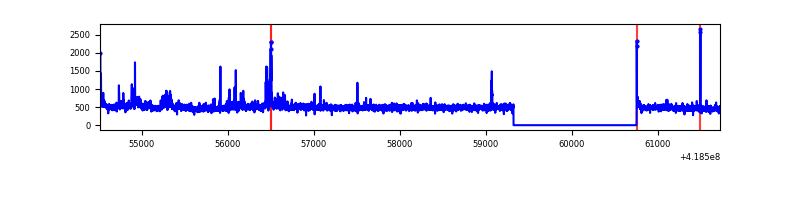 |
| D | 7209 | 5779 | 135 | 135 | 1.87% | 2.34% | 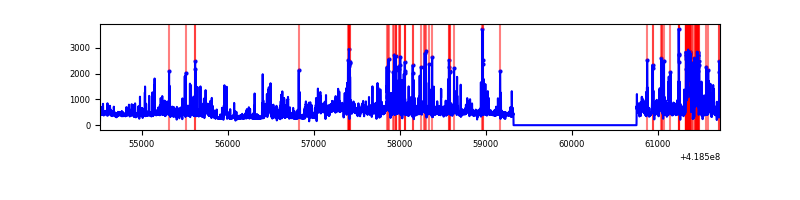 |
Top three noisy pixels from each quadrant. If the there are fewer than three noisy pixels in the level2.evt file, extra rows are filled as -1
| Pixel properties | Quadrant properties | ||||||
|---|---|---|---|---|---|---|---|
| Quadrant | DetID | PixID | Counts | Sigma | Mean | Median | Sigma |
| A | 10 | 83 | 544210 | 4143.24 | 641 | 627 | 131.2 |
| A | 12 | 189 | 19319 | 142.47 | 641 | 627 | 131.2 |
| A | 13 | 6 | 11580 | 83.48 | 641 | 627 | 131.2 |
| B | 0 | 229 | 307750 | 2434.55 | 634 | 617 | 126.2 |
| B | 5 | 255 | 180048 | 1422.29 | 634 | 617 | 126.2 |
| B | 0 | 190 | 115969 | 914.36 | 634 | 617 | 126.2 |
| C | 15 | 214 | 253294 | 1729.78 | 624 | 628 | 146.1 |
| C | 9 | 187 | 140452 | 957.25 | 624 | 628 | 146.1 |
| C | 14 | 254 | 64013 | 433.94 | 624 | 628 | 146.1 |
| D | 12 | 227 | 339119 | 2724.61 | 498 | 484 | 124.3 |
| D | 12 | 191 | 316947 | 2546.21 | 498 | 484 | 124.3 |
| D | 2 | 250 | 219096 | 1758.92 | 498 | 484 | 124.3 |
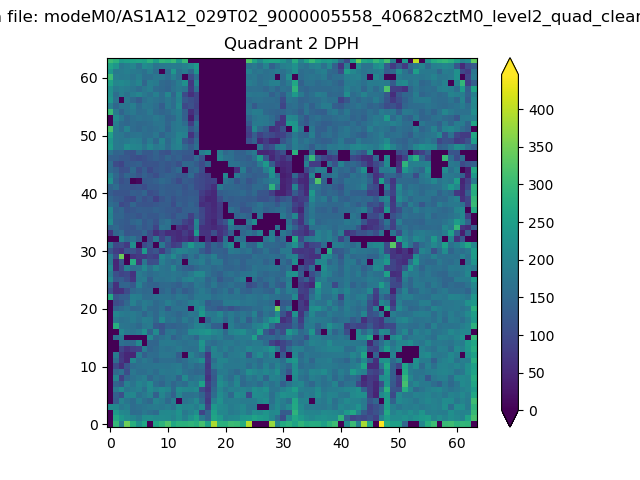
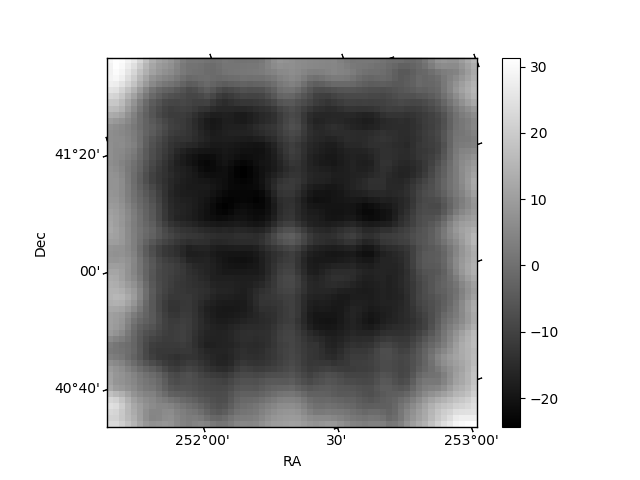
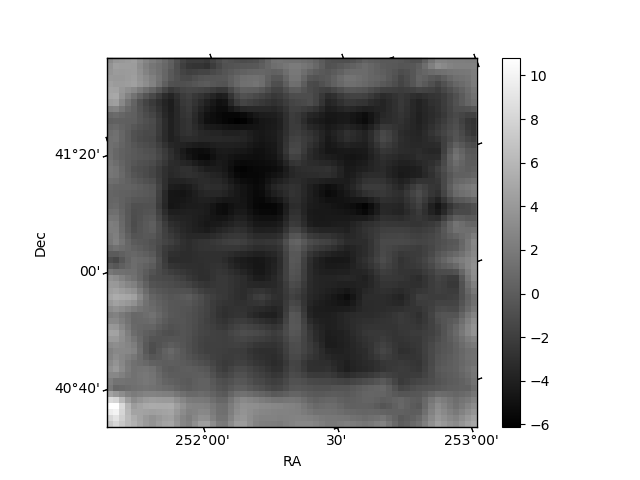
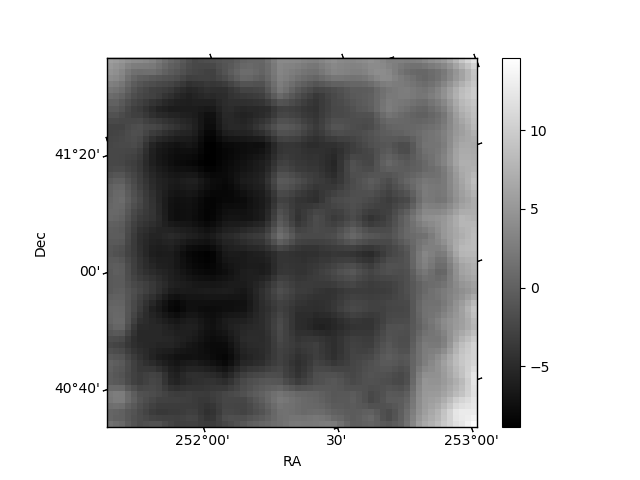
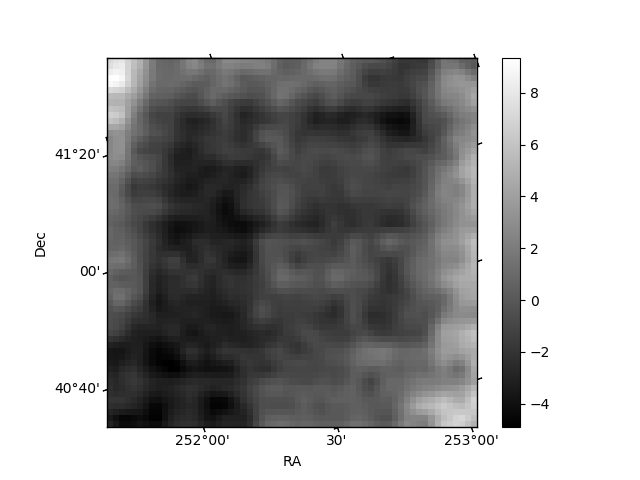
Histogram calculated using DETX and DETY for each event in the final _common_clean file
| Quadrant A | 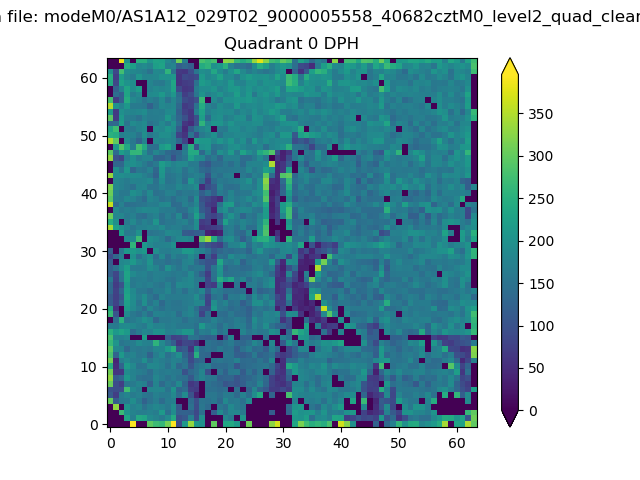 |
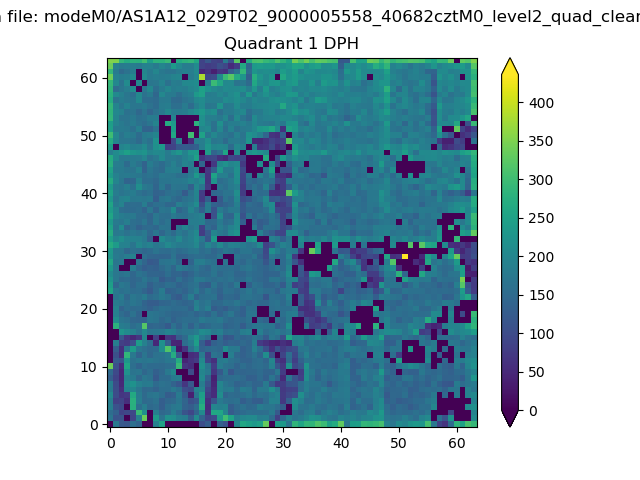 |
Quadrant B |
|---|---|---|---|
| Quadrant D | 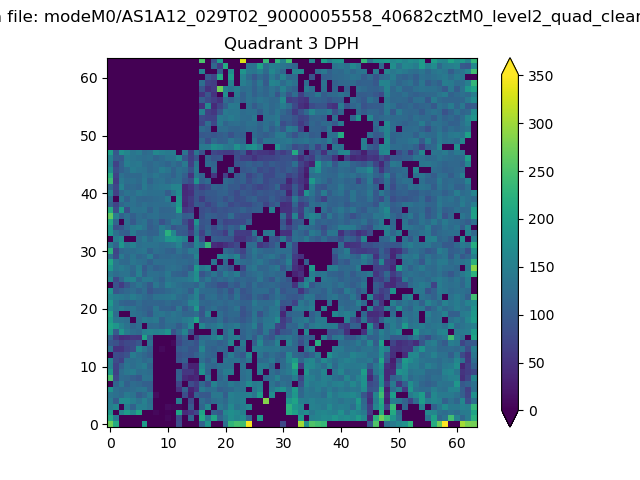 |
 |
Quadrant C |
| Plot type | Count rate plots | Images |
|---|---|---|
| Comparison with Poisson distribution Blue bars denote a histogram of data divided into 1 sec bins. Red curve is a Poisson curve with rate = median count rate of data. |
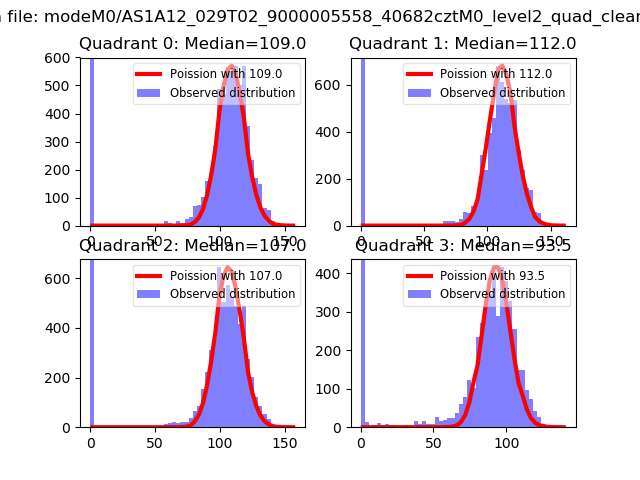 |
 |
| Quadrant-wise count rates Data is divided into 100 sec bins |
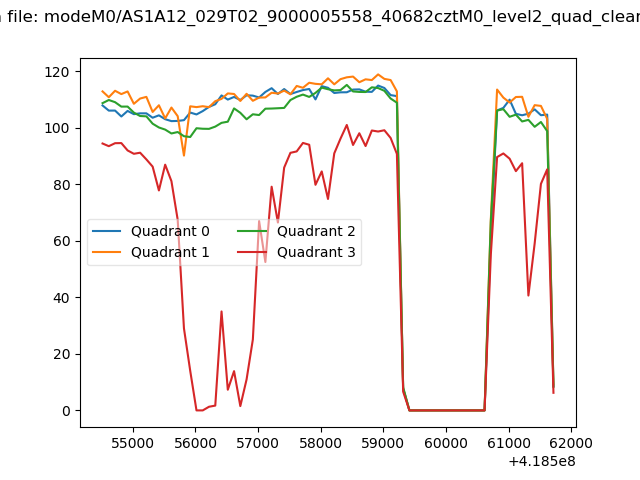 |
|
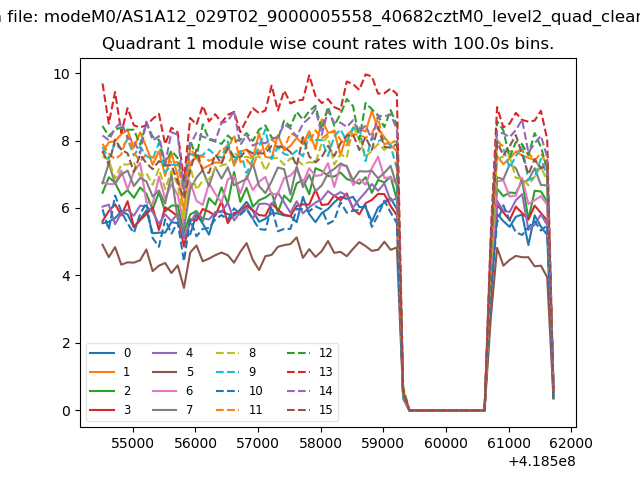
| Module-wise count rates for Quadrant A Data is divided into 100 sec bins |
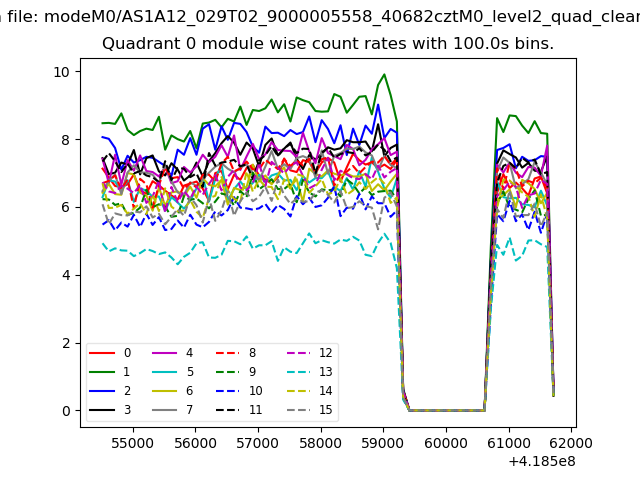 |
 |
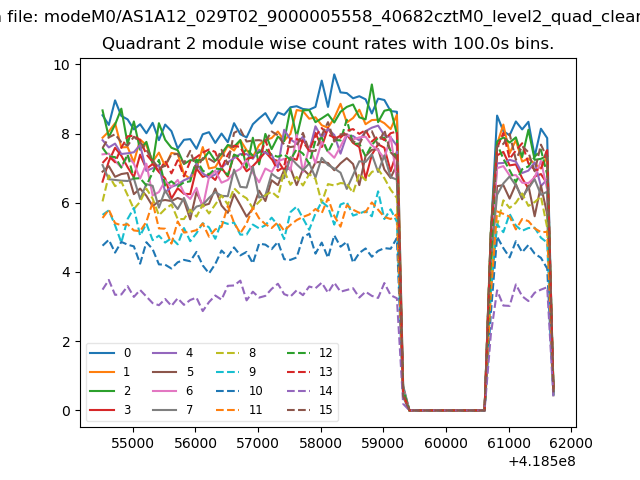
| Module-wise count rates for Quadrant B Data is divided into 100 sec bins |
 |
 |
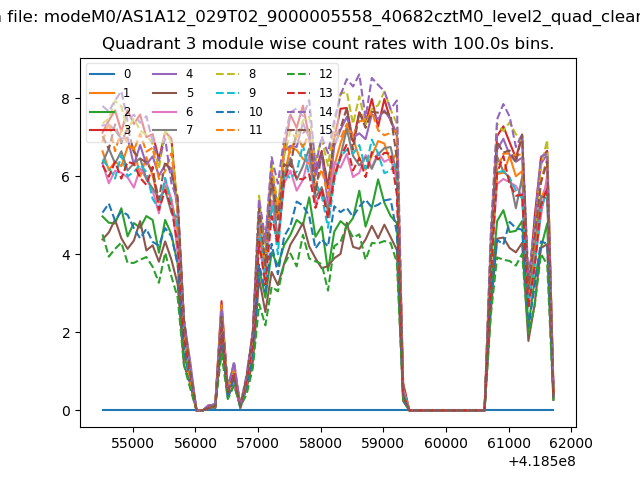
| Module-wise count rates for Quadrant C Data is divided into 100 sec bins |
 |
 |
| Module-wise count rates for Quadrant D Data is divided into 100 sec bins |
 |
 |
| Parameter | Plot |
|---|---|
| CZT HV Monitor | 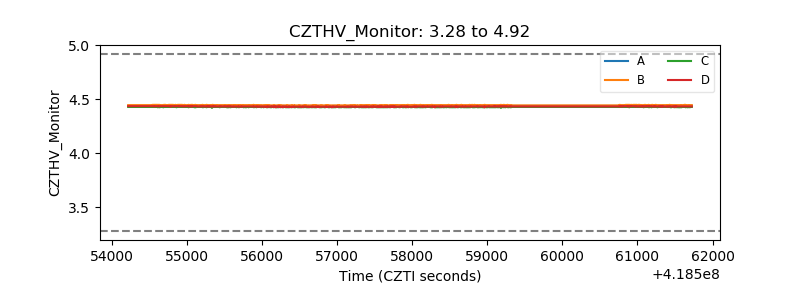 |
| D_VDD |  |
| Temperature 1 | 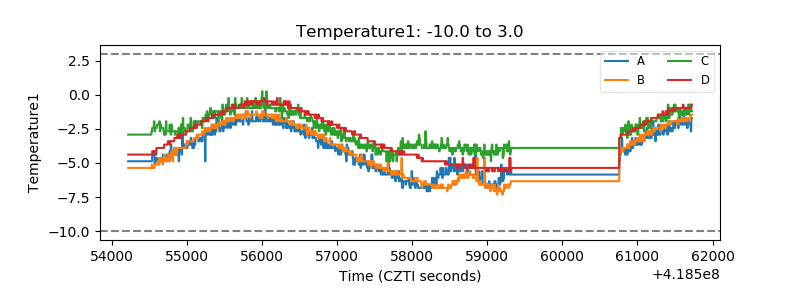 |
| Veto HV Monitor | 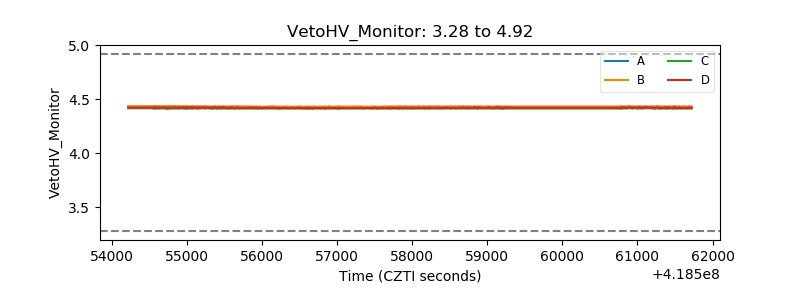 |
| Veto LLD | 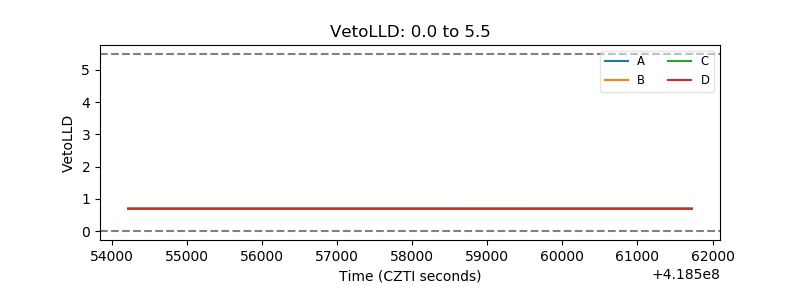 |
| Alpha Counter | 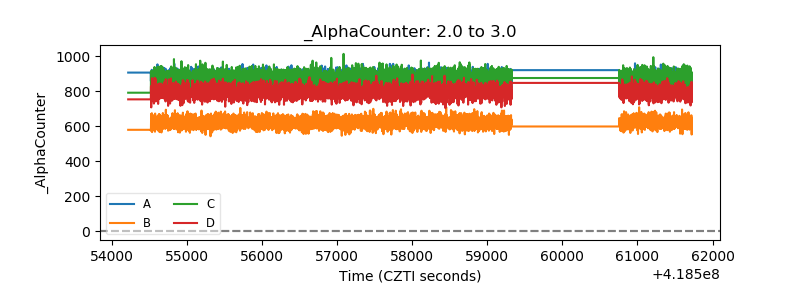 |
| _CPM_Rate | 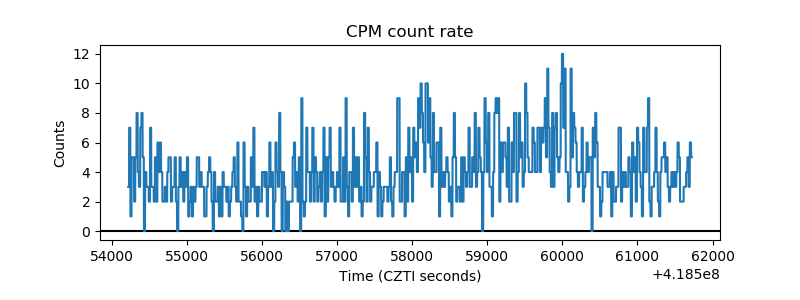 |
| CZT Counter | 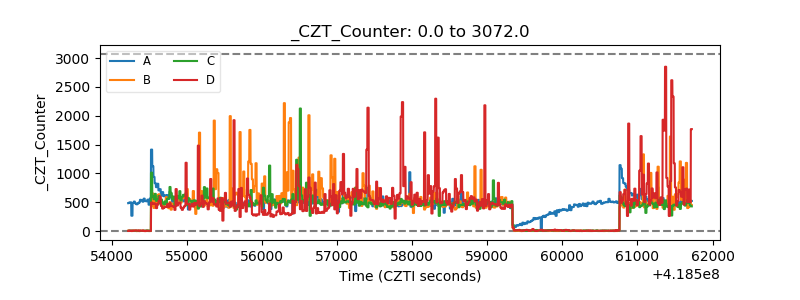 |
| +2.5 Volts monitor | 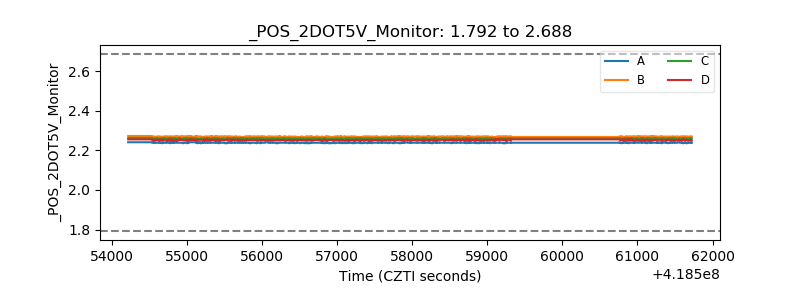 |
| +5 Volts monitor | 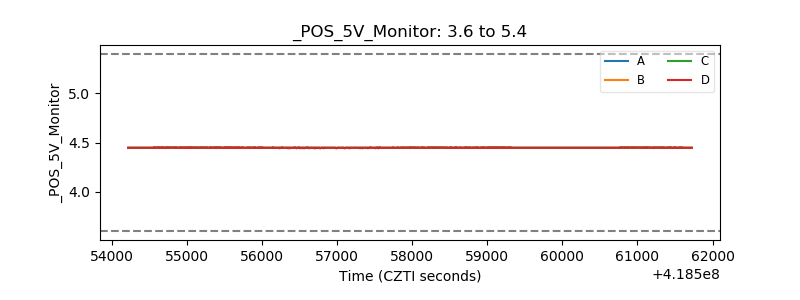 |
| _ROLL_ROT | 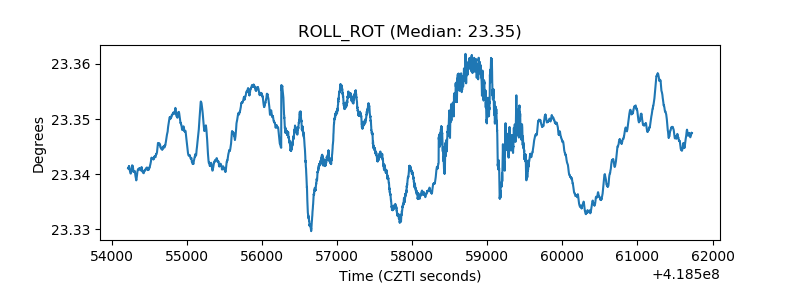 |
| _Roll_DEC | 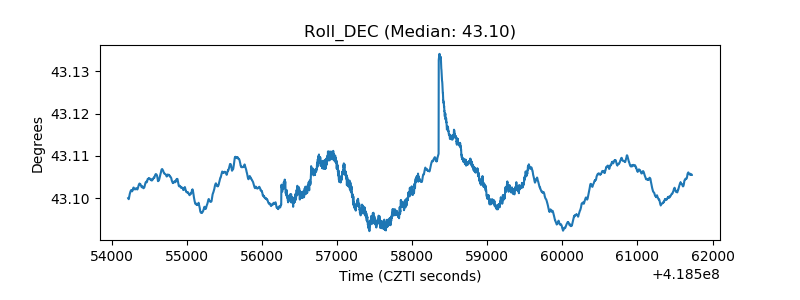 |
| _Roll_RA | 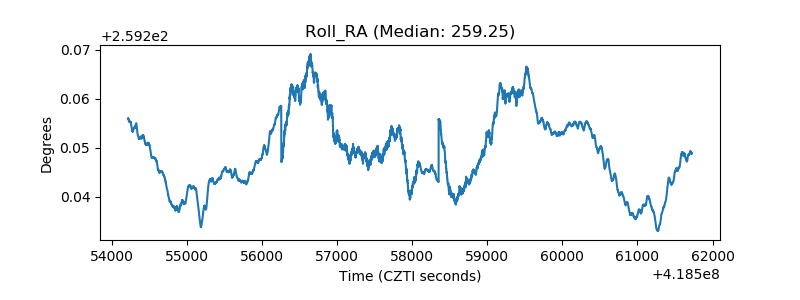 |
| Veto Counter | 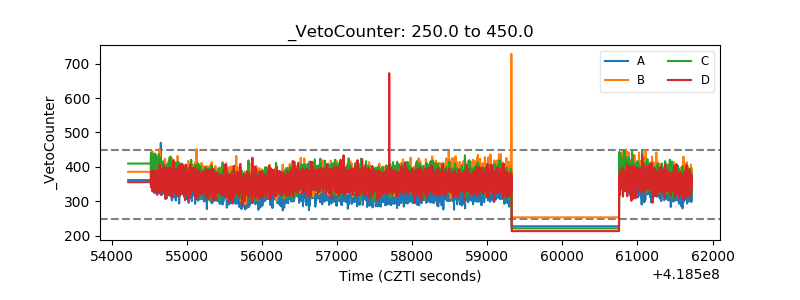 |