| Param | Original file | Final file |
|---|---|---|
| Filename | modeM0/AS1A12_029T02_9000005558_40683cztM0_level2.fits | modeM0/AS1A12_029T02_9000005558_40683cztM0_level2_quad_clean.evt |
| Size (bytes) | 380,620,800 | 93,818,880 |
| Size | 363.0 MB | 89.5 MB |
| Events in quadrant A | 3,135,944 | 645,245 |
| Events in quadrant B | 3,269,597 | 658,544 |
| Events in quadrant C | 2,890,744 | 626,720 |
| Events in quadrant D | 4,328,977 | 493,864 |
| Mode M0 | |||
|---|---|---|---|
| Quadrant | BADHDUFLAG | Total packets | Discarded packets |
| A | 0 | 12753 | 3 |
| B | 0 | 13529 | 2 |
| C | 0 | 12196 | 2 |
| D | 0 | 16980 | 2 |
| Mode M9 | |||
|---|---|---|---|
| Quadrant | BADHDUFLAG | Total packets | Discarded packets |
| A | 0 | 20 | 0 |
| B | 0 | 20 | 0 |
| C | 0 | 20 | 0 |
| D | 0 | 21 | 0 |
| Mode SS | |||
|---|---|---|---|
| Quadrant | BADHDUFLAG | Total packets | Discarded packets |
| A | 0 | 120 | 0 |
| B | 0 | 120 | 0 |
| C | 0 | 120 | 0 |
| D | 0 | 120 | 0 |
| Quadrant | Total seconds | Saturated seconds | Saturation percentage |
|---|---|---|---|
| A | 5952 | 13 | 0.218414% |
| B | 5952 | 84 | 1.411290% |
| C | 5952 | 10 | 0.168011% |
| D | 5952 | 1063 | 17.859543% |
Noise dominated data is calculated using 1-second bins in cleaned event files. If a bin has >2000 counts, and if more than 50% of those come from <1% of pixels, then it is considered to be noise-dominated and hence unusable.
| Quadrant | # 1 sec bins | Bins with >0 counts | Bins with >2000 counts | High rate bins dominated by noise | Noise dominated (total time) | Noise dominated (detector-on time) | Marked lightcurve |
|---|---|---|---|---|---|---|---|
| A | 7264 | 5953 | 3 | 3 | 0.04% | 0.05% | 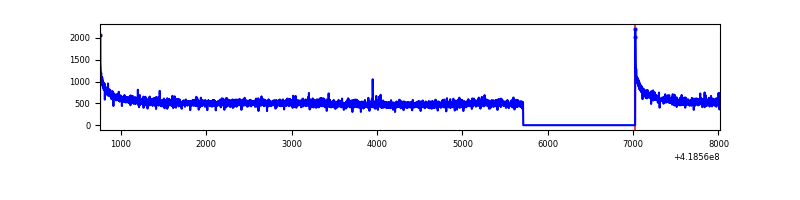 |
| B | 7264 | 5953 | 49 | 49 | 0.67% | 0.82% | 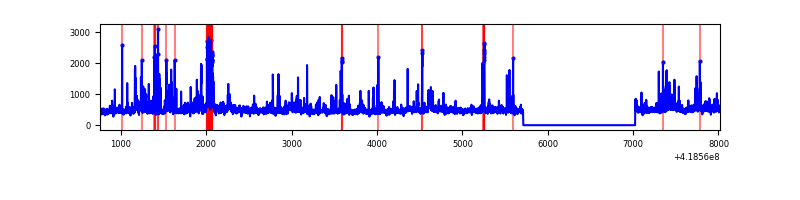 |
| C | 7264 | 5953 | 9 | 9 | 0.12% | 0.15% | 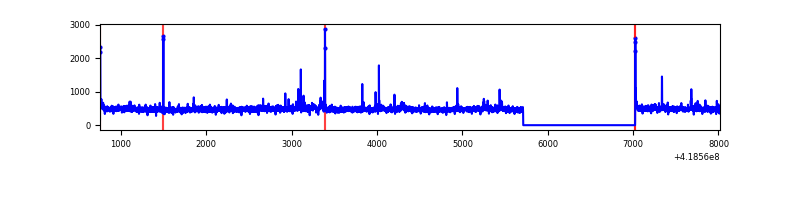 |
| D | 7264 | 5953 | 316 | 316 | 4.35% | 5.31% | 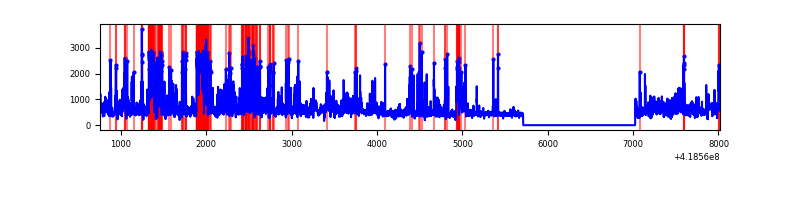 |
Top three noisy pixels from each quadrant. If the there are fewer than three noisy pixels in the level2.evt file, extra rows are filled as -1
| Pixel properties | Quadrant properties | ||||||
|---|---|---|---|---|---|---|---|
| Quadrant | DetID | PixID | Counts | Sigma | Mean | Median | Sigma |
| A | 10 | 83 | 550735 | 4030.88 | 662 | 648 | 136.5 |
| A | 12 | 189 | 22493 | 160.07 | 662 | 648 | 136.5 |
| A | 13 | 254 | 7857 | 52.83 | 662 | 648 | 136.5 |
| B | 0 | 229 | 258736 | 2022.8 | 655 | 637 | 127.6 |
| B | 5 | 255 | 98061 | 763.54 | 655 | 637 | 127.6 |
| B | 15 | 85 | 86971 | 676.63 | 655 | 637 | 127.6 |
| C | 15 | 214 | 260750 | 1723.85 | 643 | 647 | 150.9 |
| C | 9 | 187 | 71082 | 466.81 | 643 | 647 | 150.9 |
| C | 0 | 10 | 18148 | 115.99 | 643 | 647 | 150.9 |
| D | 12 | 227 | 725950 | 4961.48 | 587 | 570 | 146.2 |
| D | 2 | 249 | 207389 | 1414.61 | 587 | 570 | 146.2 |
| D | 13 | 171 | 206337 | 1407.41 | 587 | 570 | 146.2 |
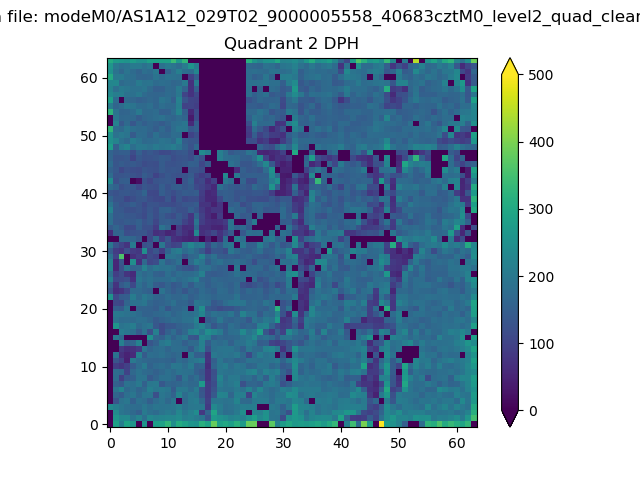
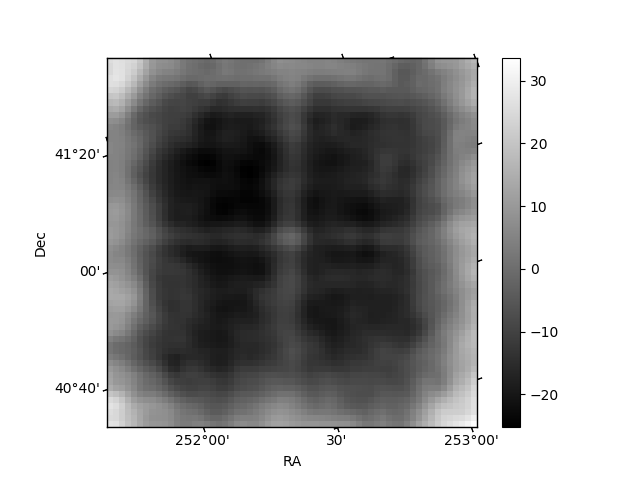
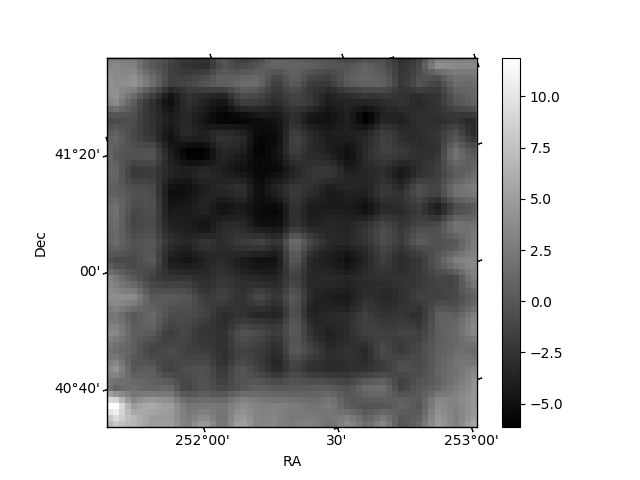
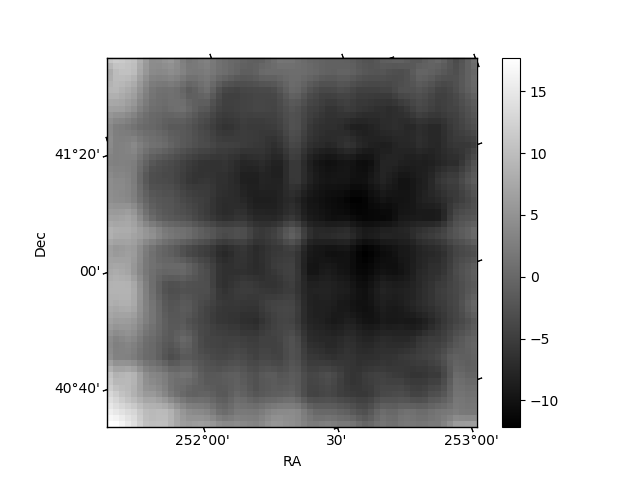
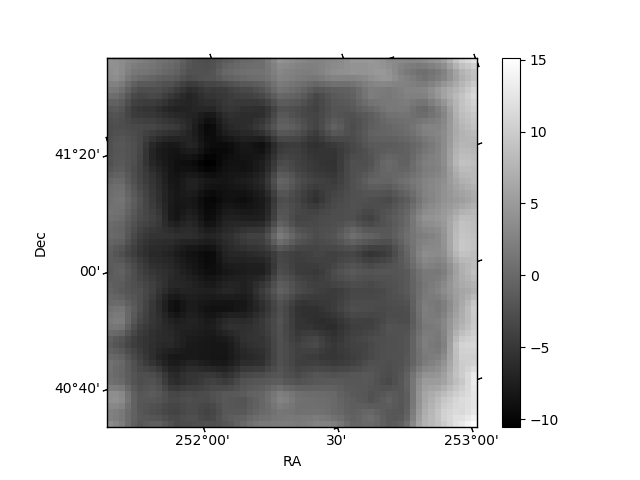
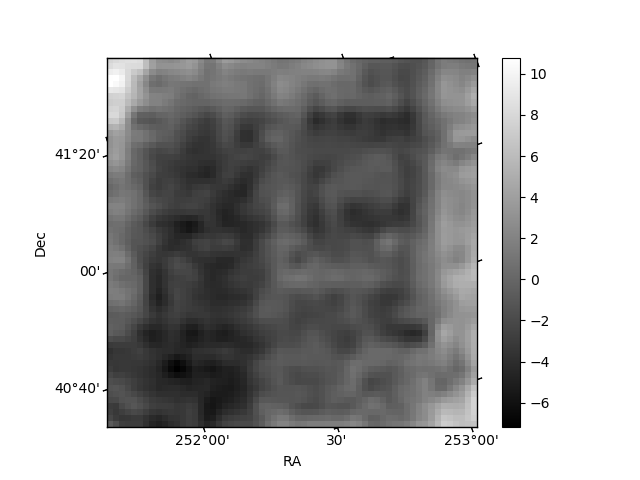
Histogram calculated using DETX and DETY for each event in the final _common_clean file
| Quadrant A | 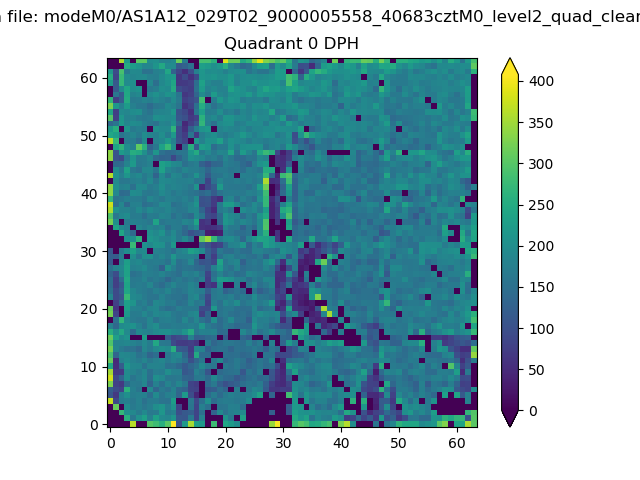 |
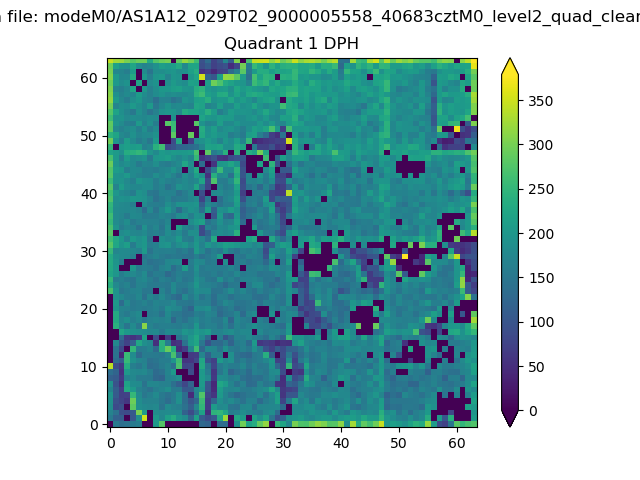 |
Quadrant B |
|---|---|---|---|
| Quadrant D | 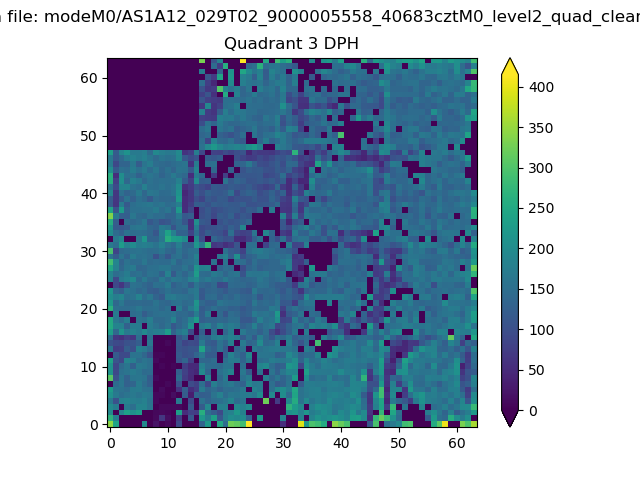 |
 |
Quadrant C |
| Plot type | Count rate plots | Images |
|---|---|---|
| Comparison with Poisson distribution Blue bars denote a histogram of data divided into 1 sec bins. Red curve is a Poisson curve with rate = median count rate of data. |
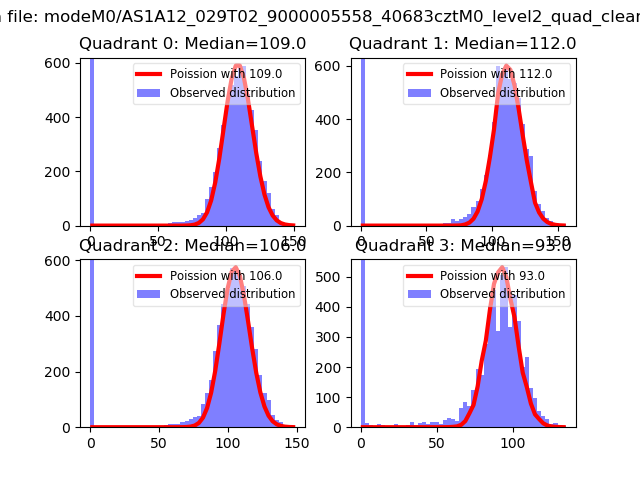 |
 |
| Quadrant-wise count rates Data is divided into 100 sec bins |
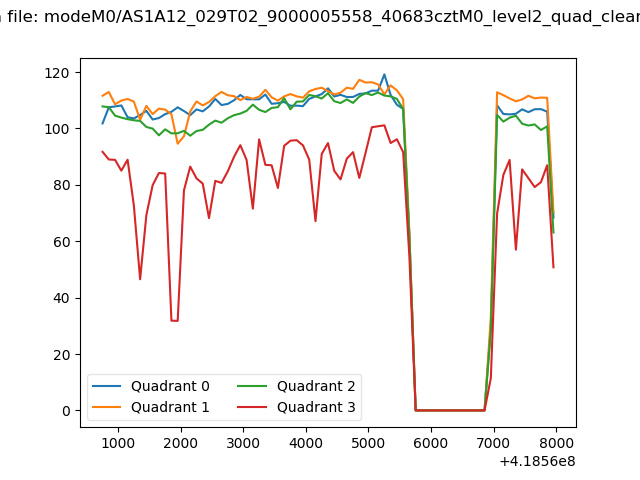 |
|
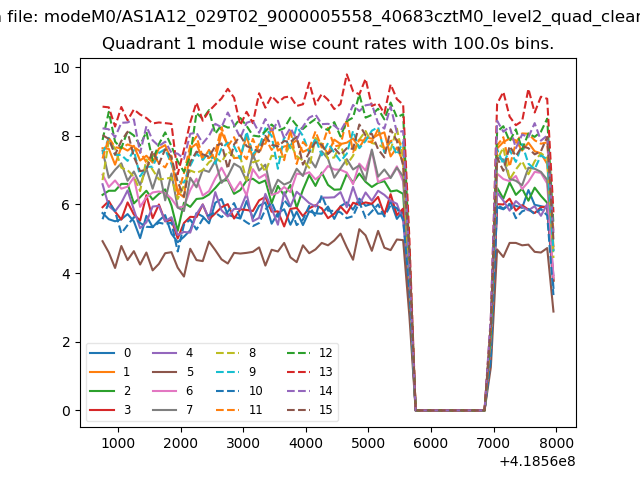
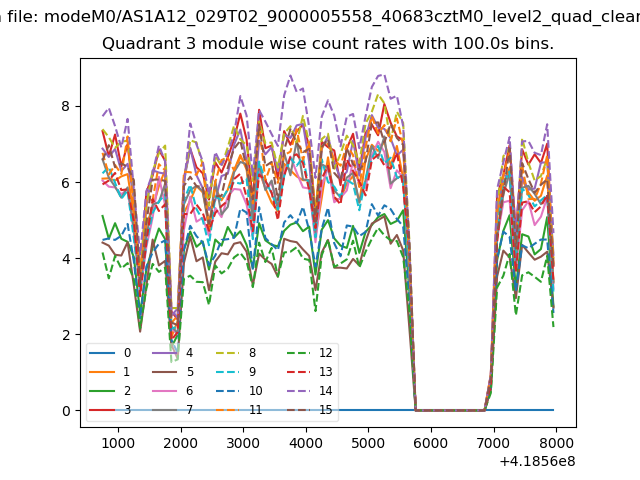
| Module-wise count rates for Quadrant A Data is divided into 100 sec bins |
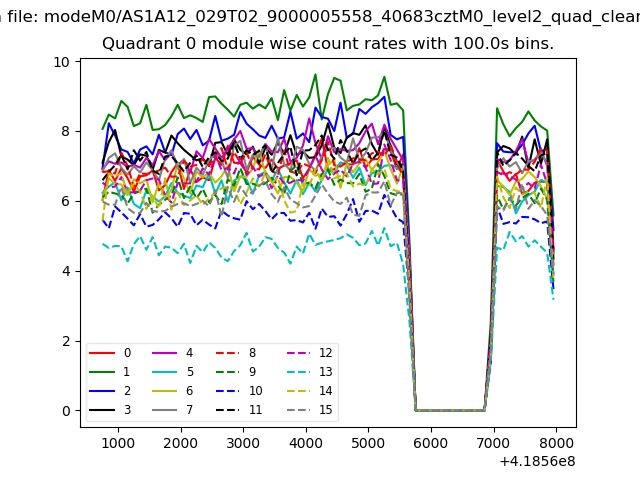 |
 |
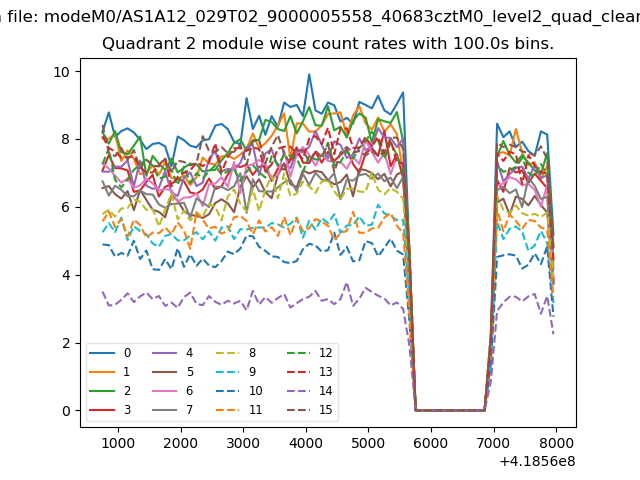
| Module-wise count rates for Quadrant B Data is divided into 100 sec bins |
 |
 |
| Module-wise count rates for Quadrant C Data is divided into 100 sec bins |
 |
 |
| Module-wise count rates for Quadrant D Data is divided into 100 sec bins |
 |
 |
| Parameter | Plot |
|---|---|
| CZT HV Monitor | 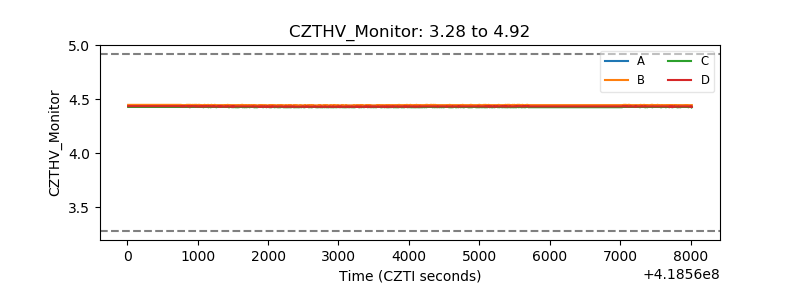 |
| D_VDD | 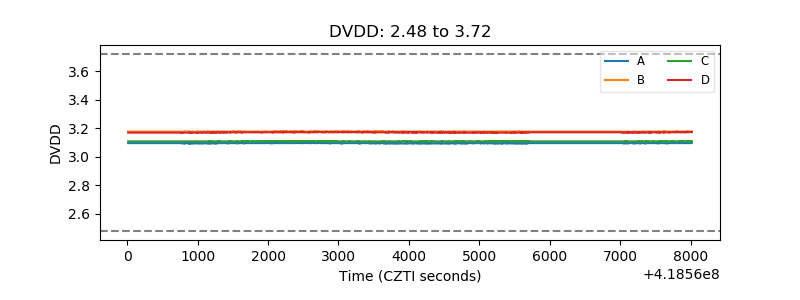 |
| Temperature 1 | 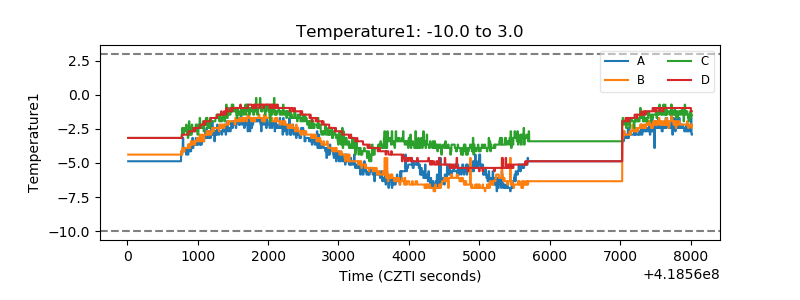 |
| Veto HV Monitor | 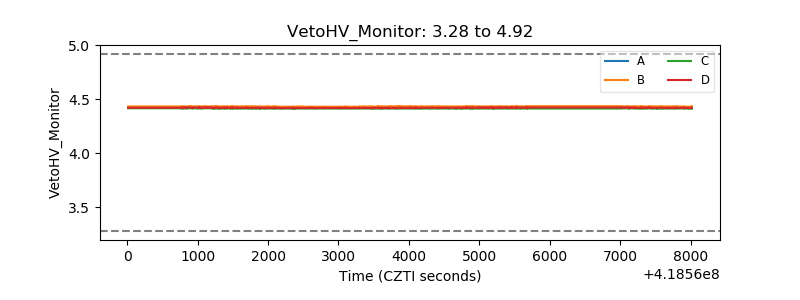 |
| Veto LLD | 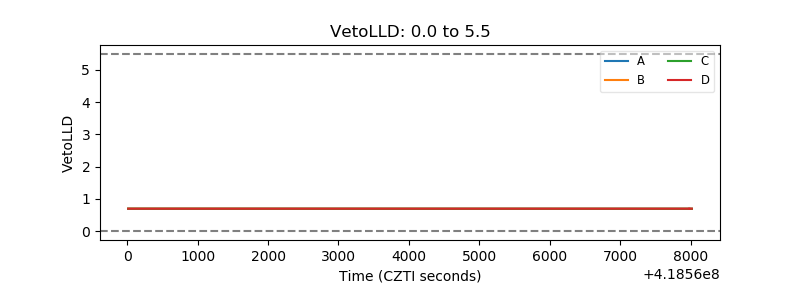 |
| Alpha Counter | 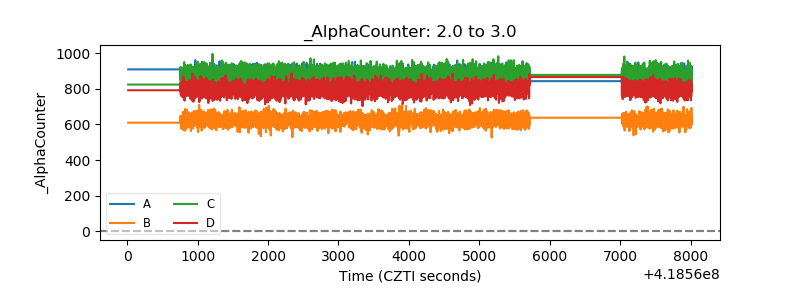 |
| _CPM_Rate | 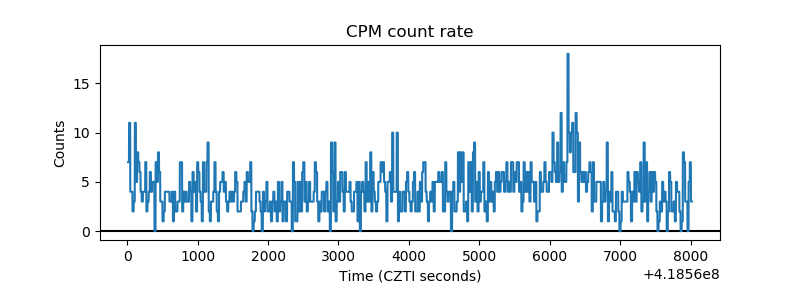 |
| CZT Counter | 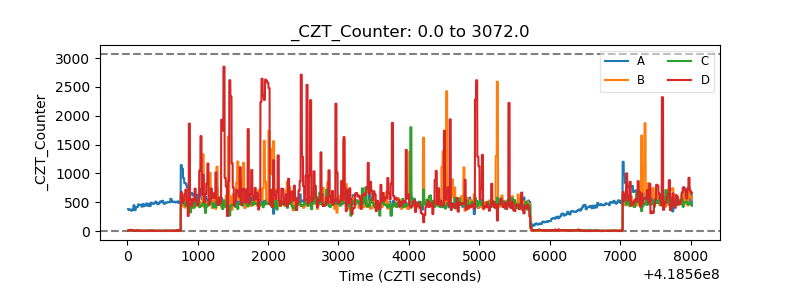 |
| +2.5 Volts monitor | 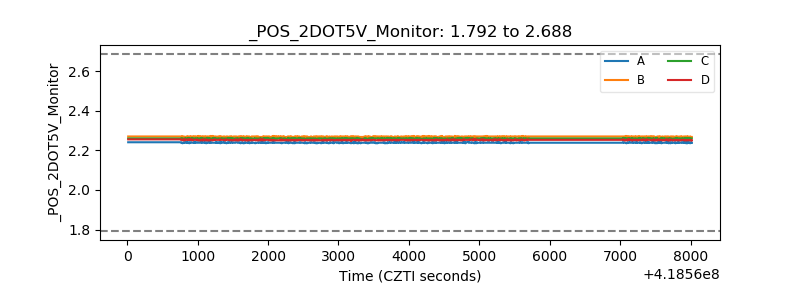 |
| +5 Volts monitor | 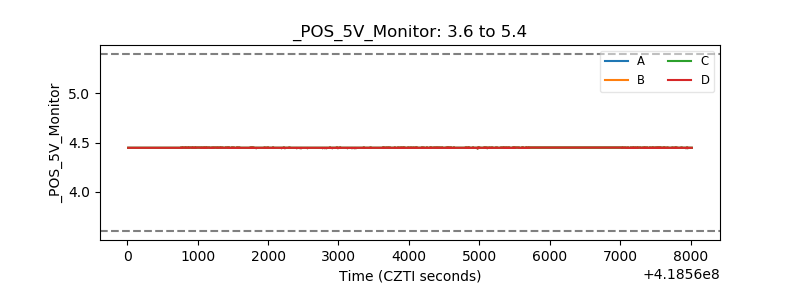 |
| _ROLL_ROT | 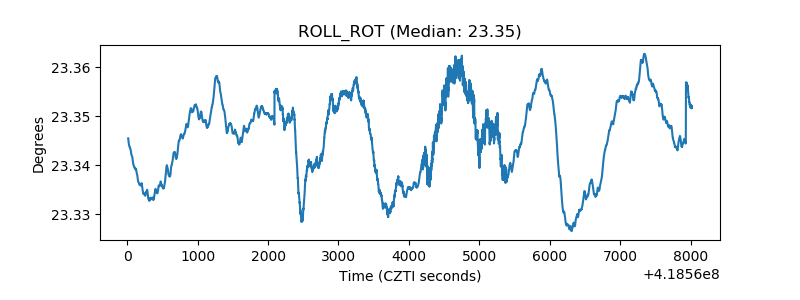 |
| _Roll_DEC | 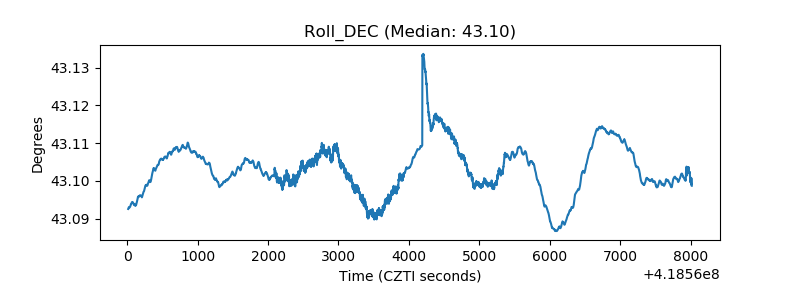 |
| _Roll_RA | 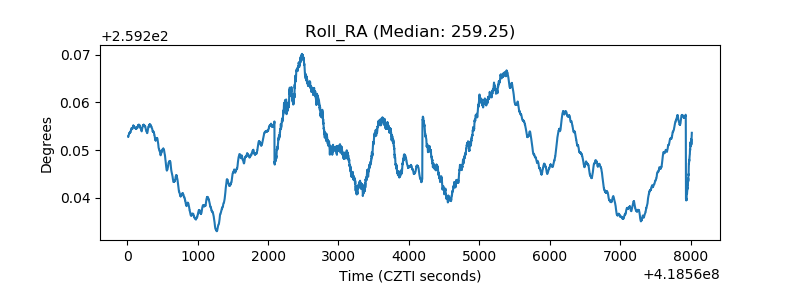 |
| Veto Counter | 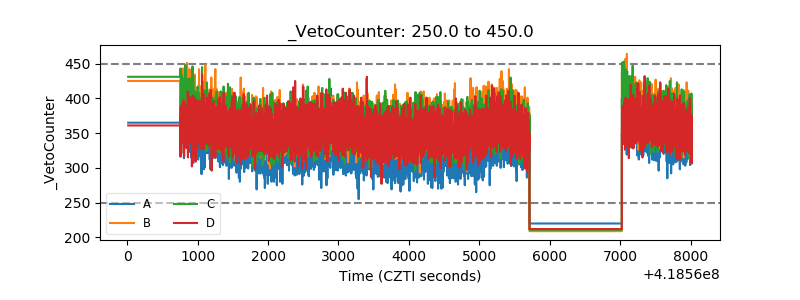 |