| Param | Original file | Final file |
|---|---|---|
| Filename | modeM0/AS1A12_029T02_9000005558_40686cztM0_level2.fits | modeM0/AS1A12_029T02_9000005558_40686cztM0_level2_quad_clean.evt |
| Size (bytes) | 946,592,640 | 246,481,920 |
| Size | 902.7 MB | 235.1 MB |
| Events in quadrant A | 8,265,625 | 1,687,291 |
| Events in quadrant B | 8,376,765 | 1,729,013 |
| Events in quadrant C | 8,230,169 | 1,656,096 |
| Events in quadrant D | 8,954,290 | 1,311,605 |
| Mode M0 | |||
|---|---|---|---|
| Quadrant | BADHDUFLAG | Total packets | Discarded packets |
| A | 0 | 34153 | 5 |
| B | 0 | 35205 | 4 |
| C | 0 | 34050 | 4 |
| D | 0 | 37550 | 4 |
| Mode M9 | |||
|---|---|---|---|
| Quadrant | BADHDUFLAG | Total packets | Discarded packets |
| A | 0 | 54 | 0 |
| B | 0 | 54 | 0 |
| C | 0 | 54 | 0 |
| D | 0 | 55 | 0 |
| Mode SS | |||
|---|---|---|---|
| Quadrant | BADHDUFLAG | Total packets | Discarded packets |
| A | 0 | 318 | 0 |
| B | 0 | 318 | 0 |
| C | 0 | 318 | 0 |
| D | 0 | 318 | 0 |
| Quadrant | Total seconds | Saturated seconds | Saturation percentage |
|---|---|---|---|
| A | 15629 | 36 | 0.230341% |
| B | 15629 | 135 | 0.863779% |
| C | 15629 | 89 | 0.569454% |
| D | 15629 | 2376 | 15.202508% |
Noise dominated data is calculated using 1-second bins in cleaned event files. If a bin has >2000 counts, and if more than 50% of those come from <1% of pixels, then it is considered to be noise-dominated and hence unusable.
| Quadrant | # 1 sec bins | Bins with >0 counts | Bins with >2000 counts | High rate bins dominated by noise | Noise dominated (total time) | Noise dominated (detector-on time) | Marked lightcurve |
|---|---|---|---|---|---|---|---|
| A | 19809 | 15632 | 11 | 11 | 0.06% | 0.07% | 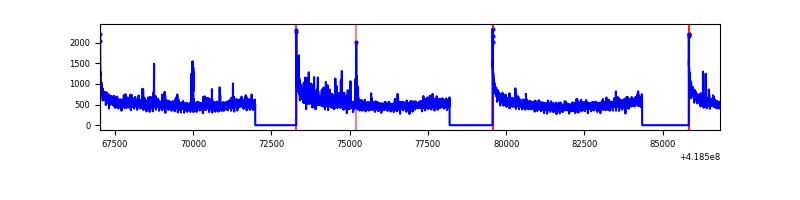 |
| B | 19809 | 15632 | 95 | 95 | 0.48% | 0.61% | 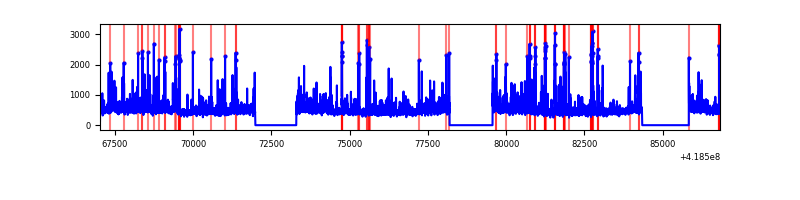 |
| C | 19809 | 15632 | 75 | 75 | 0.38% | 0.48% | 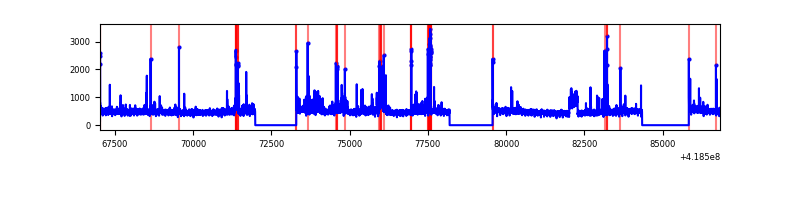 |
| D | 19809 | 15632 | 213 | 213 | 1.08% | 1.36% | 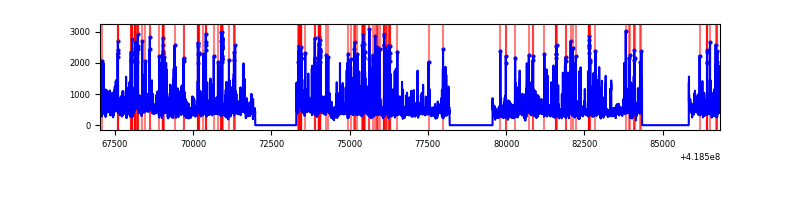 |
Top three noisy pixels from each quadrant. If the there are fewer than three noisy pixels in the level2.evt file, extra rows are filled as -1
| Pixel properties | Quadrant properties | ||||||
|---|---|---|---|---|---|---|---|
| Quadrant | DetID | PixID | Counts | Sigma | Mean | Median | Sigma |
| A | 10 | 83 | 1303860 | 3663.7 | 1731 | 1693 | 355.4 |
| A | 12 | 189 | 184278 | 513.71 | 1731 | 1693 | 355.4 |
| A | 6 | 10 | 72361 | 198.83 | 1731 | 1693 | 355.4 |
| B | 0 | 229 | 720028 | 2152.28 | 1721 | 1674 | 333.8 |
| B | 5 | 255 | 226855 | 674.67 | 1721 | 1674 | 333.8 |
| B | 0 | 190 | 224796 | 668.5 | 1721 | 1674 | 333.8 |
| C | 9 | 187 | 676183 | 1706.1 | 1694 | 1705 | 395.3 |
| C | 15 | 214 | 673418 | 1699.11 | 1694 | 1705 | 395.3 |
| C | 3 | 233 | 132492 | 330.83 | 1694 | 1705 | 395.3 |
| D | 2 | 249 | 685472 | 1791.01 | 1539 | 1498 | 381.9 |
| D | 12 | 191 | 589896 | 1540.74 | 1539 | 1498 | 381.9 |
| D | 12 | 227 | 468360 | 1222.49 | 1539 | 1498 | 381.9 |
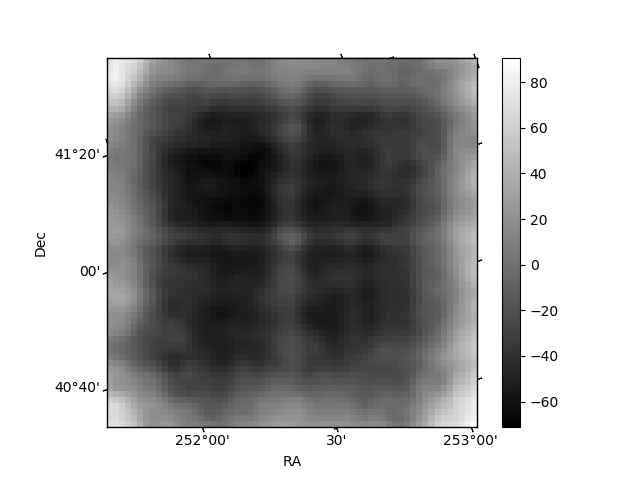
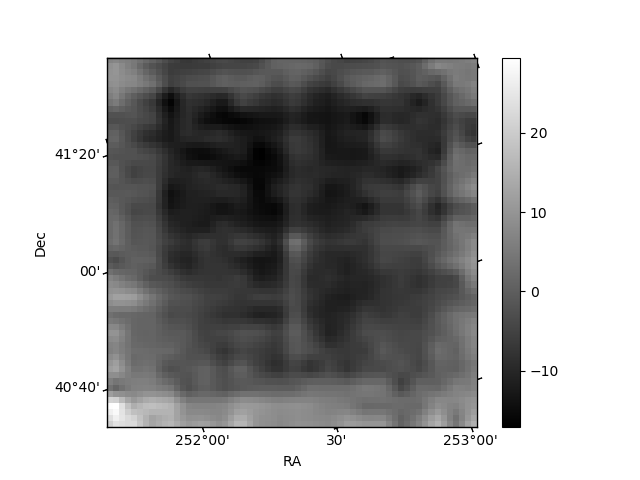
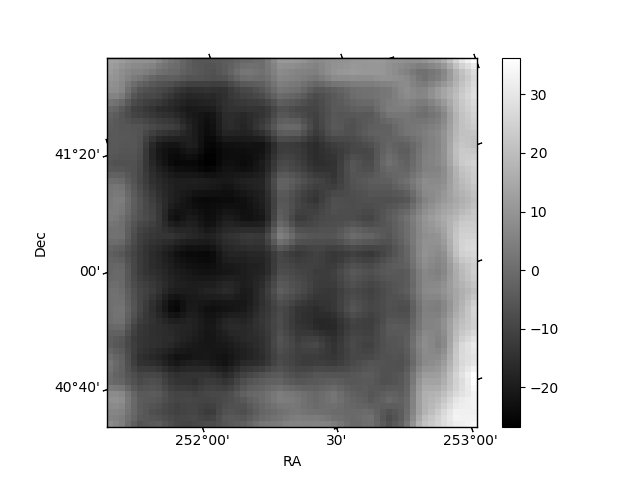
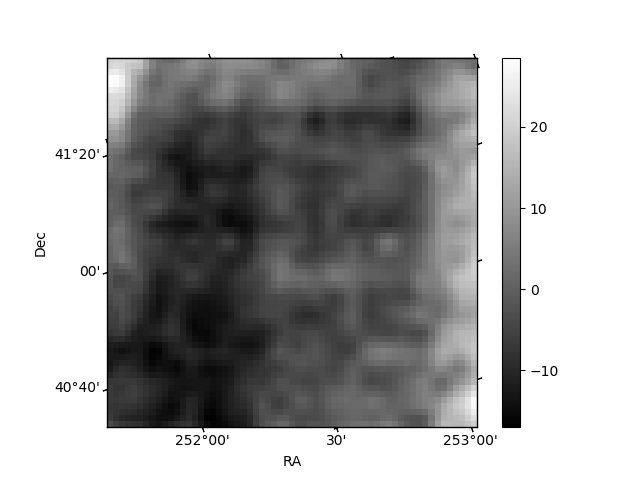
Histogram calculated using DETX and DETY for each event in the final _common_clean file
| Quadrant A | 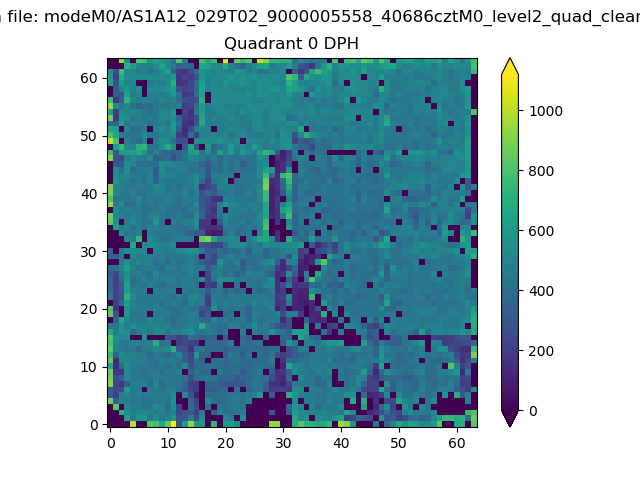 |
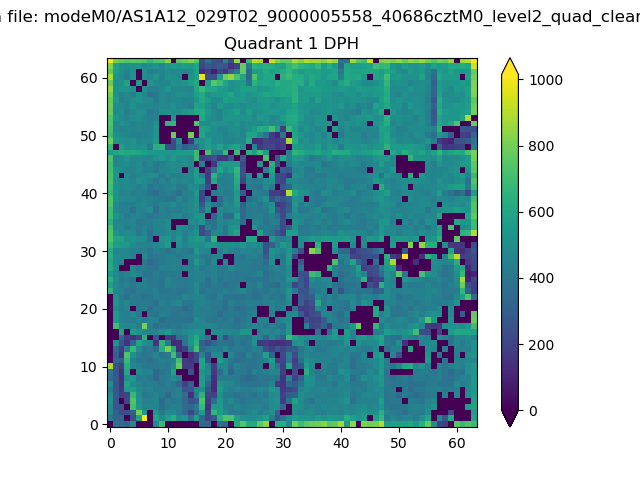 |
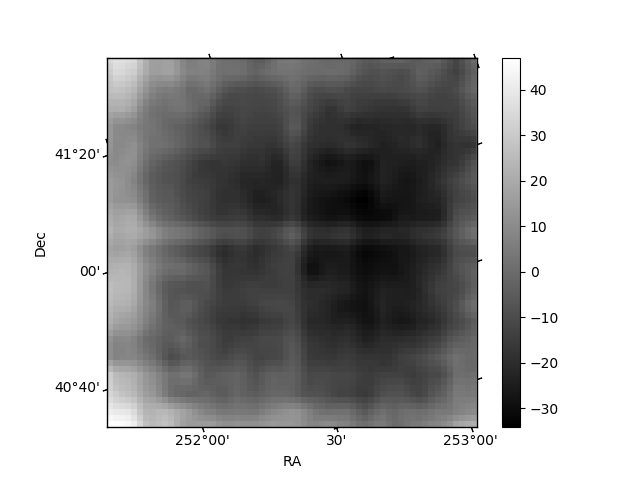
Quadrant B |
|---|---|---|---|
| Quadrant D | 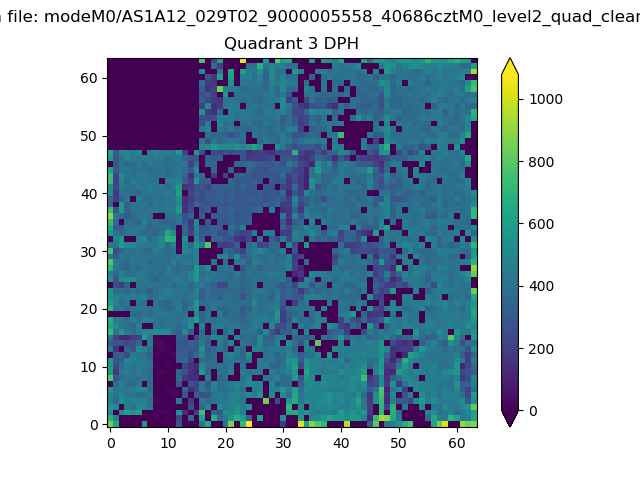 |
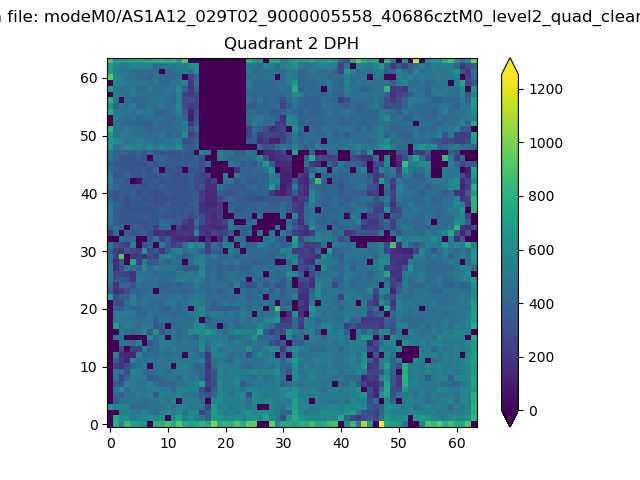 |
Quadrant C |
| Plot type | Count rate plots | Images |
|---|---|---|
| Comparison with Poisson distribution Blue bars denote a histogram of data divided into 1 sec bins. Red curve is a Poisson curve with rate = median count rate of data. |
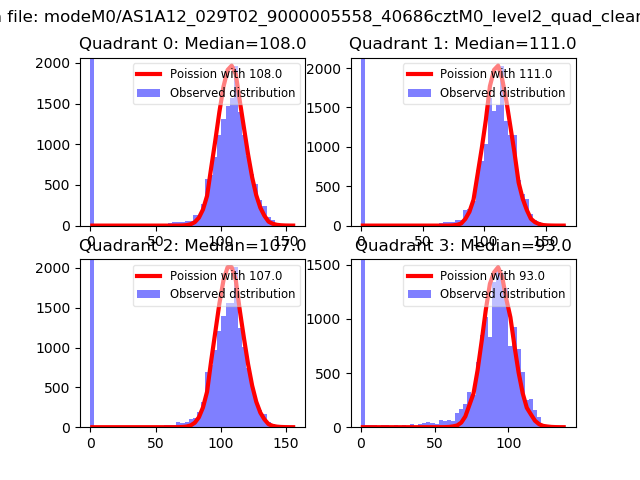 |
 |
| Quadrant-wise count rates Data is divided into 100 sec bins |
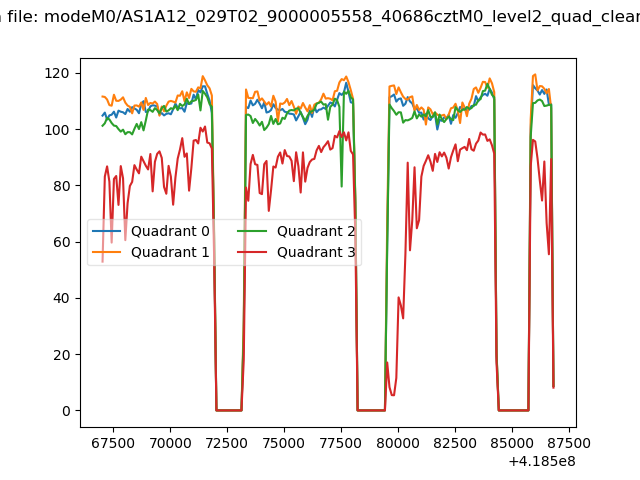 |
|
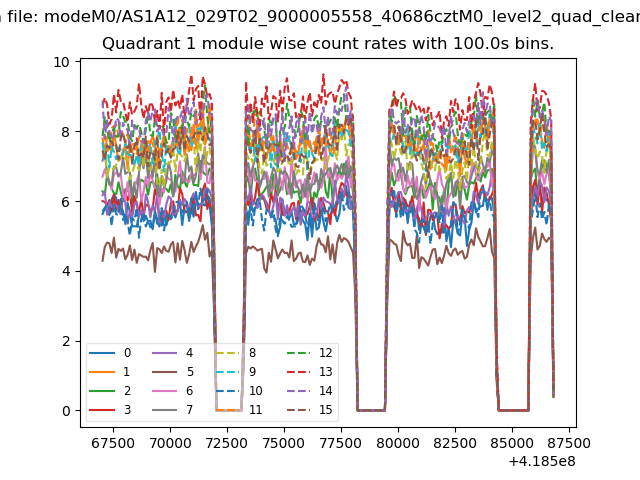
| Module-wise count rates for Quadrant A Data is divided into 100 sec bins |
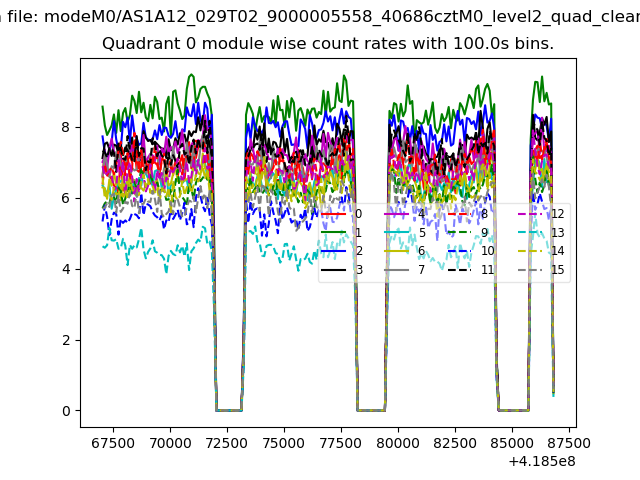 |
 |
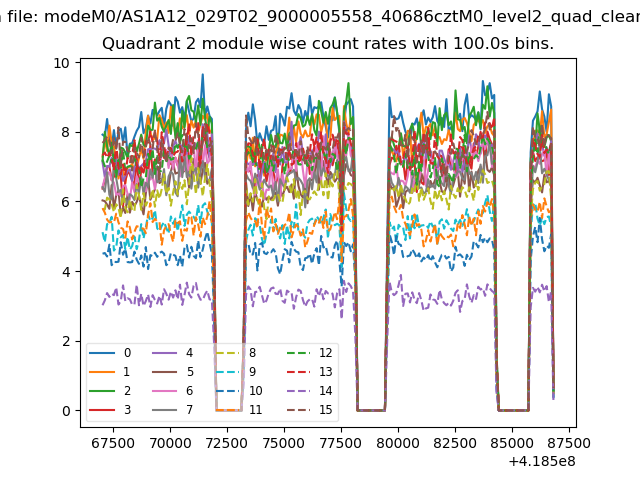
| Module-wise count rates for Quadrant B Data is divided into 100 sec bins |
 |
 |
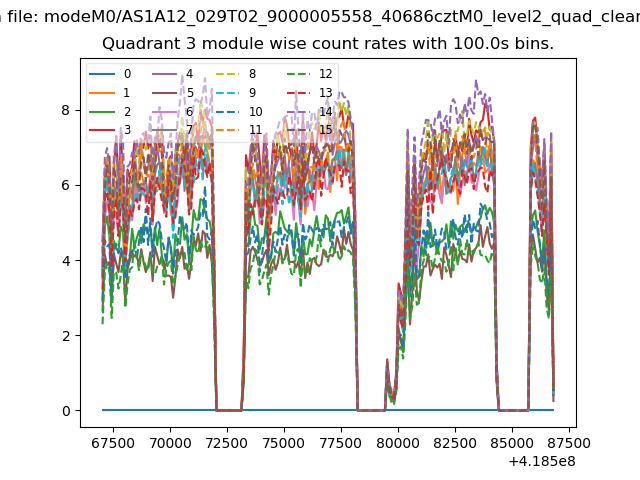
| Module-wise count rates for Quadrant C Data is divided into 100 sec bins |
 |
 |
| Module-wise count rates for Quadrant D Data is divided into 100 sec bins |
 |
 |
| Parameter | Plot |
|---|---|
| CZT HV Monitor | 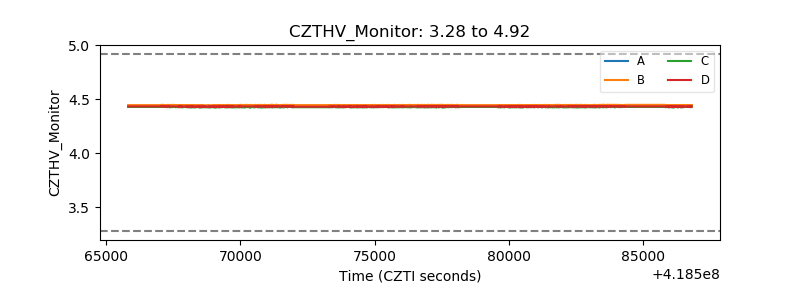 |
| D_VDD | 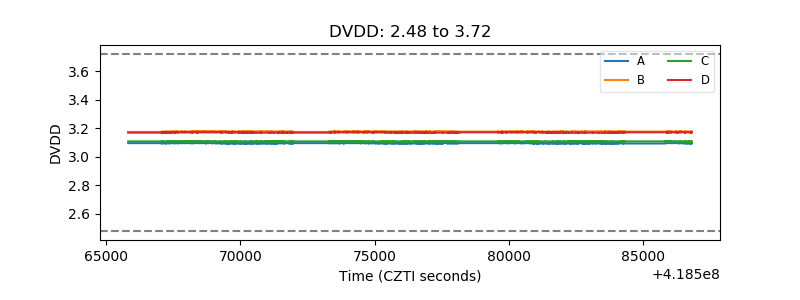 |
| Temperature 1 | 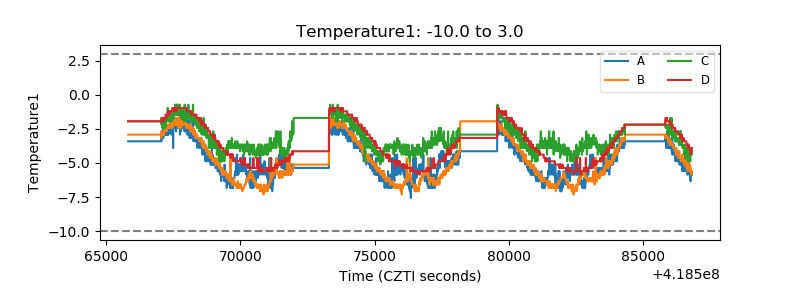 |
| Veto HV Monitor | 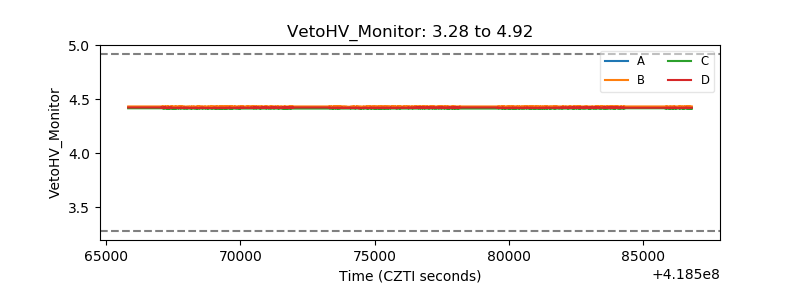 |
| Veto LLD | 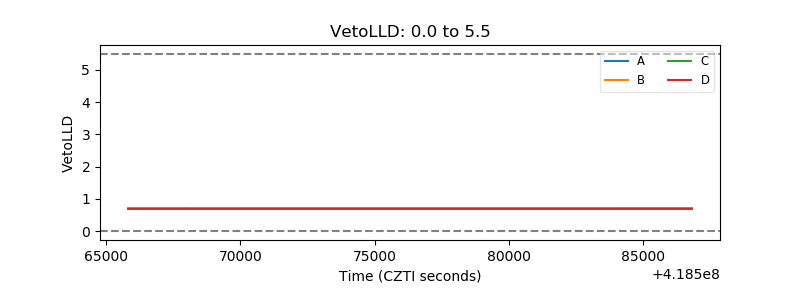 |
| Alpha Counter | 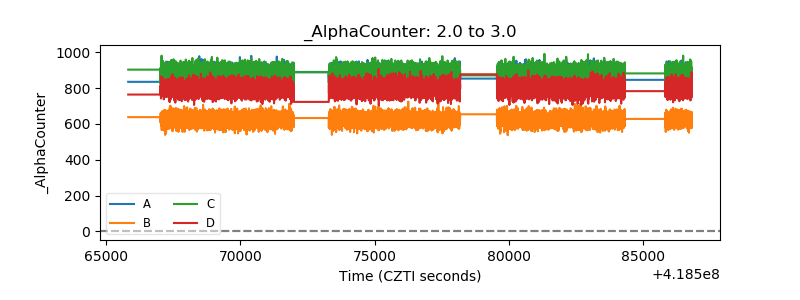 |
| _CPM_Rate | 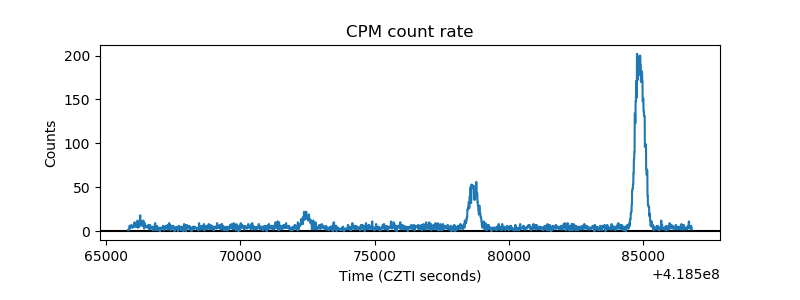 |
| CZT Counter | 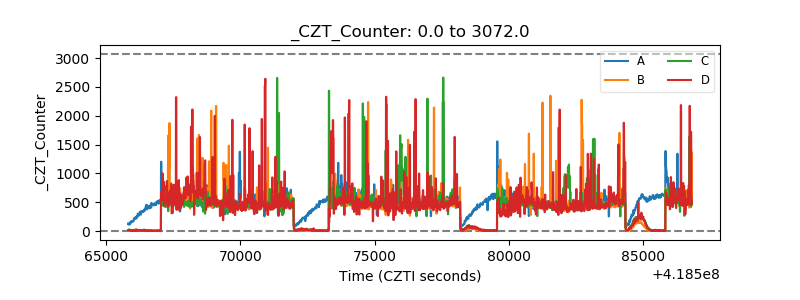 |
| +2.5 Volts monitor | 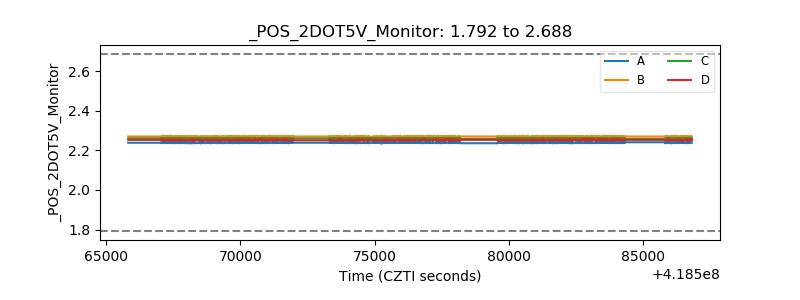 |
| +5 Volts monitor | 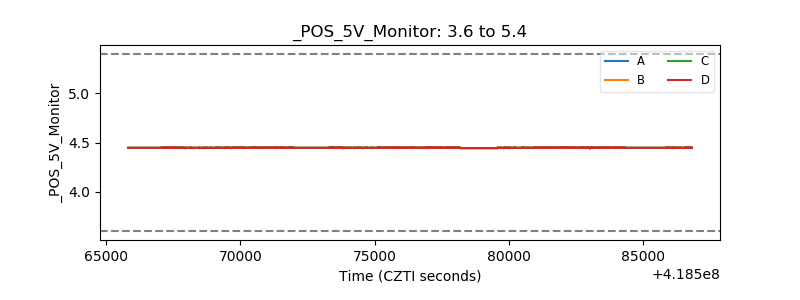 |
| _ROLL_ROT | 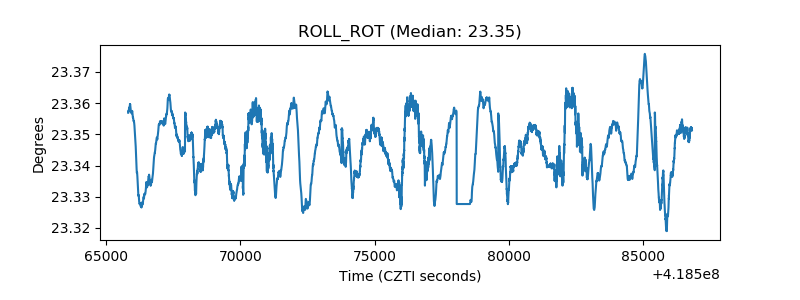 |
| _Roll_DEC | 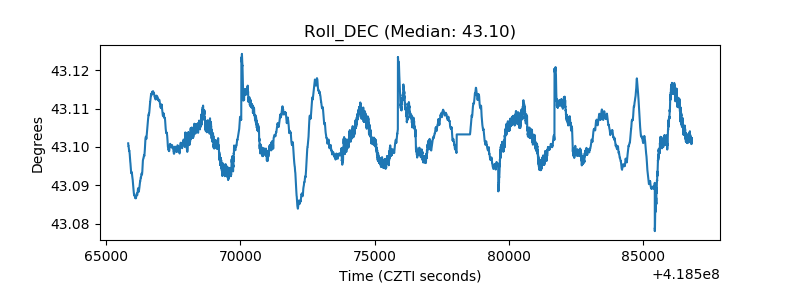 |
| _Roll_RA | 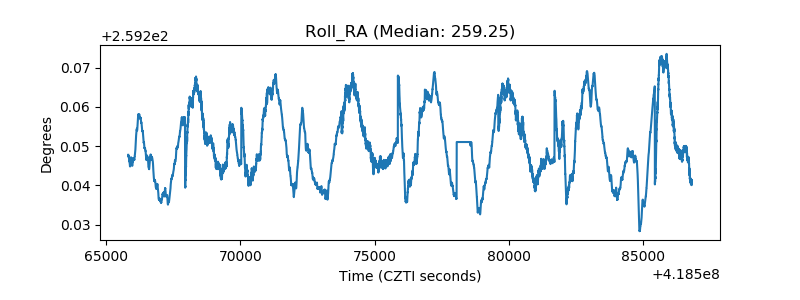 |
| Veto Counter | 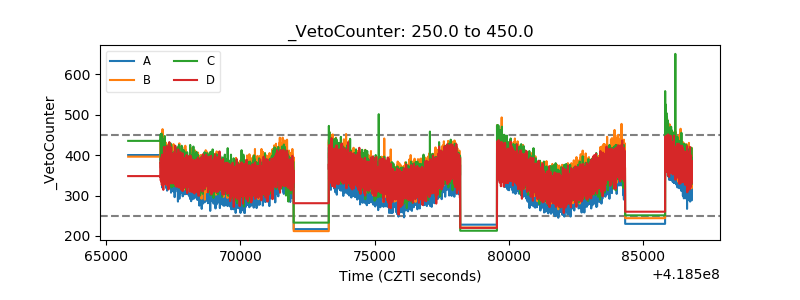 |