| Param | Original file | Final file |
|---|---|---|
| Filename | modeM0/AS1A12_029T02_9000005558_40687cztM0_level2.fits | modeM0/AS1A12_029T02_9000005558_40687cztM0_level2_quad_clean.evt |
| Size (bytes) | 362,937,600 | 93,323,520 |
| Size | 346.1 MB | 89.0 MB |
| Events in quadrant A | 3,089,799 | 636,260 |
| Events in quadrant B | 3,079,247 | 650,036 |
| Events in quadrant C | 3,072,148 | 629,281 |
| Events in quadrant D | 3,745,281 | 507,730 |
| Mode M0 | |||
|---|---|---|---|
| Quadrant | BADHDUFLAG | Total packets | Discarded packets |
| A | 0 | 12907 | 3 |
| B | 0 | 12901 | 2 |
| C | 0 | 12667 | 2 |
| D | 0 | 15099 | 2 |
| Mode M9 | |||
|---|---|---|---|
| Quadrant | BADHDUFLAG | Total packets | Discarded packets |
| A | 0 | 31 | 0 |
| B | 0 | 31 | 0 |
| C | 0 | 31 | 0 |
| D | 0 | 31 | 0 |
| Mode SS | |||
|---|---|---|---|
| Quadrant | BADHDUFLAG | Total packets | Discarded packets |
| A | 0 | 120 | 0 |
| B | 0 | 120 | 0 |
| C | 0 | 120 | 0 |
| D | 0 | 120 | 0 |
| Quadrant | Total seconds | Saturated seconds | Saturation percentage |
|---|---|---|---|
| A | 5751 | 15 | 0.260824% |
| B | 5751 | 53 | 0.921579% |
| C | 5751 | 28 | 0.486872% |
| D | 5751 | 791 | 13.754130% |
Noise dominated data is calculated using 1-second bins in cleaned event files. If a bin has >2000 counts, and if more than 50% of those come from <1% of pixels, then it is considered to be noise-dominated and hence unusable.
| Quadrant | # 1 sec bins | Bins with >0 counts | Bins with >2000 counts | High rate bins dominated by noise | Noise dominated (total time) | Noise dominated (detector-on time) | Marked lightcurve |
|---|---|---|---|---|---|---|---|
| A | 8857 | 5753 | 6 | 6 | 0.07% | 0.10% | 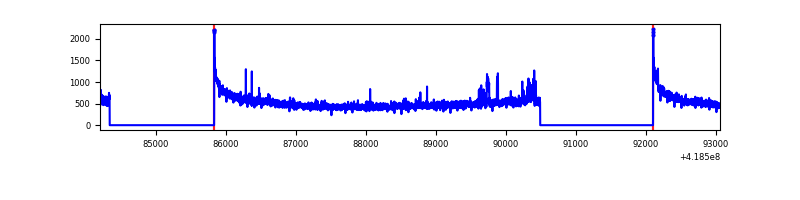 |
| B | 8857 | 5753 | 34 | 34 | 0.38% | 0.59% | 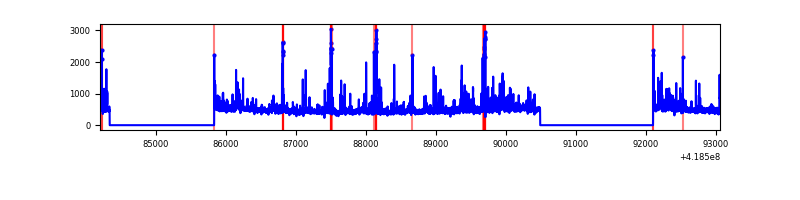 |
| C | 8857 | 5753 | 23 | 23 | 0.26% | 0.40% | 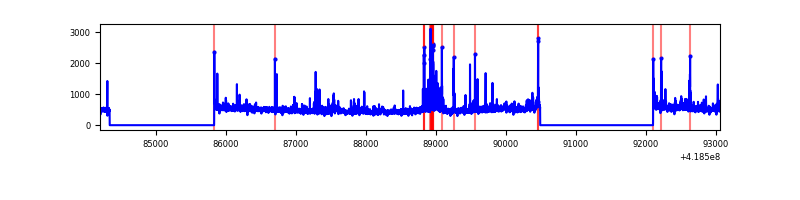 |
| D | 8857 | 5753 | 158 | 158 | 1.78% | 2.75% |  |
Top three noisy pixels from each quadrant. If the there are fewer than three noisy pixels in the level2.evt file, extra rows are filled as -1
| Pixel properties | Quadrant properties | ||||||
|---|---|---|---|---|---|---|---|
| Quadrant | DetID | PixID | Counts | Sigma | Mean | Median | Sigma |
| A | 10 | 83 | 514619 | 3900.0 | 639 | 626 | 131.8 |
| A | 12 | 189 | 95708 | 721.45 | 639 | 626 | 131.8 |
| A | 3 | 137 | 7349 | 51.01 | 639 | 626 | 131.8 |
| B | 5 | 255 | 183329 | 1461.27 | 637 | 619 | 125.0 |
| B | 0 | 229 | 166444 | 1326.23 | 637 | 619 | 125.0 |
| B | 4 | 171 | 109641 | 871.93 | 637 | 619 | 125.0 |
| C | 15 | 214 | 254026 | 1719.06 | 629 | 632 | 147.4 |
| C | 14 | 254 | 158322 | 1069.79 | 629 | 632 | 147.4 |
| C | 9 | 187 | 145086 | 979.99 | 629 | 632 | 147.4 |
| D | 12 | 227 | 469813 | 3201.4 | 581 | 564 | 146.6 |
| D | 2 | 250 | 253943 | 1728.65 | 581 | 564 | 146.6 |
| D | 2 | 249 | 212415 | 1445.33 | 581 | 564 | 146.6 |
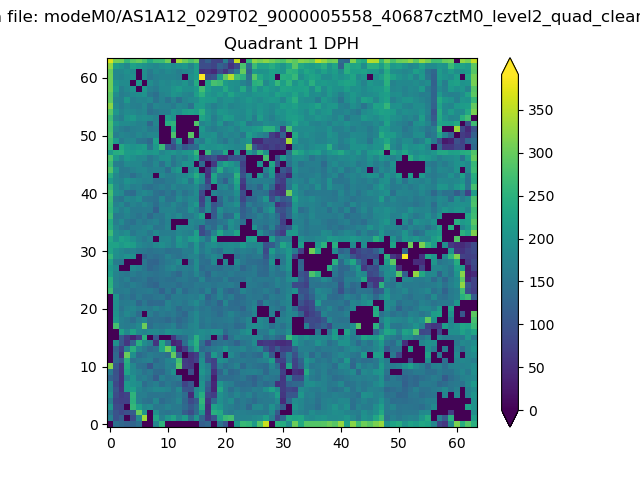
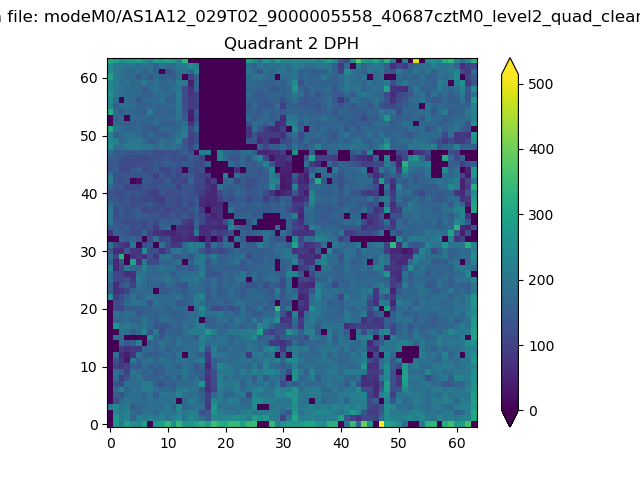
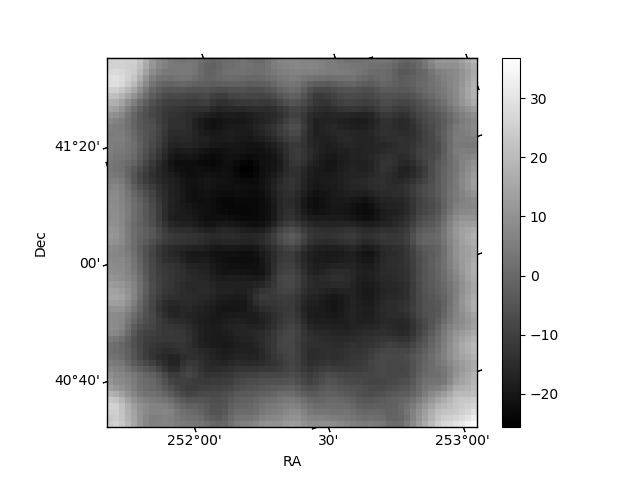
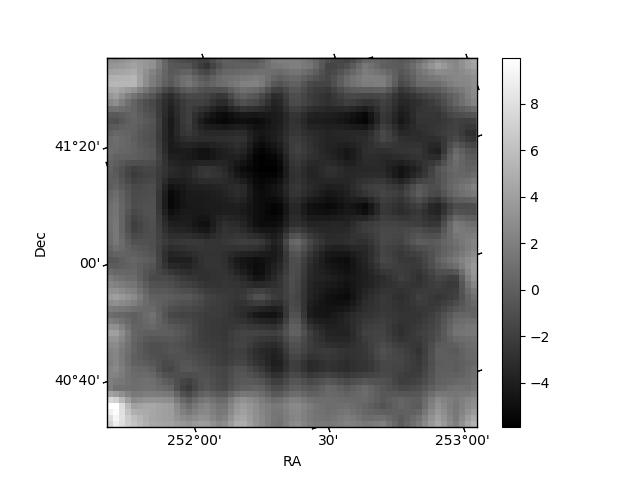
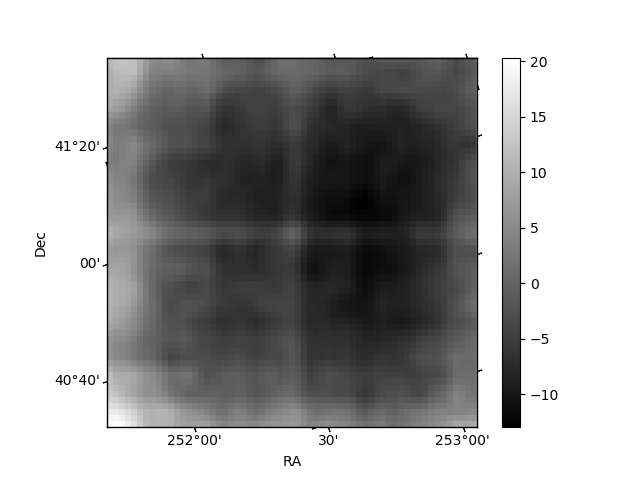
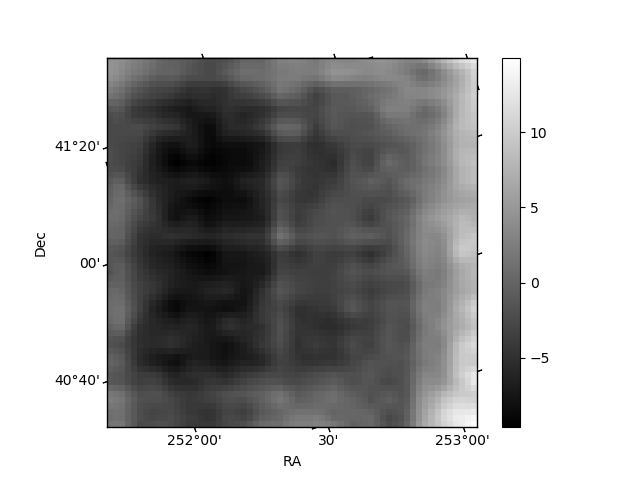
Histogram calculated using DETX and DETY for each event in the final _common_clean file
| Quadrant A | 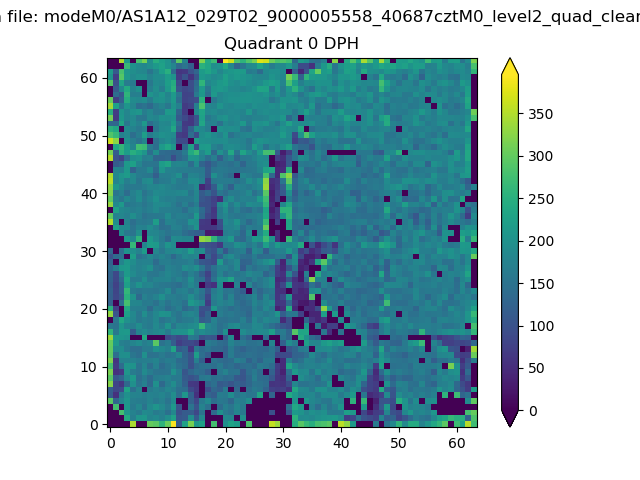 |
 |
Quadrant B |
|---|---|---|---|
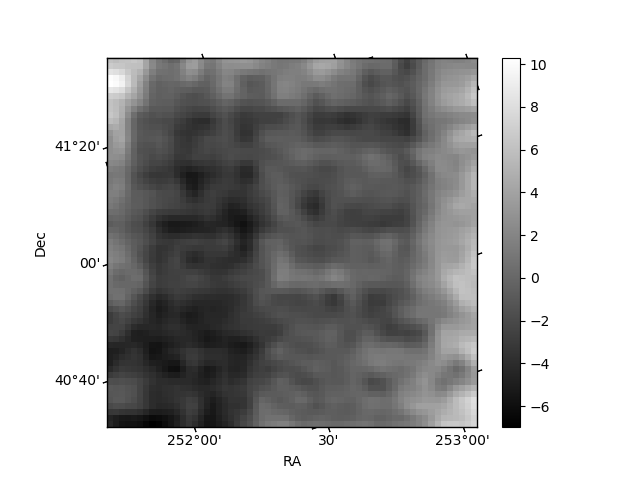
| Quadrant D | 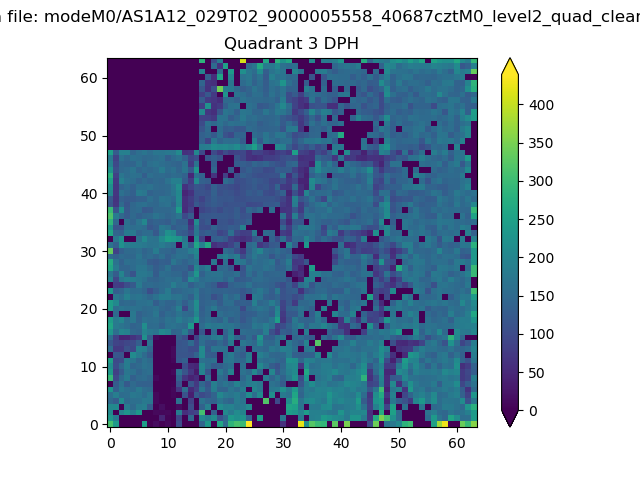 |
 |
Quadrant C |
| Plot type | Count rate plots | Images |
|---|---|---|
| Comparison with Poisson distribution Blue bars denote a histogram of data divided into 1 sec bins. Red curve is a Poisson curve with rate = median count rate of data. |
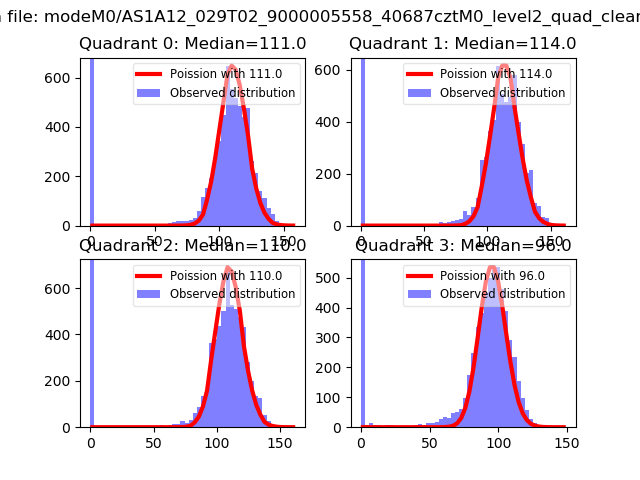 |
 |
| Quadrant-wise count rates Data is divided into 100 sec bins |
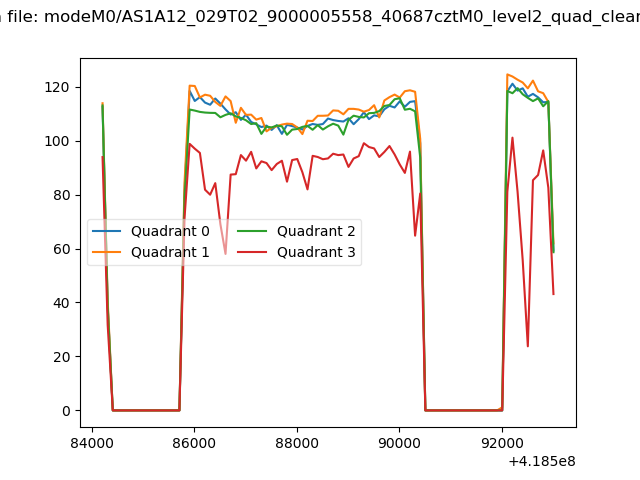 |
|
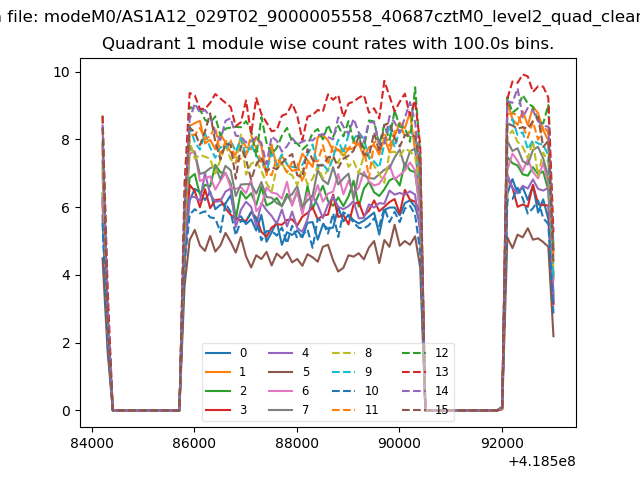
| Module-wise count rates for Quadrant A Data is divided into 100 sec bins |
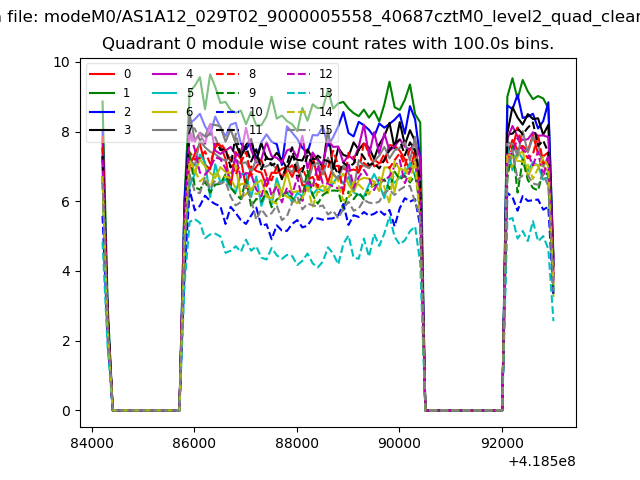 |
 |
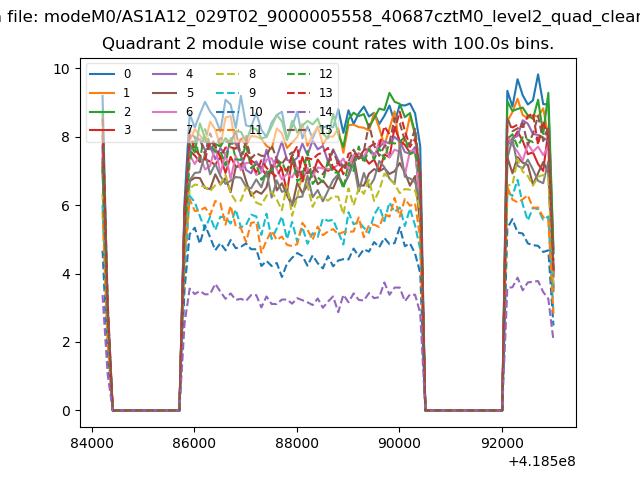
| Module-wise count rates for Quadrant B Data is divided into 100 sec bins |
 |
 |
| Module-wise count rates for Quadrant C Data is divided into 100 sec bins |
 |
 |
| Module-wise count rates for Quadrant D Data is divided into 100 sec bins |
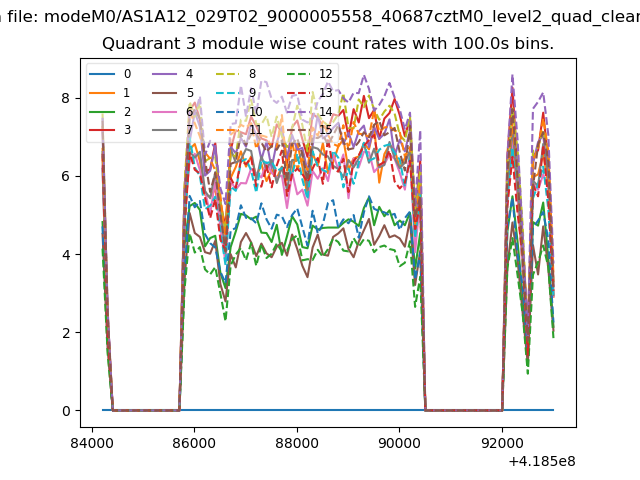 |
 |
| Parameter | Plot |
|---|---|
| CZT HV Monitor | 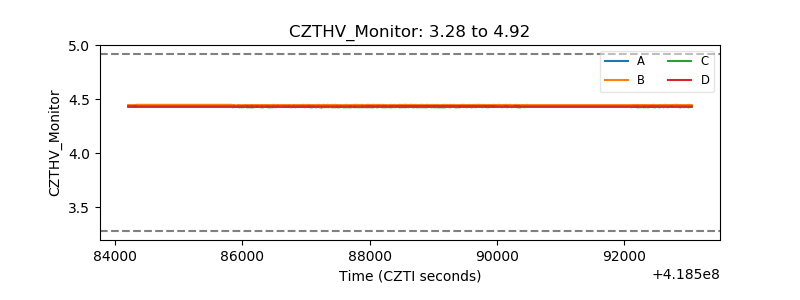 |
| D_VDD | 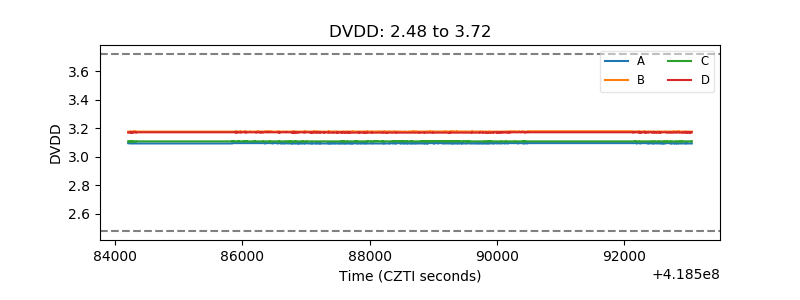 |
| Temperature 1 | 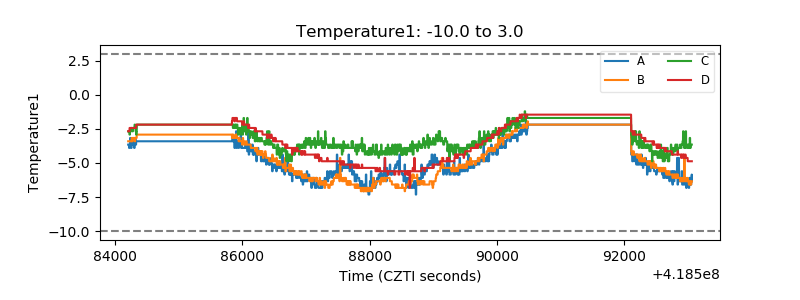 |
| Veto HV Monitor | 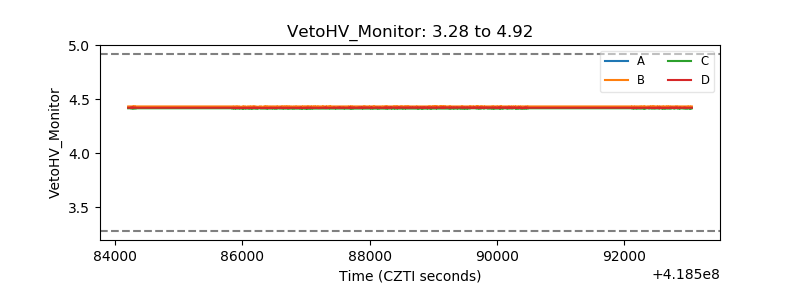 |
| Veto LLD | 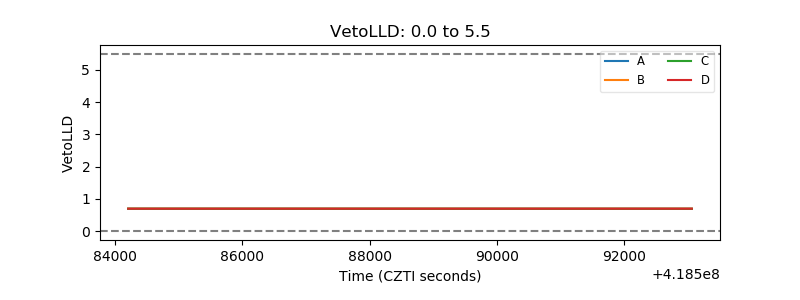 |
| Alpha Counter | 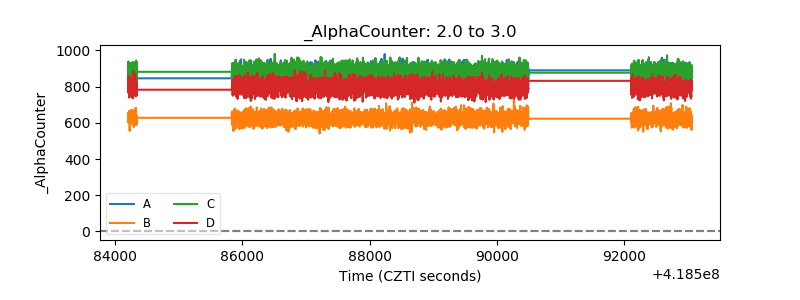 |
| _CPM_Rate | 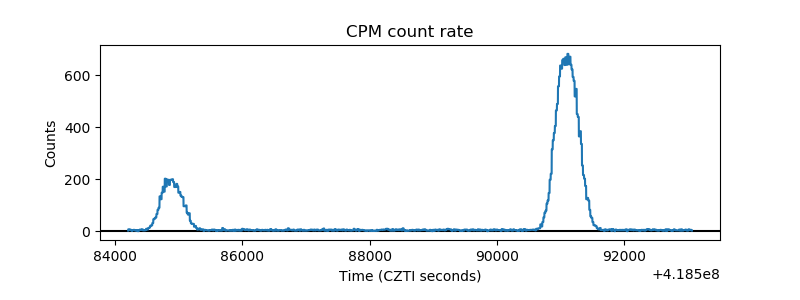 |
| CZT Counter | 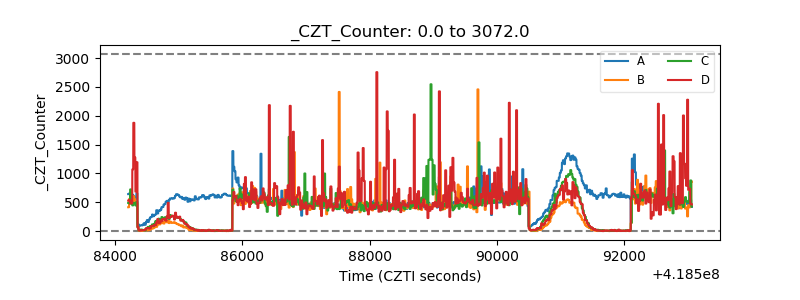 |
| +2.5 Volts monitor | 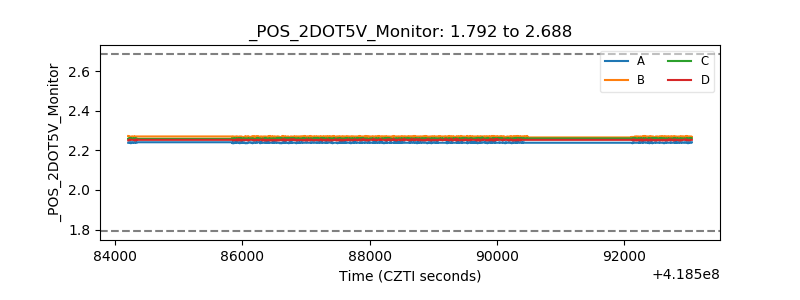 |
| +5 Volts monitor | 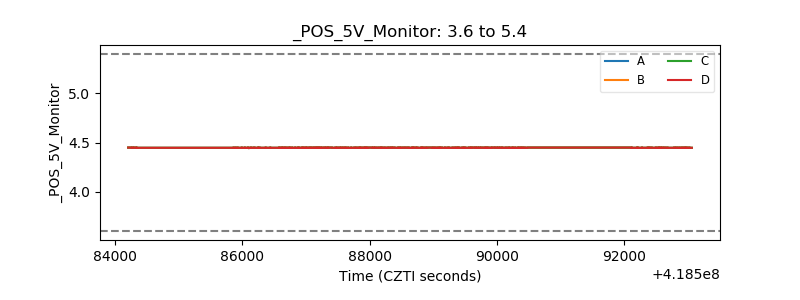 |
| _ROLL_ROT | 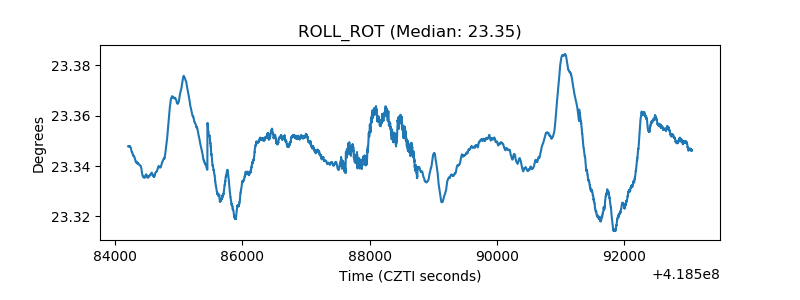 |
| _Roll_DEC | 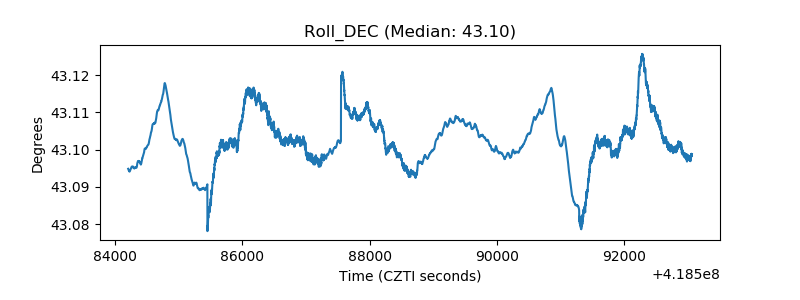 |
| _Roll_RA | 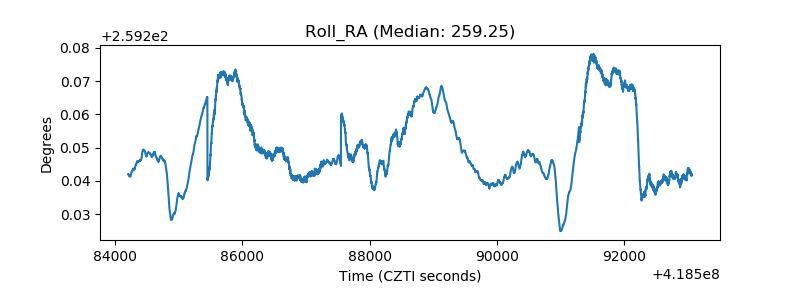 |
| Veto Counter | 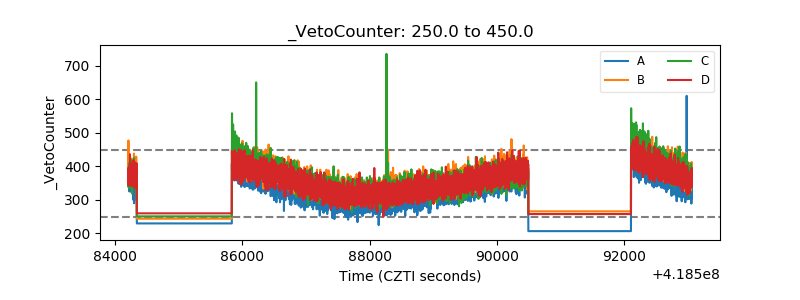 |