| Param | Original file | Final file |
|---|---|---|
| Filename | modeM0/AS1A12_097T01_9000005574_40898cztM0_level2.fits | modeM0/AS1A12_097T01_9000005574_40898cztM0_level2_quad_clean.evt |
| Size (bytes) | 318,202,560 | 85,250,880 |
| Size | 303.5 MB | 81.3 MB |
| Events in quadrant A | 2,801,393 | 566,449 |
| Events in quadrant B | 2,666,624 | 589,490 |
| Events in quadrant C | 2,601,868 | 559,630 |
| Events in quadrant D | 3,303,429 | 501,362 |
| Mode M9 | |||
|---|---|---|---|
| Quadrant | BADHDUFLAG | Total packets | Discarded packets |
| A | 0 | 29 | 0 |
| B | 0 | 29 | 0 |
| C | 0 | 29 | 0 |
| D | 0 | 30 | 0 |
| Mode SS | |||
|---|---|---|---|
| Quadrant | BADHDUFLAG | Total packets | Discarded packets |
| A | 0 | 106 | 0 |
| B | 0 | 106 | 0 |
| C | 0 | 106 | 0 |
| D | 0 | 106 | 0 |
| Mode M0 | |||
|---|---|---|---|
| Quadrant | BADHDUFLAG | Total packets | Discarded packets |
| A | 0 | 11335 | 3 |
| B | 0 | 11499 | 2 |
| C | 0 | 10960 | 2 |
| D | 0 | 13392 | 2 |
| Quadrant | Total seconds | Saturated seconds | Saturation percentage |
|---|---|---|---|
| A | 5203 | 8 | 0.153757% |
| B | 5203 | 44 | 0.845666% |
| C | 5203 | 31 | 0.595810% |
| D | 5203 | 149 | 2.863732% |
Noise dominated data is calculated using 1-second bins in cleaned event files. If a bin has >2000 counts, and if more than 50% of those come from <1% of pixels, then it is considered to be noise-dominated and hence unusable.
| Quadrant | # 1 sec bins | Bins with >0 counts | Bins with >2000 counts | High rate bins dominated by noise | Noise dominated (total time) | Noise dominated (detector-on time) | Marked lightcurve |
|---|---|---|---|---|---|---|---|
| A | 7086 | 5204 | 2 | 2 | 0.03% | 0.04% | 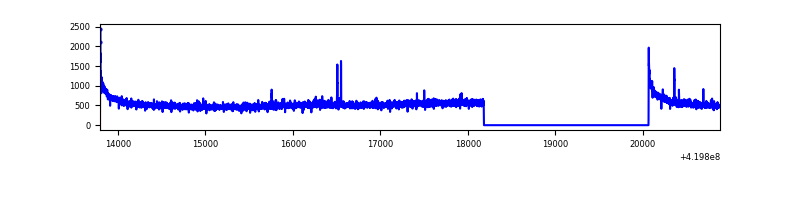 |
| B | 7086 | 5204 | 25 | 25 | 0.35% | 0.48% | 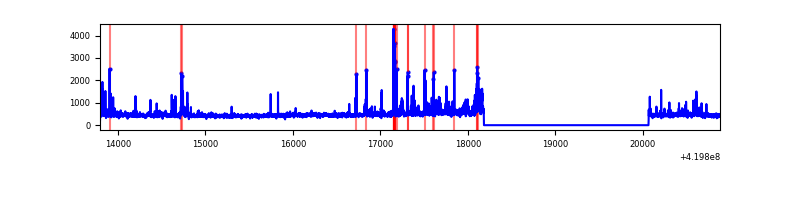 |
| C | 7086 | 5204 | 24 | 24 | 0.34% | 0.46% | 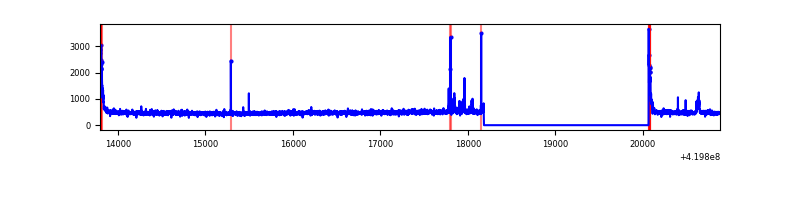 |
| D | 7086 | 5204 | 141 | 141 | 1.99% | 2.71% | 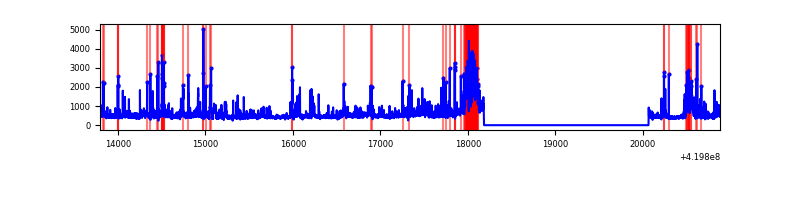 |
Top three noisy pixels from each quadrant. If the there are fewer than three noisy pixels in the level2.evt file, extra rows are filled as -1
| Pixel properties | Quadrant properties | ||||||
|---|---|---|---|---|---|---|---|
| Quadrant | DetID | PixID | Counts | Sigma | Mean | Median | Sigma |
| A | 10 | 83 | 504015 | 4215.22 | 577 | 564 | 119.4 |
| A | 12 | 189 | 40107 | 331.08 | 577 | 564 | 119.4 |
| A | 13 | 6 | 15650 | 126.31 | 577 | 564 | 119.4 |
| B | 5 | 255 | 158197 | 1376.52 | 579 | 564 | 114.5 |
| B | 4 | 171 | 101702 | 883.18 | 579 | 564 | 114.5 |
| B | 5 | 32 | 47168 | 406.97 | 579 | 564 | 114.5 |
| C | 15 | 214 | 221652 | 1658.93 | 564 | 567 | 133.3 |
| C | 0 | 10 | 109140 | 814.69 | 564 | 567 | 133.3 |
| C | 14 | 254 | 60615 | 450.57 | 564 | 567 | 133.3 |
| D | 12 | 233 | 355104 | 2565.35 | 556 | 540 | 138.2 |
| D | 12 | 128 | 261596 | 1888.8 | 556 | 540 | 138.2 |
| D | 12 | 79 | 135968 | 979.85 | 556 | 540 | 138.2 |
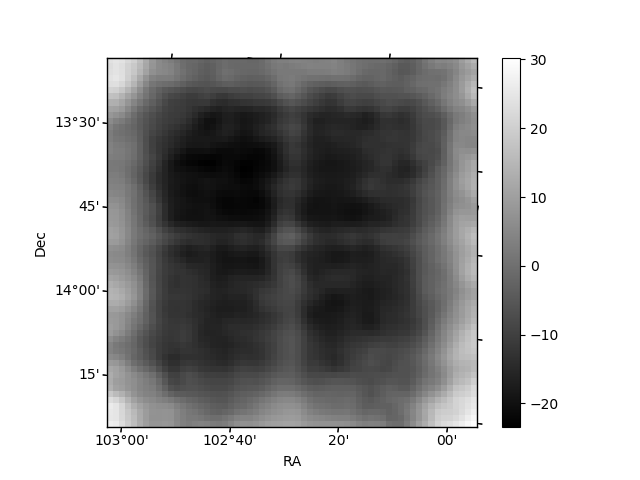
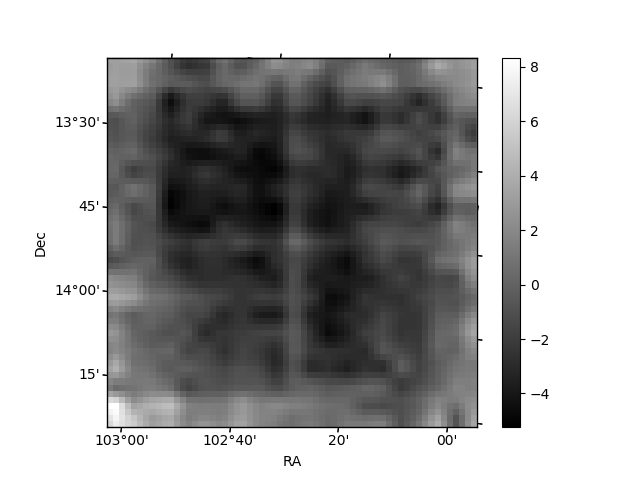
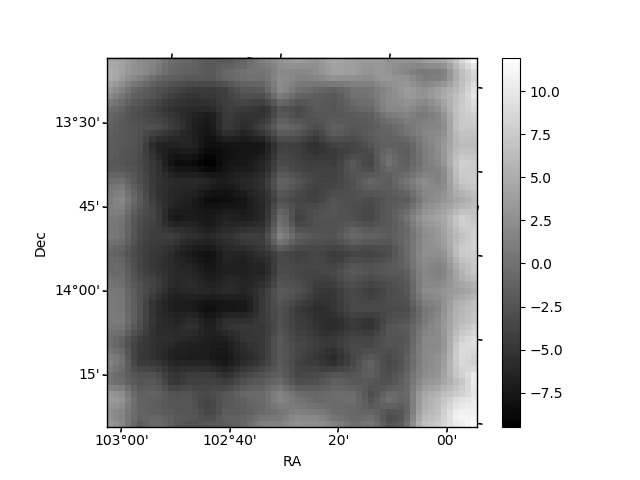
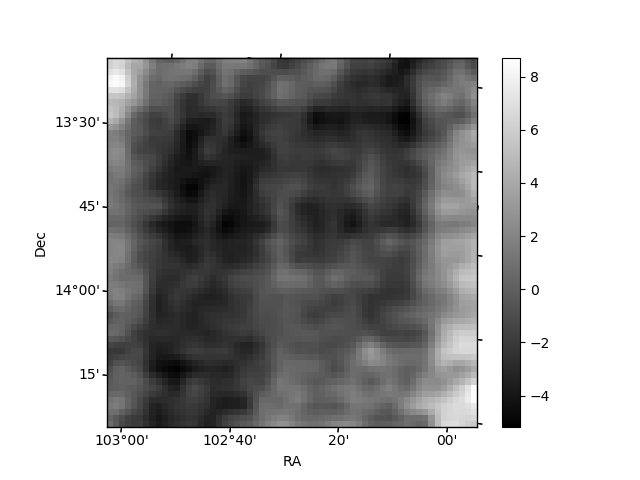
Histogram calculated using DETX and DETY for each event in the final _common_clean file
| Quadrant A | 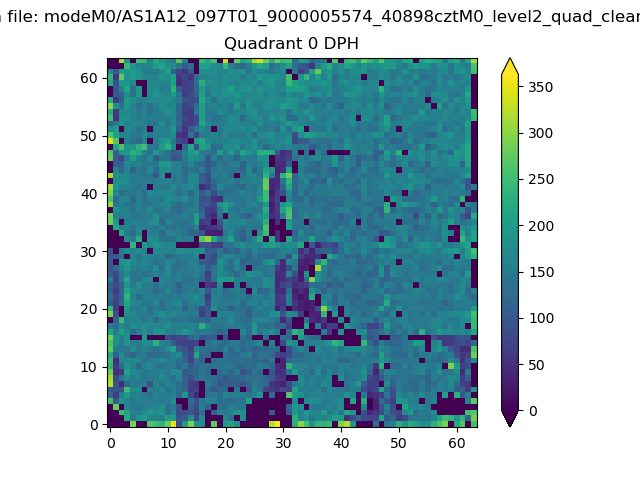 |
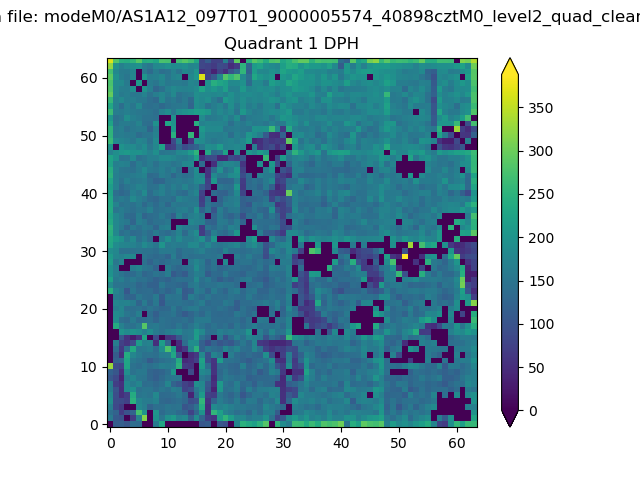 |
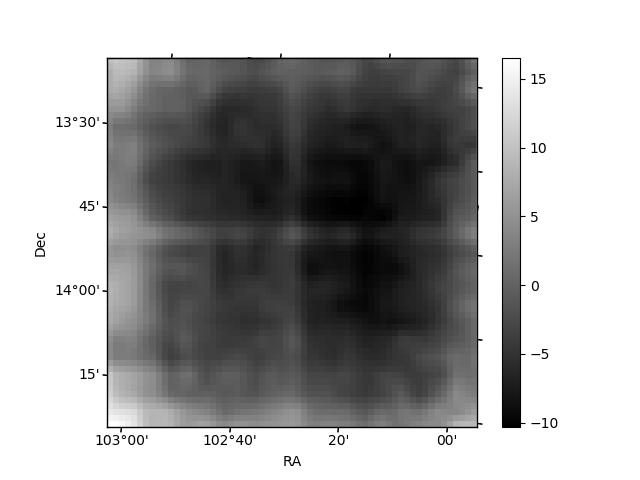
Quadrant B |
|---|---|---|---|
| Quadrant D | 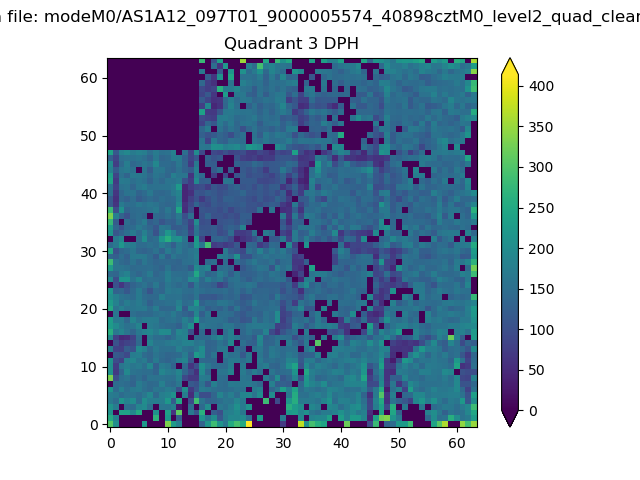 |
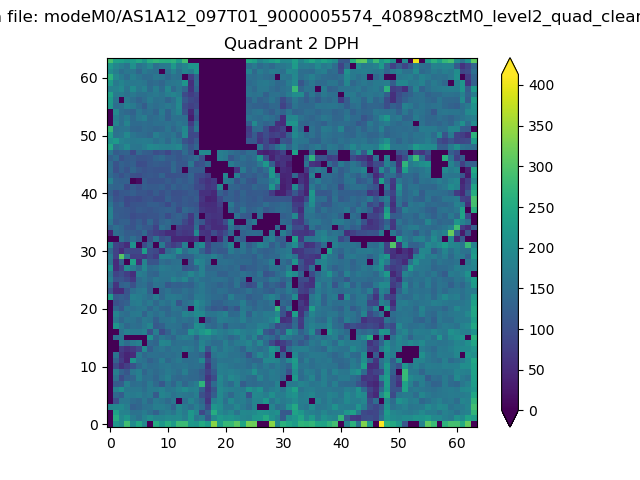 |
Quadrant C |
| Plot type | Count rate plots | Images |
|---|---|---|
| Comparison with Poisson distribution Blue bars denote a histogram of data divided into 1 sec bins. Red curve is a Poisson curve with rate = median count rate of data. |
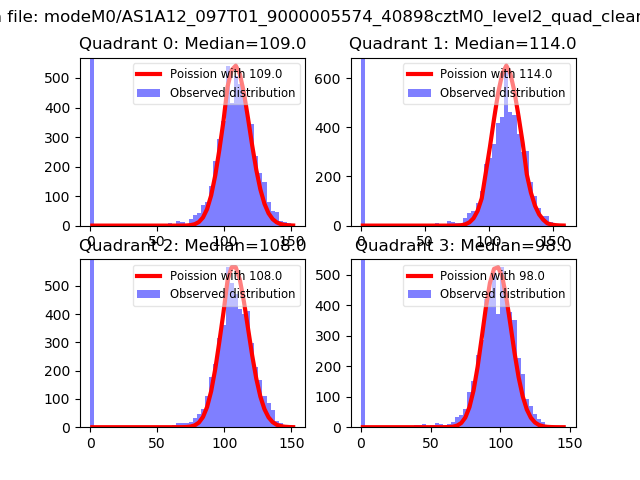 |
 |
| Quadrant-wise count rates Data is divided into 100 sec bins |
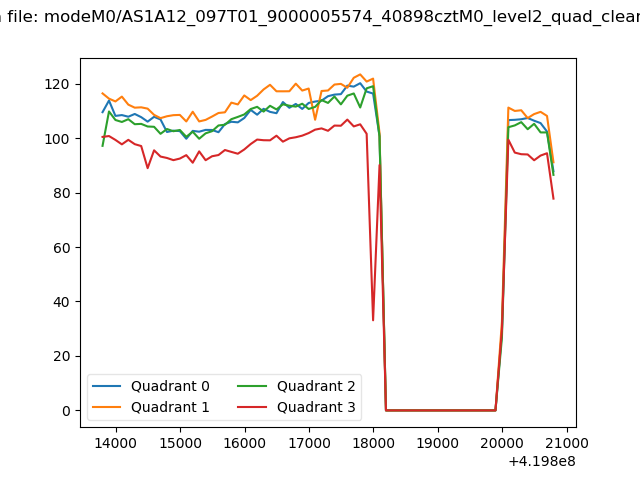 |
|
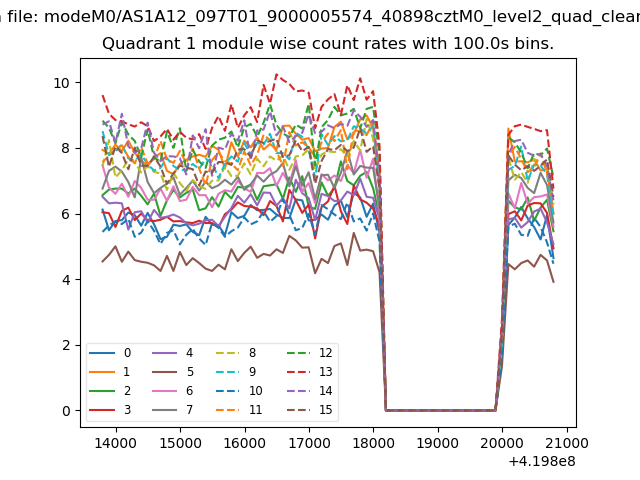
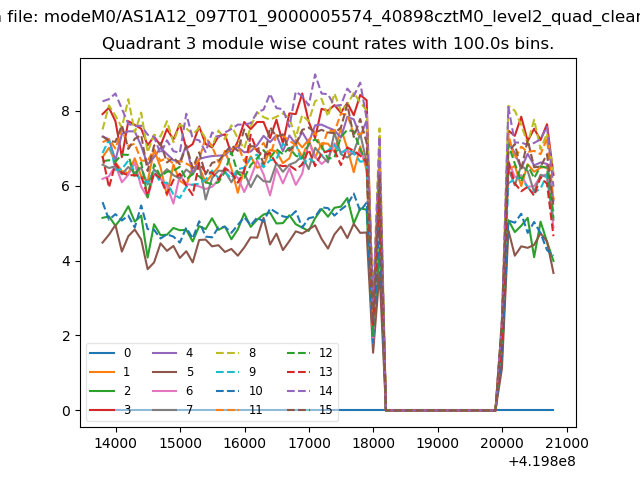
| Module-wise count rates for Quadrant A Data is divided into 100 sec bins |
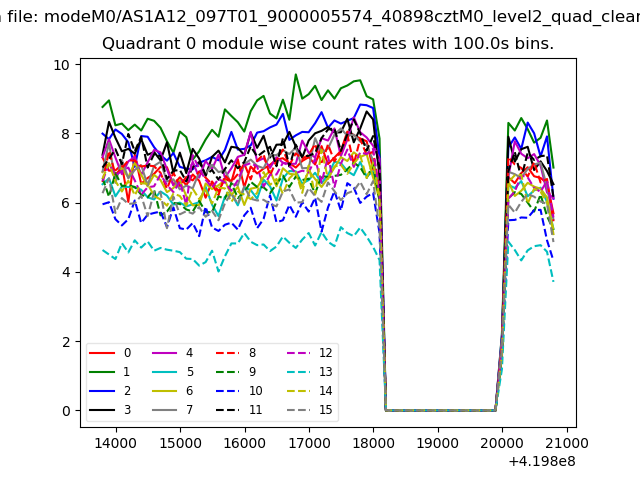 |
 |
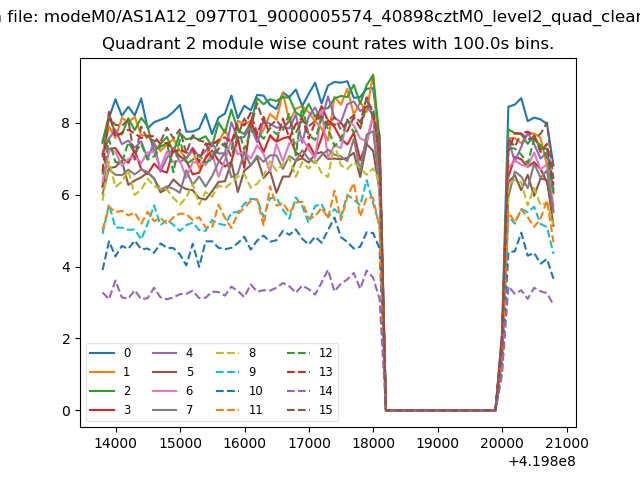
| Module-wise count rates for Quadrant B Data is divided into 100 sec bins |
 |
 |
| Module-wise count rates for Quadrant C Data is divided into 100 sec bins |
 |
 |
| Module-wise count rates for Quadrant D Data is divided into 100 sec bins |
 |
 |
| Parameter | Plot |
|---|---|
| CZT HV Monitor |  |
| D_VDD | 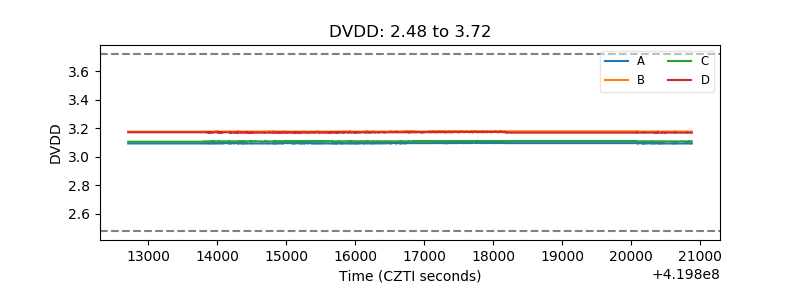 |
| Temperature 1 | 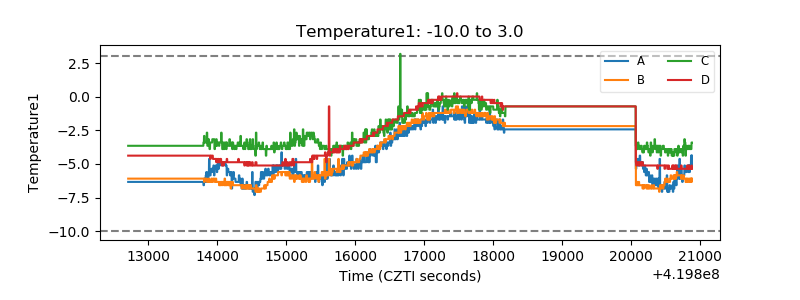 |
| Veto HV Monitor | 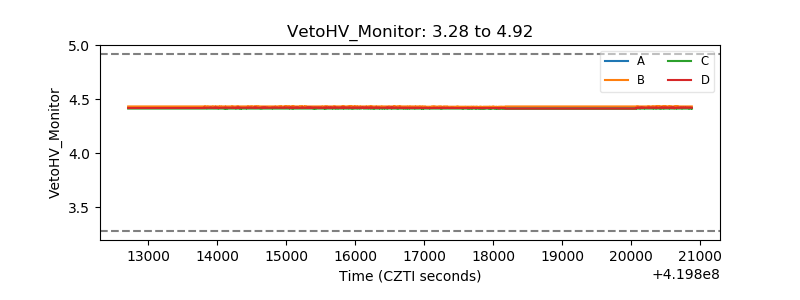 |
| Veto LLD | 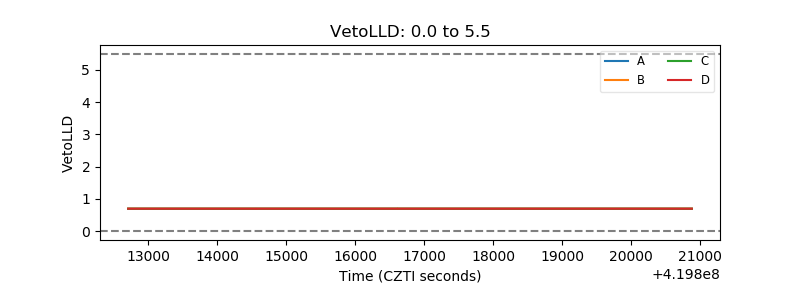 |
| Alpha Counter | 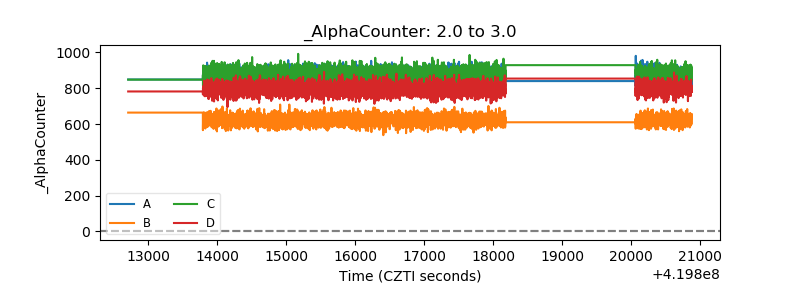 |
| _CPM_Rate |  |
| CZT Counter | 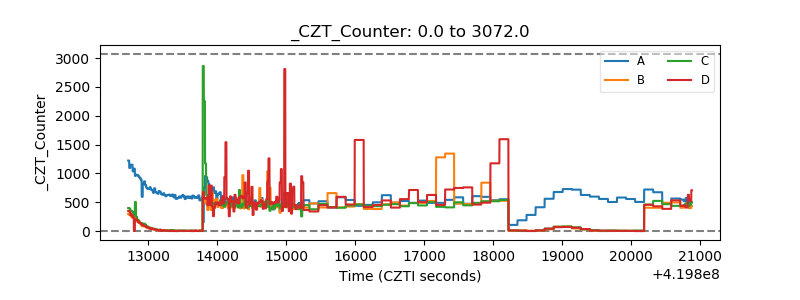 |
| +2.5 Volts monitor | 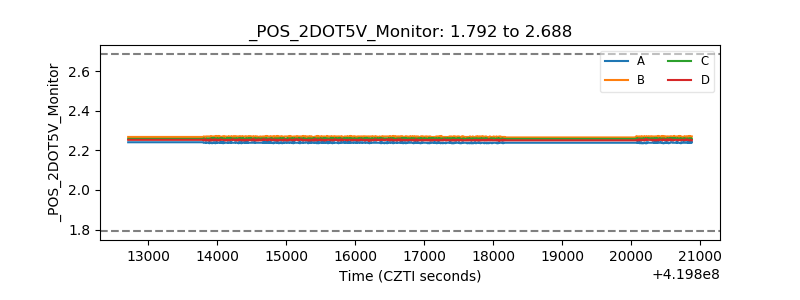 |
| +5 Volts monitor | 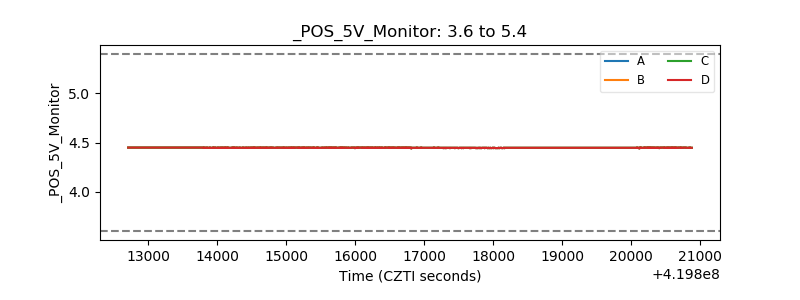 |
| _ROLL_ROT | 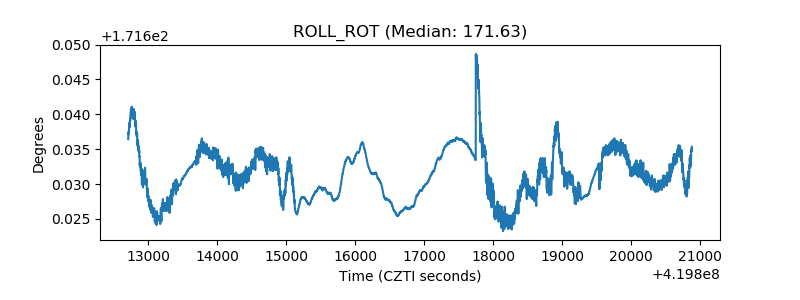 |
| _Roll_DEC | 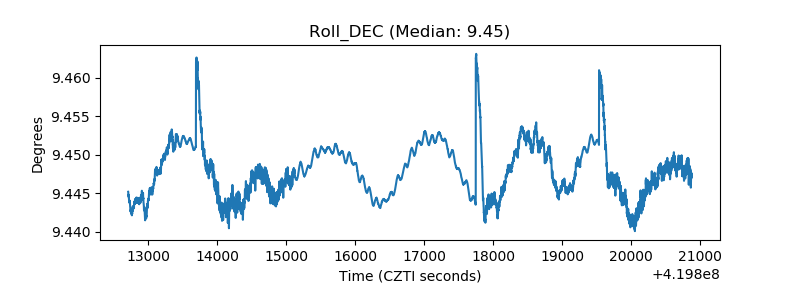 |
| _Roll_RA | 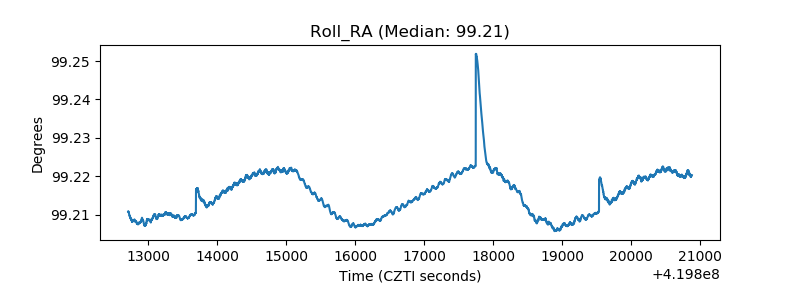 |
| Veto Counter | 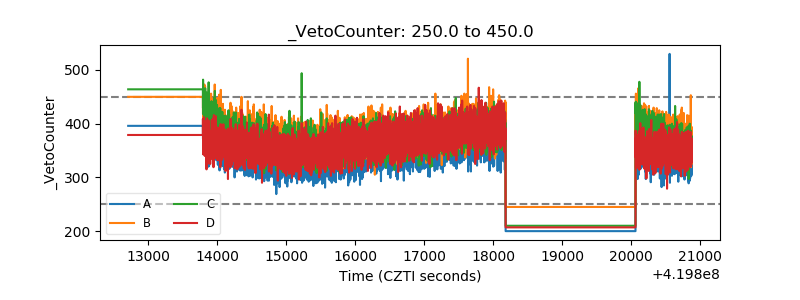 |