| Param | Original file | Final file |
|---|---|---|
| Filename | modeM0/AS1T05_102T01_9000005634_41238cztM0_level2.fits | modeM0/AS1T05_102T01_9000005634_41238cztM0_level2_quad_clean.evt |
| Size (bytes) | 1,230,857,280 | 330,624,000 |
| Size | 1.1 GB | 315.3 MB |
| Events in quadrant A | 12,354,592 | 2,210,329 |
| Events in quadrant B | 10,153,992 | 2,268,260 |
| Events in quadrant C | 11,203,449 | 2,144,966 |
| Events in quadrant D | 10,279,864 | 1,989,300 |
| Mode M9 | |||
|---|---|---|---|
| Quadrant | BADHDUFLAG | Total packets | Discarded packets |
| A | 0 | 72 | 0 |
| B | 0 | 72 | 0 |
| C | 0 | 72 | 0 |
| D | 0 | 72 | 0 |
| Mode M0 | |||
|---|---|---|---|
| Quadrant | BADHDUFLAG | Total packets | Discarded packets |
| A | 0 | 49818 | 6 |
| B | 0 | 44207 | 5 |
| C | 0 | 46222 | 5 |
| D | 0 | 45632 | 5 |
| Mode SS | |||
|---|---|---|---|
| Quadrant | BADHDUFLAG | Total packets | Discarded packets |
| A | 0 | 418 | 0 |
| B | 0 | 418 | 0 |
| C | 0 | 418 | 0 |
| D | 0 | 418 | 0 |
| Quadrant | Total seconds | Saturated seconds | Saturation percentage |
|---|---|---|---|
| A | 20288 | 94 | 0.463328% |
| B | 20288 | 184 | 0.906940% |
| C | 20288 | 400 | 1.971609% |
| D | 20288 | 234 | 1.153391% |
Noise dominated data is calculated using 1-second bins in cleaned event files. If a bin has >2000 counts, and if more than 50% of those come from <1% of pixels, then it is considered to be noise-dominated and hence unusable.
| Quadrant | # 1 sec bins | Bins with >0 counts | Bins with >2000 counts | High rate bins dominated by noise | Noise dominated (total time) | Noise dominated (detector-on time) | Marked lightcurve |
|---|---|---|---|---|---|---|---|
| A | 27574 | 20293 | 62 | 62 | 0.22% | 0.31% | 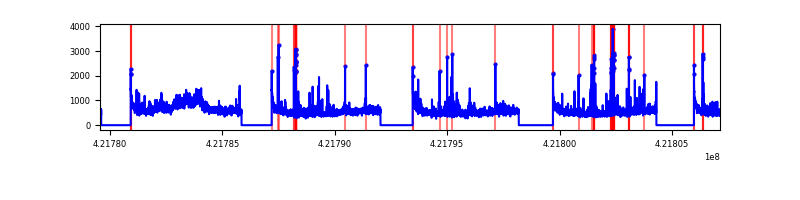 |
| B | 27574 | 20293 | 120 | 120 | 0.44% | 0.59% | 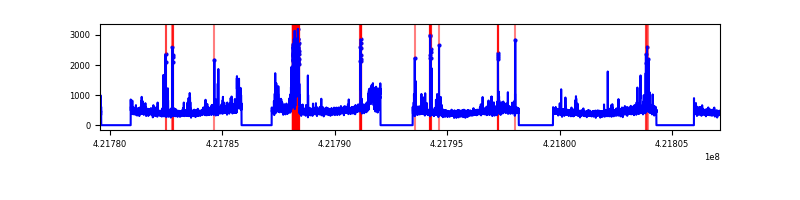 |
| C | 27574 | 20293 | 381 | 381 | 1.38% | 1.88% | 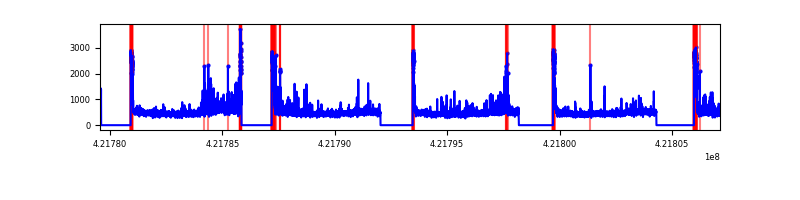 |
| D | 27574 | 20292 | 201 | 201 | 0.73% | 0.99% | 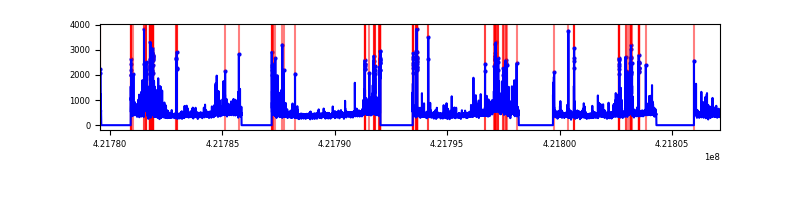 |
Top three noisy pixels from each quadrant. If the there are fewer than three noisy pixels in the level2.evt file, extra rows are filled as -1
| Pixel properties | Quadrant properties | ||||||
|---|---|---|---|---|---|---|---|
| Quadrant | DetID | PixID | Counts | Sigma | Mean | Median | Sigma |
| A | 0 | 8 | 1775602 | 3918.2 | 2229 | 2183 | 452.6 |
| A | 10 | 83 | 1711518 | 3776.62 | 2229 | 2183 | 452.6 |
| A | 2 | 79 | 131681 | 286.11 | 2229 | 2183 | 452.6 |
| B | 0 | 229 | 507831 | 1173.63 | 2215 | 2151 | 430.9 |
| B | 7 | 202 | 284880 | 656.18 | 2215 | 2151 | 430.9 |
| B | 0 | 186 | 273383 | 629.5 | 2215 | 2151 | 430.9 |
| C | 0 | 10 | 1012347 | 2002.0 | 2174 | 2191 | 504.6 |
| C | 15 | 214 | 848046 | 1676.38 | 2174 | 2191 | 504.6 |
| C | 9 | 54 | 785124 | 1551.67 | 2174 | 2191 | 504.6 |
| D | 13 | 249 | 555901 | 1053.36 | 2180 | 2126 | 525.7 |
| D | 2 | 120 | 438407 | 829.87 | 2180 | 2126 | 525.7 |
| D | 2 | 249 | 271164 | 511.75 | 2180 | 2126 | 525.7 |
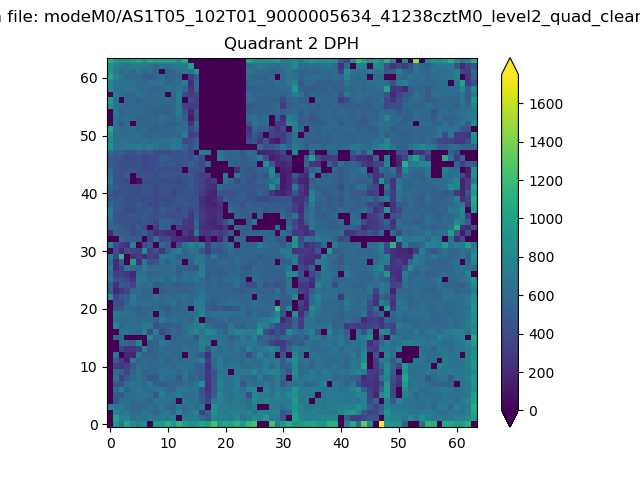
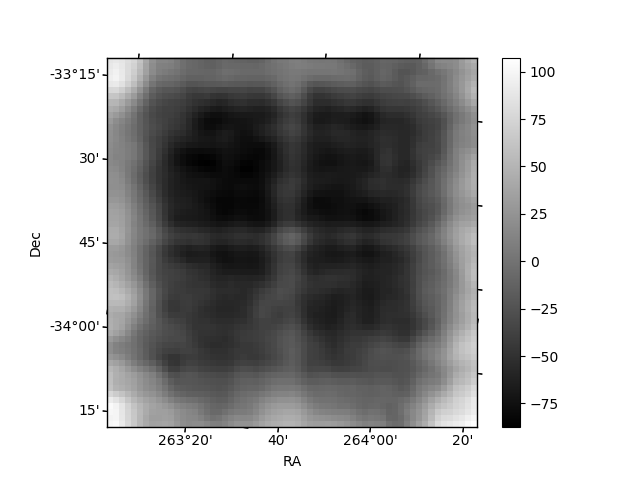
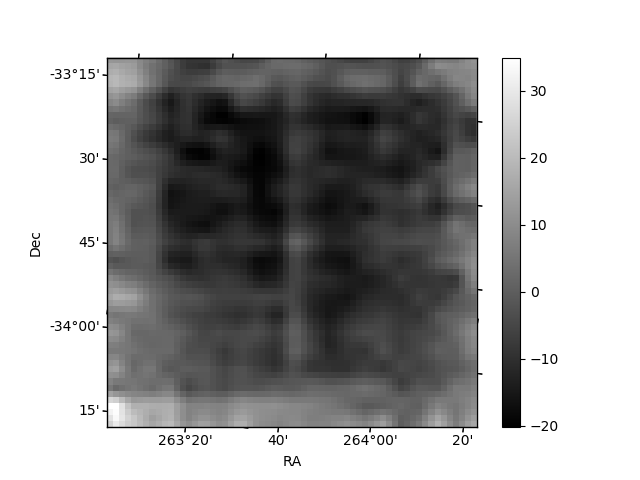
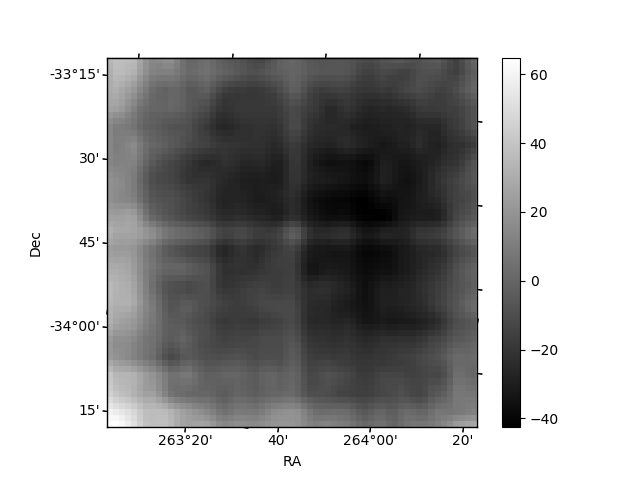
Histogram calculated using DETX and DETY for each event in the final _common_clean file
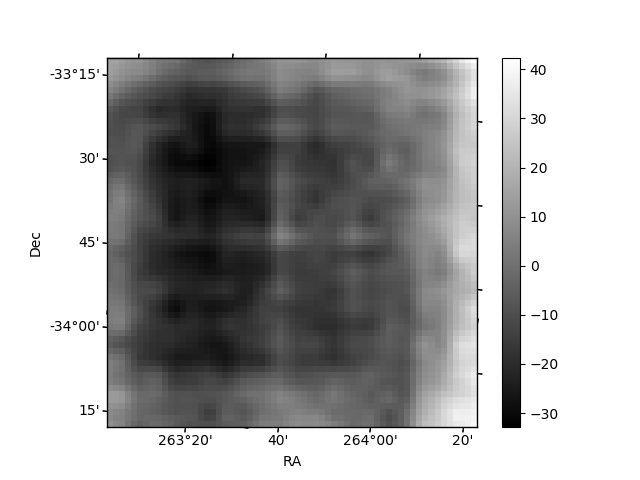
| Quadrant A | 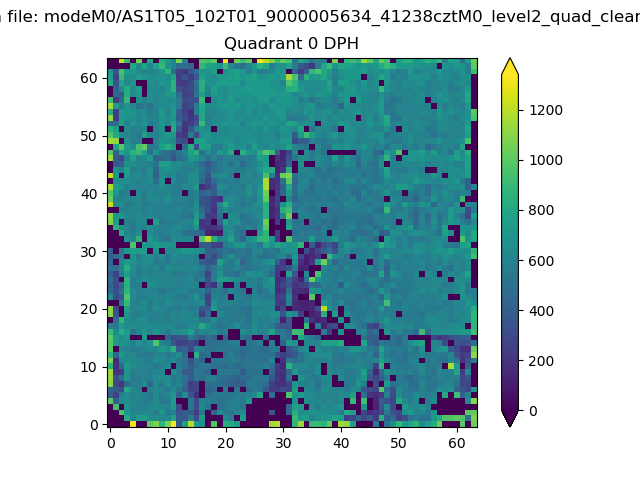 |
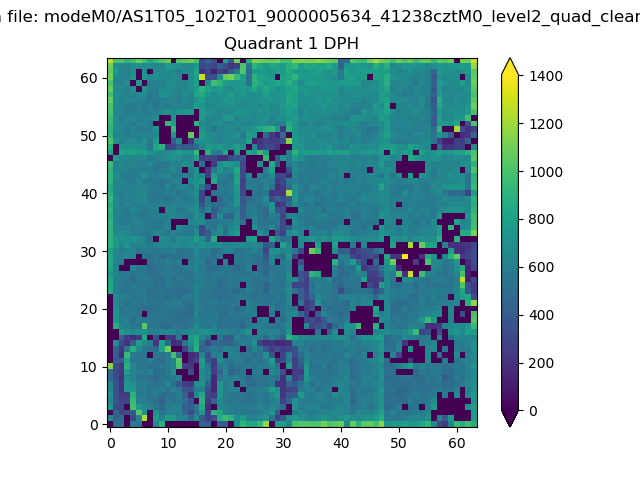 |
Quadrant B |
|---|---|---|---|
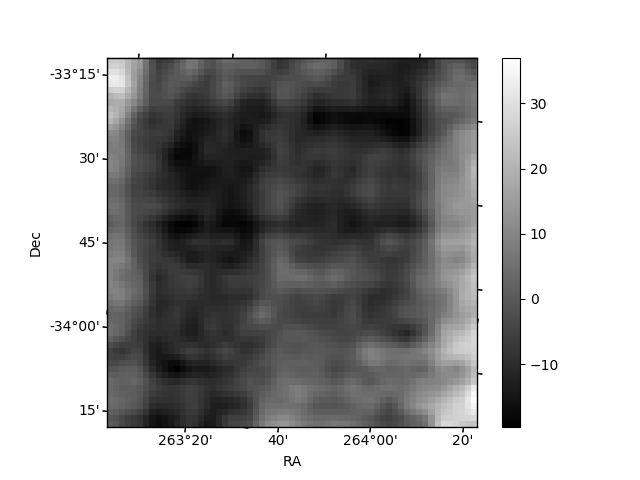
| Quadrant D | 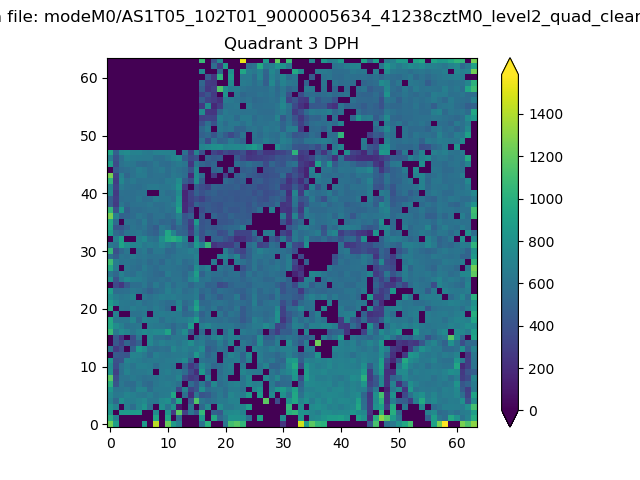 |
 |
Quadrant C |
| Plot type | Count rate plots | Images |
|---|---|---|
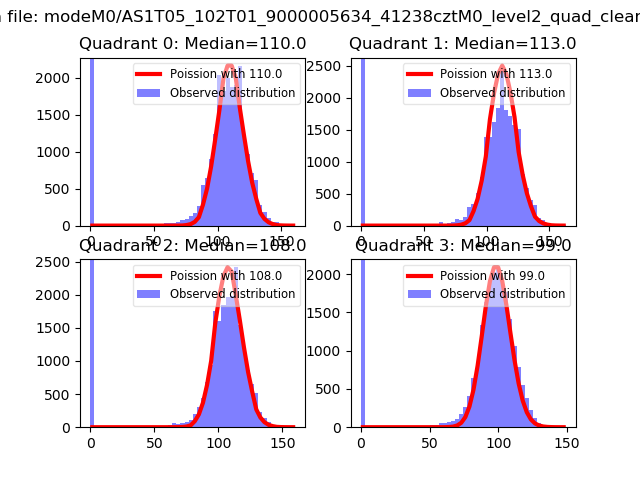
| Comparison with Poisson distribution Blue bars denote a histogram of data divided into 1 sec bins. Red curve is a Poisson curve with rate = median count rate of data. |
 |
 |
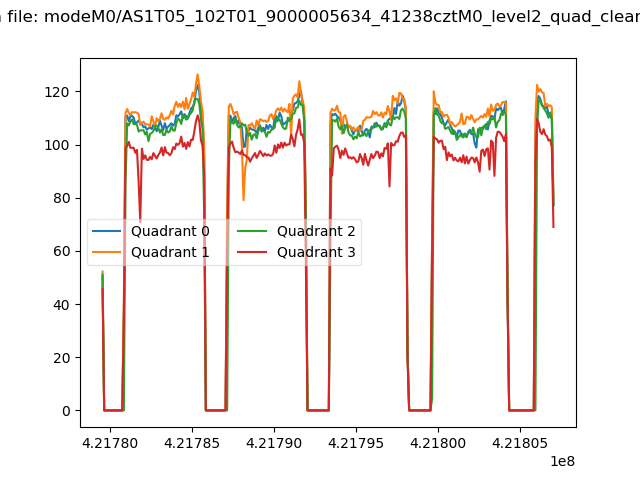
| Quadrant-wise count rates Data is divided into 100 sec bins |
 |
|
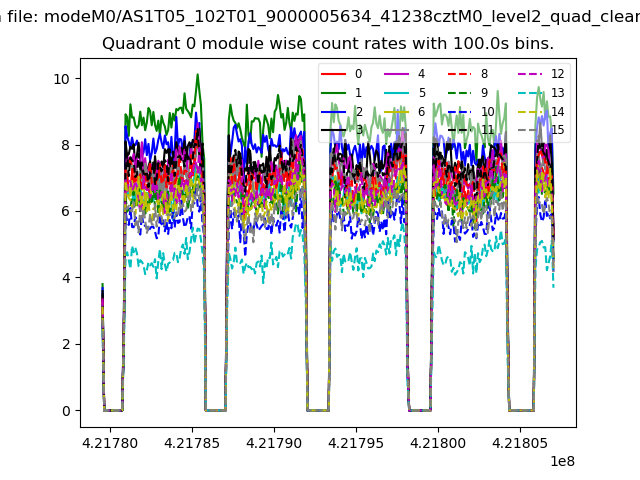
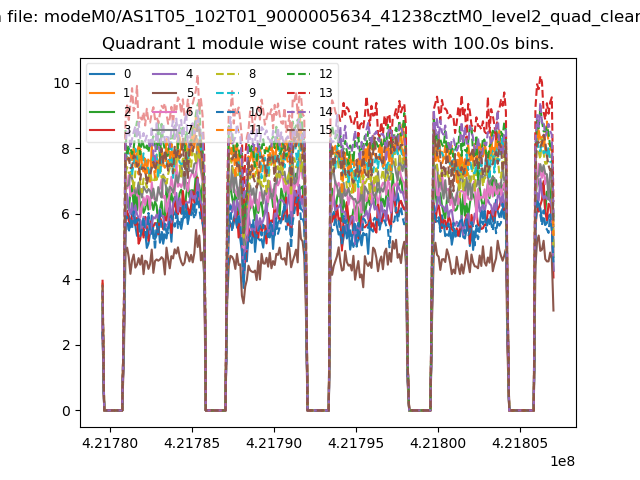
| Module-wise count rates for Quadrant A Data is divided into 100 sec bins |
 |
 |
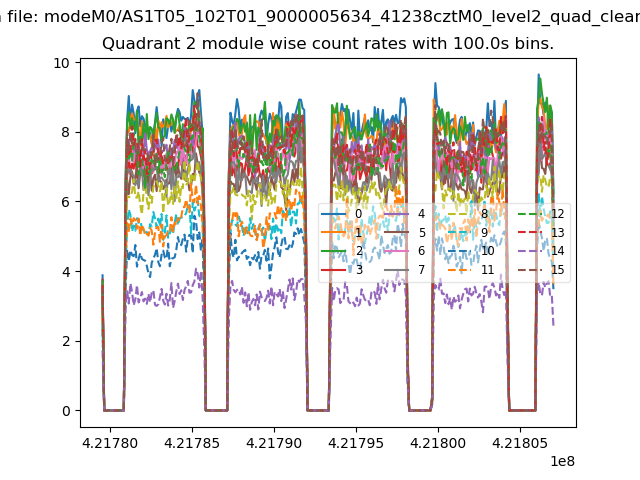
| Module-wise count rates for Quadrant B Data is divided into 100 sec bins |
 |
 |
| Module-wise count rates for Quadrant C Data is divided into 100 sec bins |
 |
 |
| Module-wise count rates for Quadrant D Data is divided into 100 sec bins |
 |
 |
| Parameter | Plot |
|---|---|
| CZT HV Monitor | 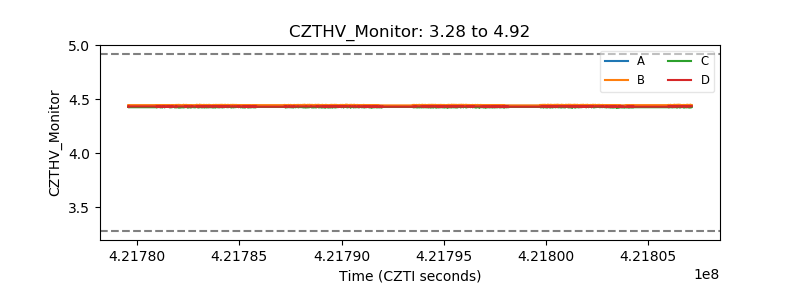 |
| D_VDD | 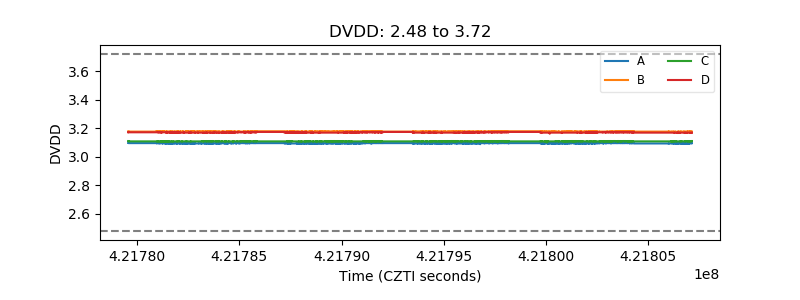 |
| Temperature 1 | 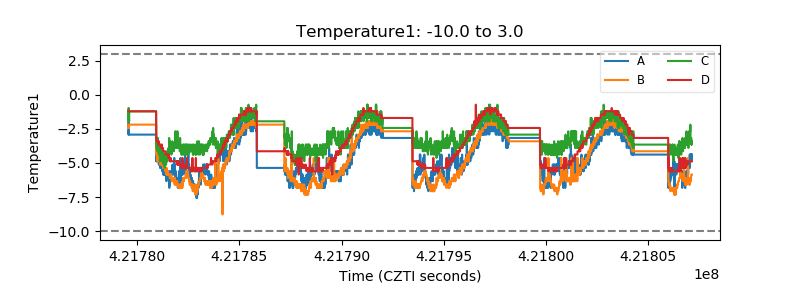 |
| Veto HV Monitor |  |
| Veto LLD | 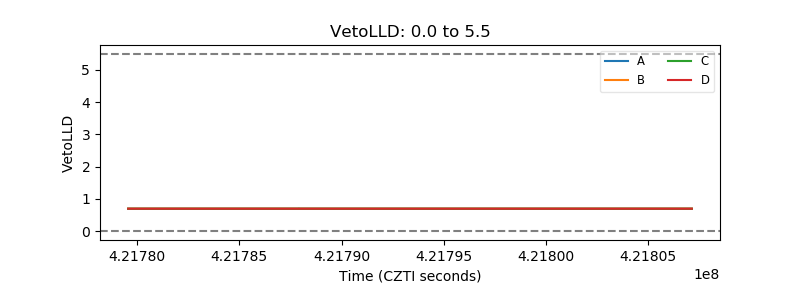 |
| Alpha Counter | 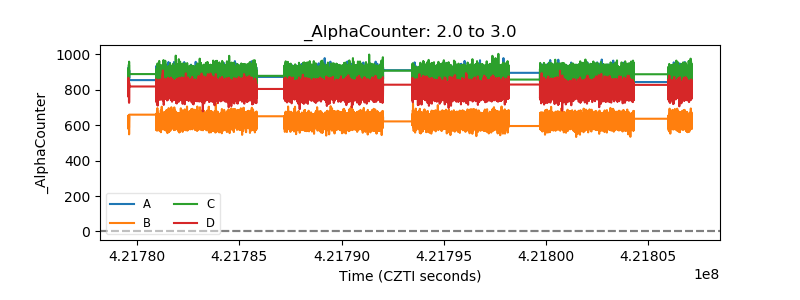 |
| _CPM_Rate | 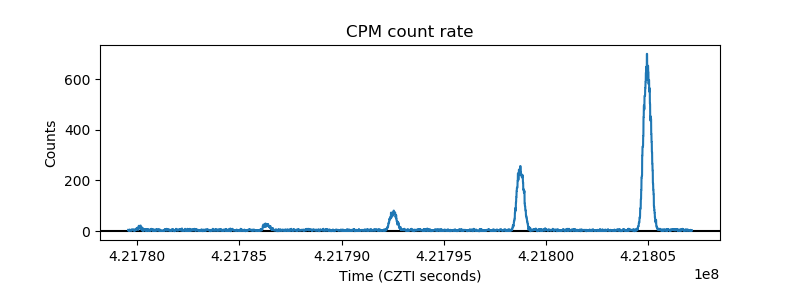 |
| CZT Counter | 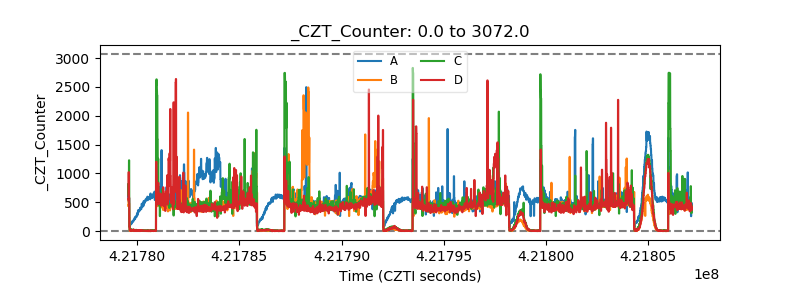 |
| +2.5 Volts monitor |  |
| +5 Volts monitor |  |
| _ROLL_ROT |  |
| _Roll_DEC | 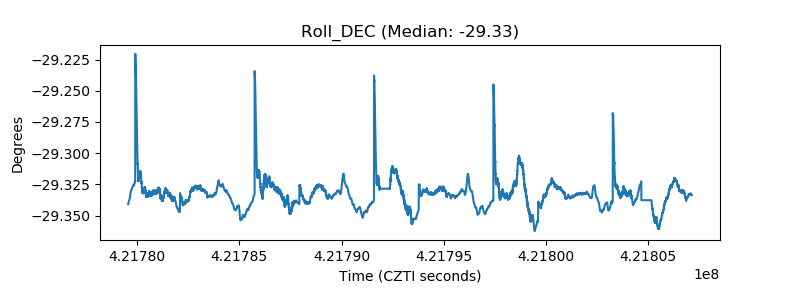 |
| _Roll_RA | 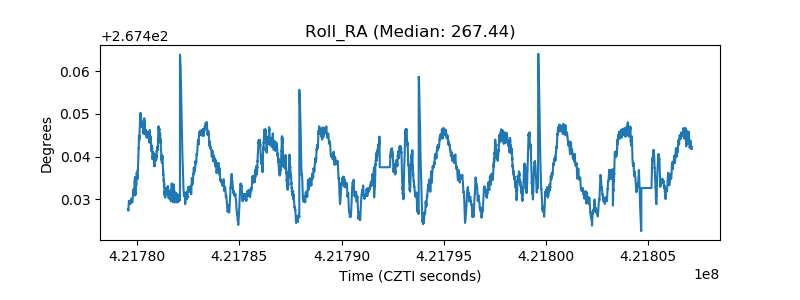 |
| Veto Counter | 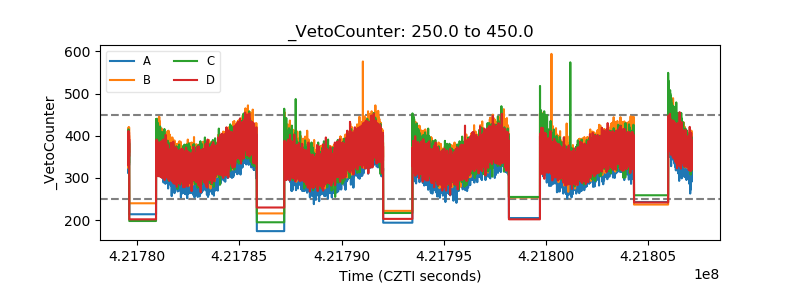 |