| Param | Original file | Final file |
|---|---|---|
| Filename | modeM0/AS1A12_035T02_9000005680cztM0_level2.fits | modeM0/AS1A12_035T02_9000005680cztM0_level2_quad_clean.evt |
| Size (bytes) | 135,483,840 | 159,284,160 |
| Size | 129.2 MB | 151.9 MB |
| Events in quadrant A | 831,042 | 1,067,121 |
| Events in quadrant B | 802,260 | 1,069,426 |
| Events in quadrant C | 811,314 | 1,001,057 |
| Events in quadrant D | 564,762 | 595,085 |
| Mode SS | |||
|---|---|---|---|
| Quadrant | BADHDUFLAG | Total packets | Discarded packets |
| A | 0 | 324 | 0 |
| B | 0 | 324 | 0 |
| C | 0 | 324 | 0 |
| D | 0 | 324 | 0 |
| Mode M0 | |||
|---|---|---|---|
| Quadrant | BADHDUFLAG | Total packets | Discarded packets |
| A | 0 | 34139 | 0 |
| B | 0 | 33710 | 0 |
| C | 0 | 35574 | 0 |
| D | 0 | 91039 | 0 |
| Mode M9 | |||
|---|---|---|---|
| Quadrant | BADHDUFLAG | Total packets | Discarded packets |
| A | 0 | 55 | 0 |
| B | 0 | 55 | 0 |
| C | 0 | 55 | 0 |
| D | 0 | 57 | 0 |
| Quadrant | Total seconds | Saturated seconds | Saturation percentage |
|---|---|---|---|
| A | 15802 | 41 | 0.259461% |
| B | 15802 | 160 | 1.012530% |
| C | 15802 | 349 | 2.208581% |
| D | 15802 | 6589 | 41.697254% |
Noise dominated data is calculated using 1-second bins in cleaned event files. If a bin has >2000 counts, and if more than 50% of those come from <1% of pixels, then it is considered to be noise-dominated and hence unusable.
| Quadrant | # 1 sec bins | Bins with >0 counts | Bins with >2000 counts | High rate bins dominated by noise | Noise dominated (total time) | Noise dominated (detector-on time) | Marked lightcurve |
|---|---|---|---|---|---|---|---|
| A | 69749 | 15800 | 0 | 0 | 0.00% | 0.00% | 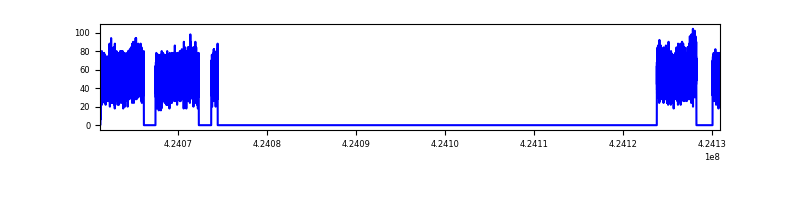 |
| B | 69749 | 15801 | 0 | 0 | 0.00% | 0.00% | 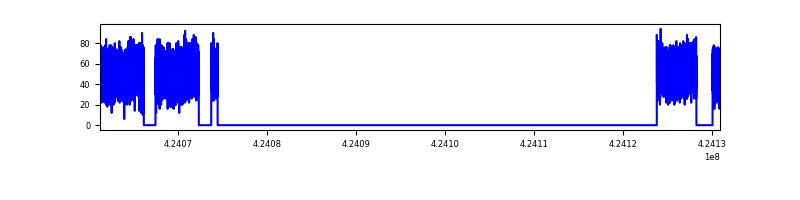 |
| C | 69749 | 15786 | 0 | 0 | 0.00% | 0.00% | 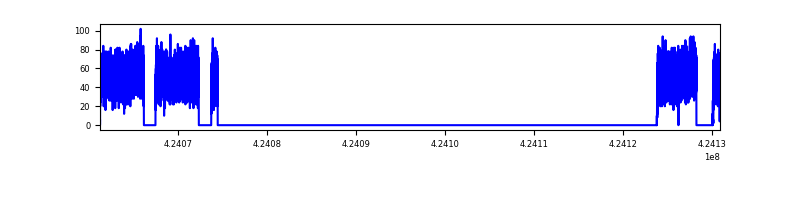 |
| D | 69749 | 15778 | 0 | 0 | 0.00% | 0.00% | 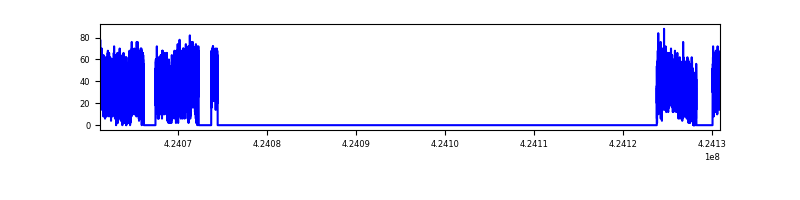 |
Top three noisy pixels from each quadrant. If the there are fewer than three noisy pixels in the level2.evt file, extra rows are filled as -1
| Pixel properties | Quadrant properties | ||||||
|---|---|---|---|---|---|---|---|
| Quadrant | DetID | PixID | Counts | Sigma | Mean | Median | Sigma |
| A | 14 | 95 | 679 | 8.35 | 217 | 203 | 57.0 |
| A | 7 | 110 | 672 | 8.23 | 217 | 203 | 57.0 |
| A | 0 | 29 | 663 | 8.07 | 217 | 203 | 57.0 |
| B | 2 | 9 | 735 | 12.3 | 212 | 202 | 43.3 |
| B | 2 | 8 | 596 | 9.09 | 212 | 202 | 43.3 |
| B | 5 | 232 | 571 | 8.52 | 212 | 202 | 43.3 |
| C | 3 | 202 | 662 | 8.14 | 214 | 200 | 56.8 |
| C | 3 | 203 | 634 | 7.65 | 214 | 200 | 56.8 |
| C | 1 | 81 | 618 | 7.36 | 214 | 200 | 56.8 |
| D | 10 | 113 | 418 | 6.03 | 161 | 147 | 45.0 |
| D | 7 | 3 | 409 | 5.83 | 161 | 147 | 45.0 |
| D | 6 | 38 | 402 | 5.67 | 161 | 147 | 45.0 |
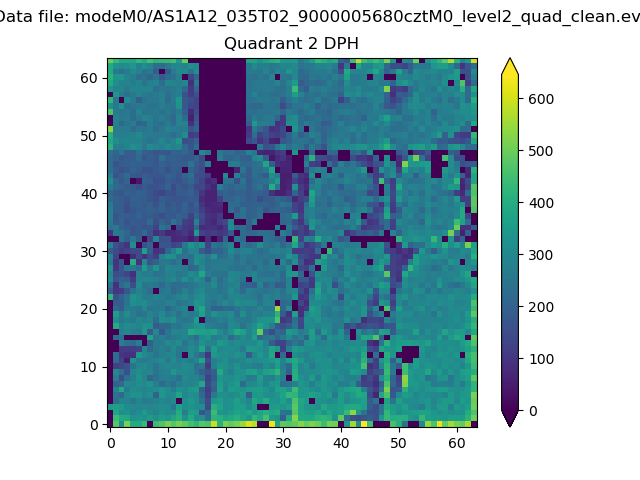
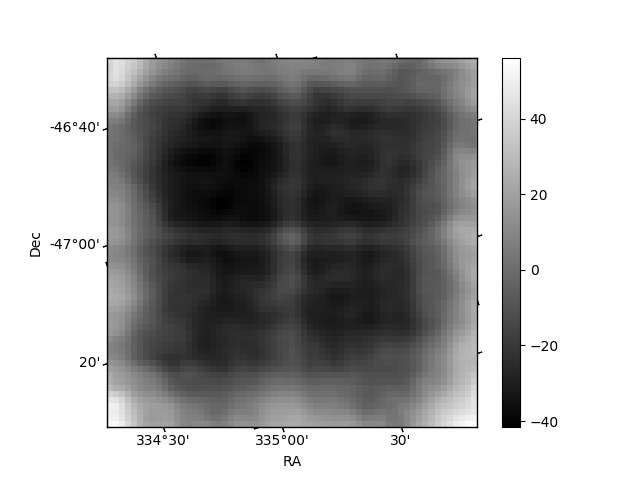
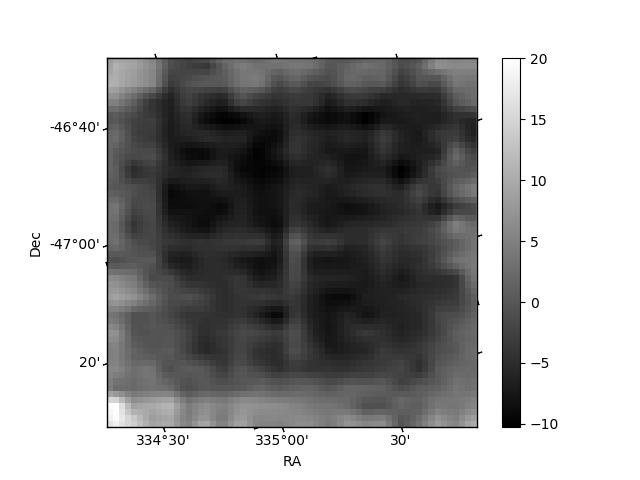
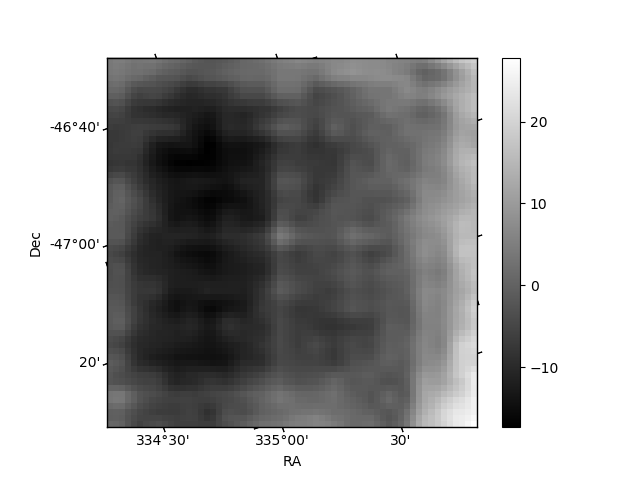
Histogram calculated using DETX and DETY for each event in the final _common_clean file
| Quadrant A | 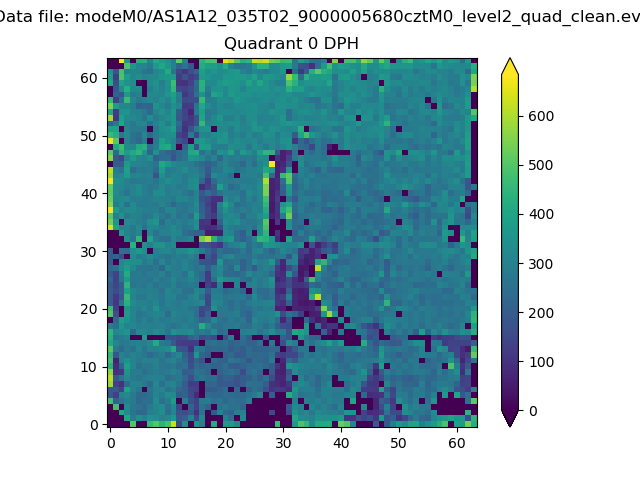 |
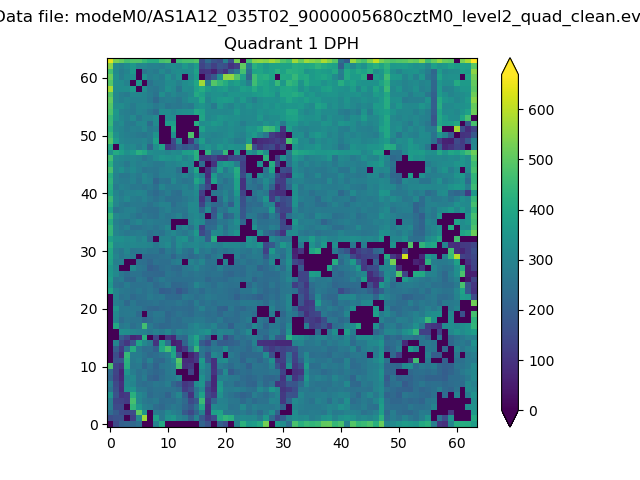 |
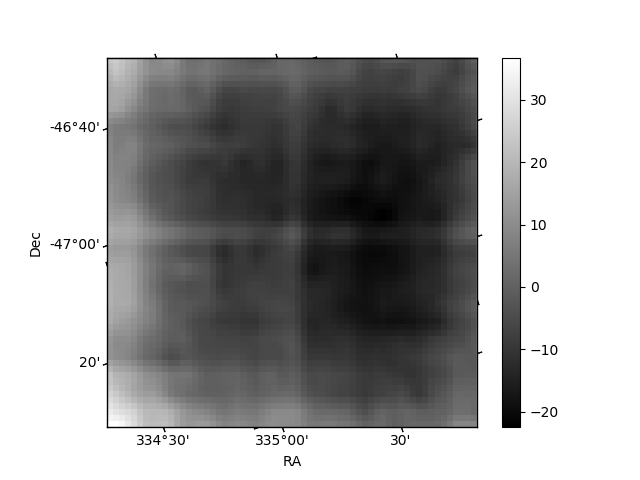
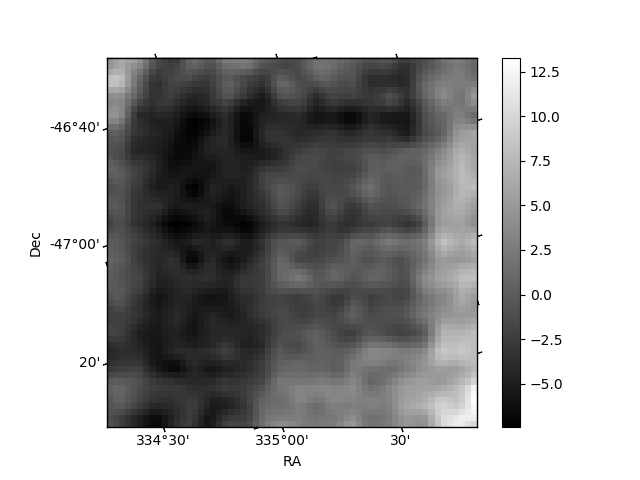
Quadrant B |
|---|---|---|---|
| Quadrant D | 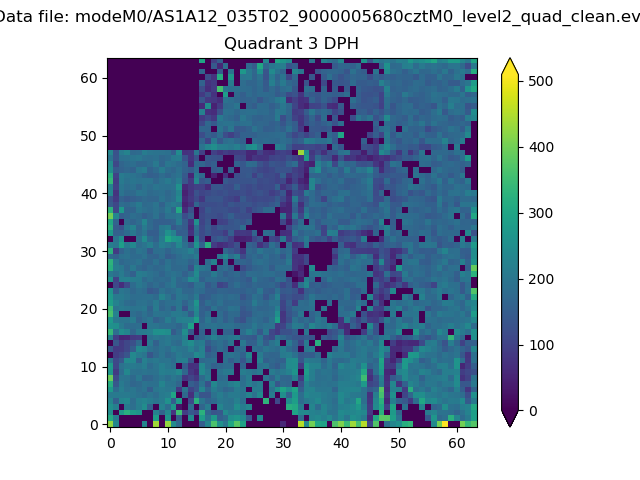 |
 |
Quadrant C |
| Plot type | Count rate plots | Images |
|---|---|---|
| Comparison with Poisson distribution Blue bars denote a histogram of data divided into 1 sec bins. Red curve is a Poisson curve with rate = median count rate of data. |
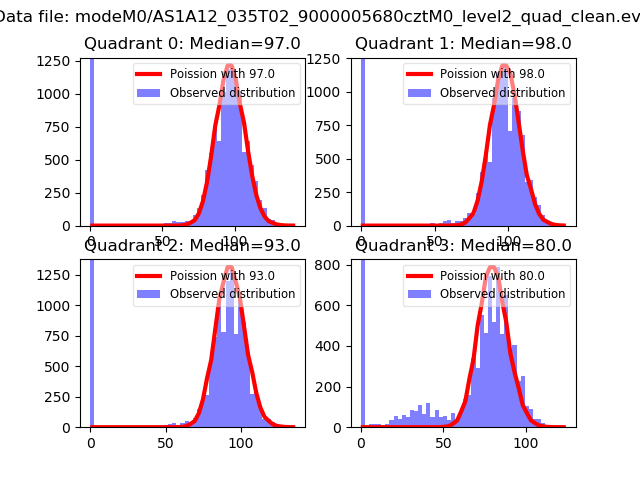 |
 |
| Quadrant-wise count rates Data is divided into 100 sec bins |
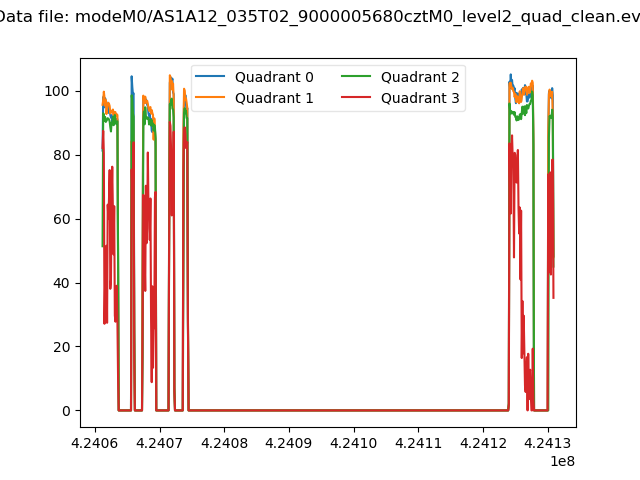 |
|
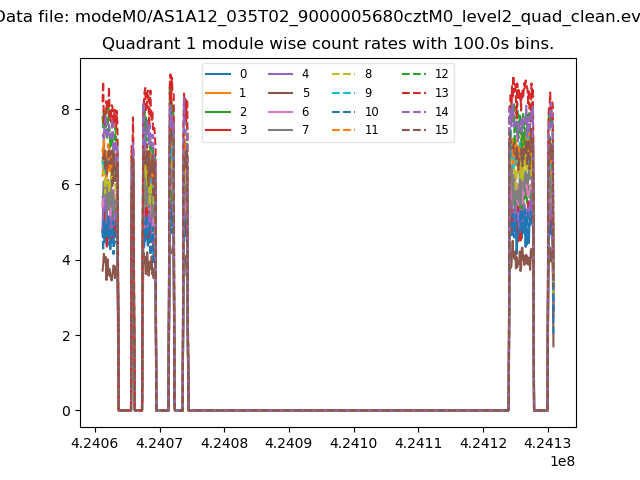
| Module-wise count rates for Quadrant A Data is divided into 100 sec bins |
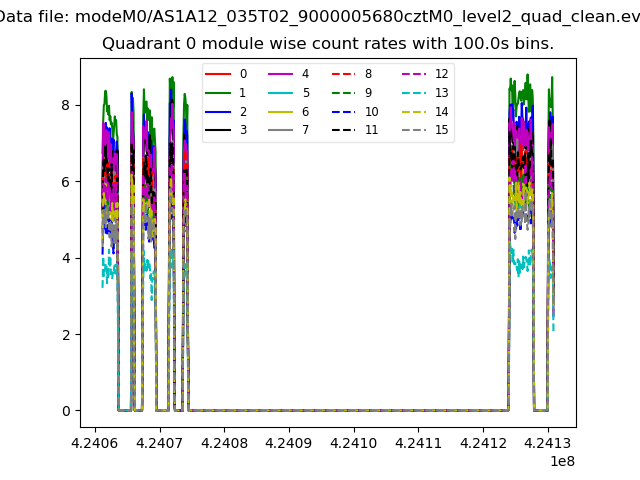 |
 |
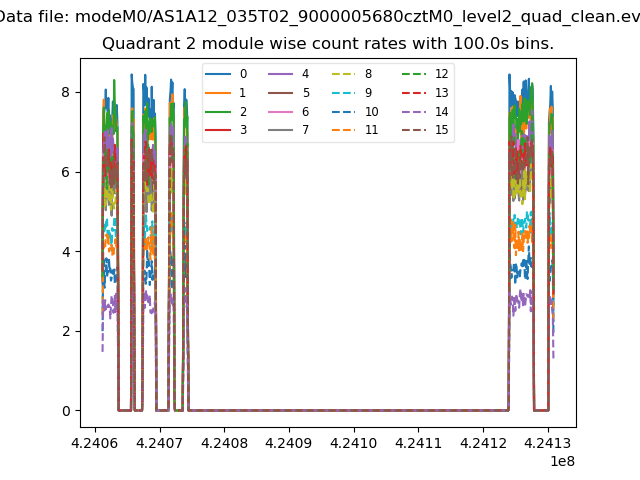
| Module-wise count rates for Quadrant B Data is divided into 100 sec bins |
 |
 |
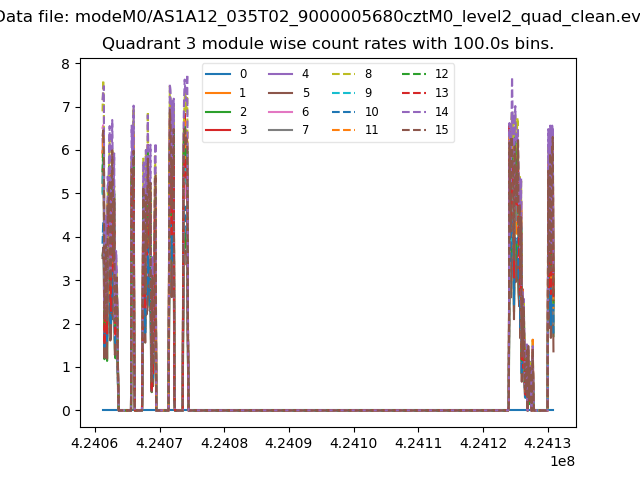
| Module-wise count rates for Quadrant C Data is divided into 100 sec bins |
 |
 |
| Module-wise count rates for Quadrant D Data is divided into 100 sec bins |
 |
 |
| Parameter | Plot |
|---|---|
| CZT HV Monitor | 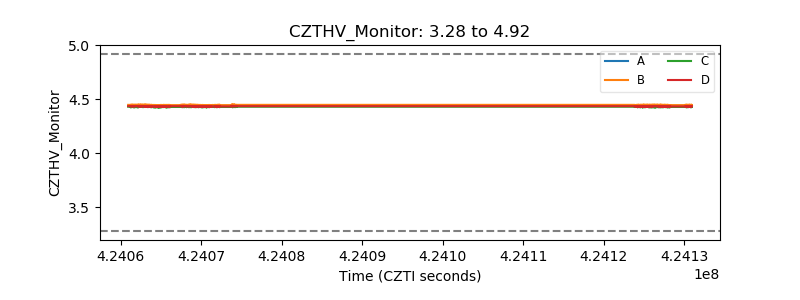 |
| D_VDD | 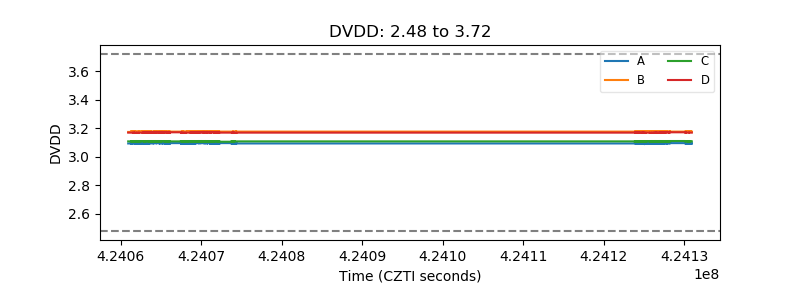 |
| Temperature 1 | 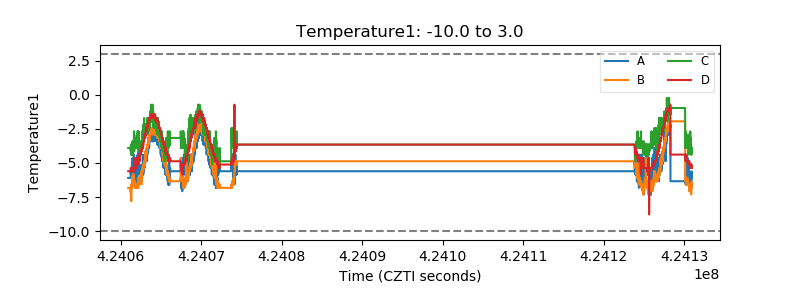 |
| Veto HV Monitor |  |
| Veto LLD | 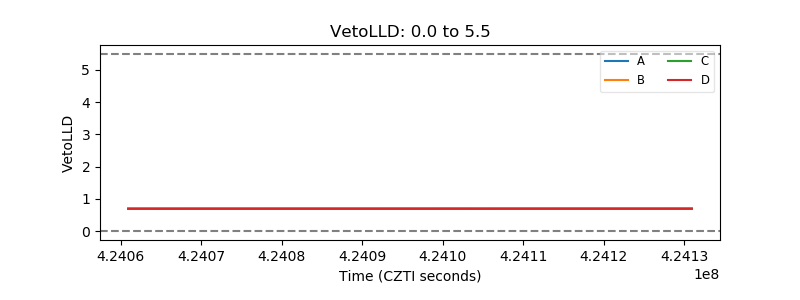 |
| Alpha Counter | 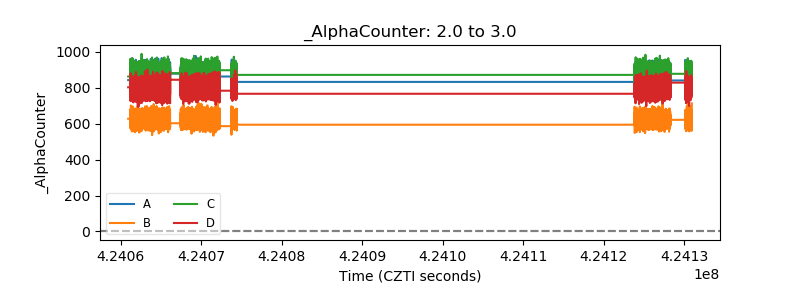 |
| _CPM_Rate | 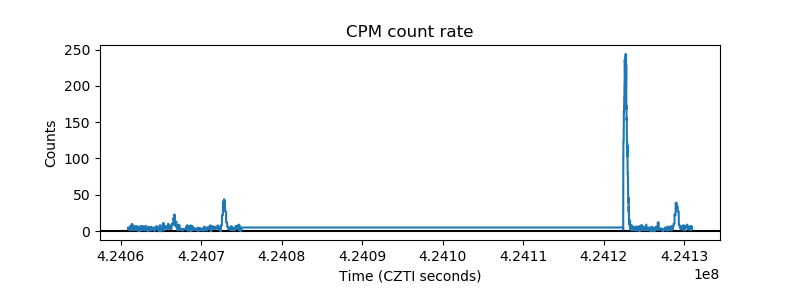 |
| CZT Counter | 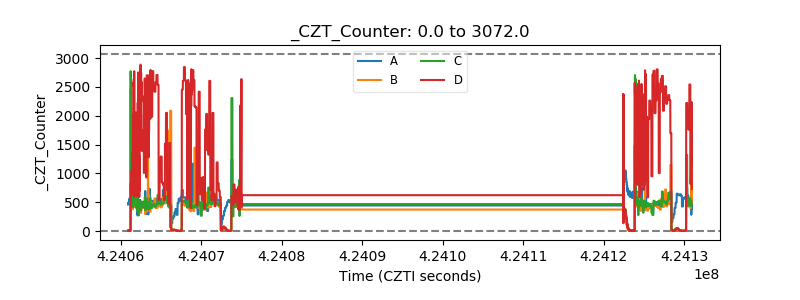 |
| +2.5 Volts monitor | 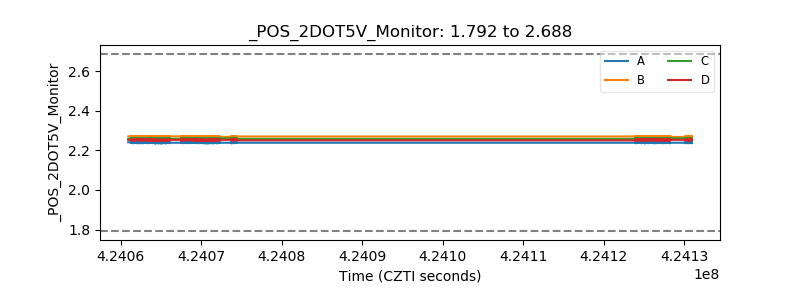 |
| +5 Volts monitor | 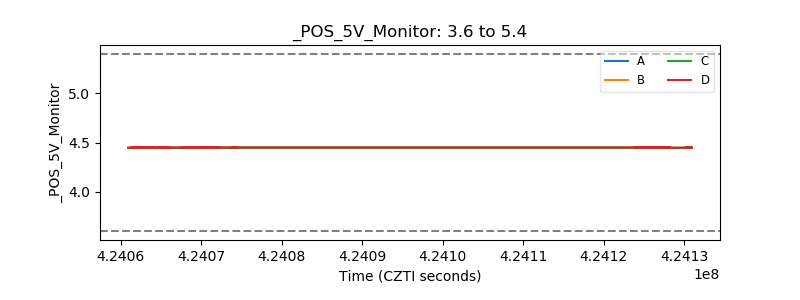 |
| _ROLL_ROT | 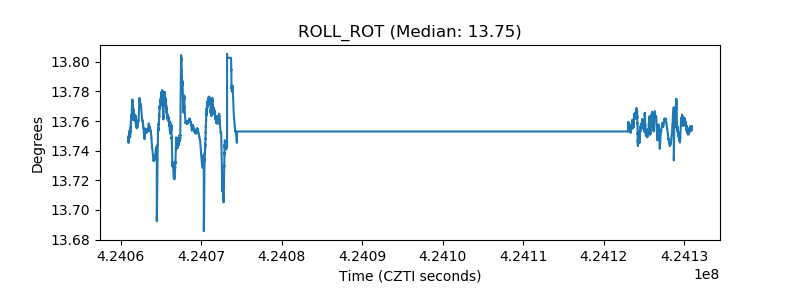 |
| _Roll_DEC | 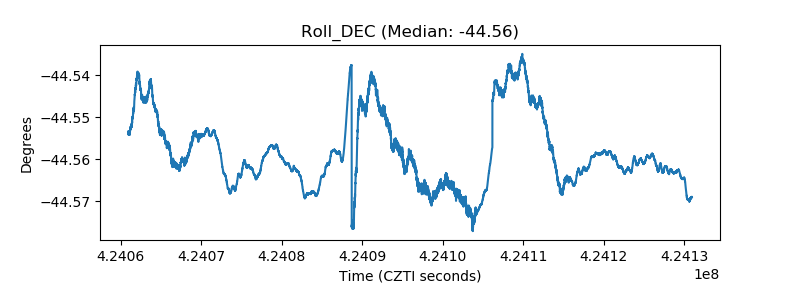 |
| _Roll_RA | 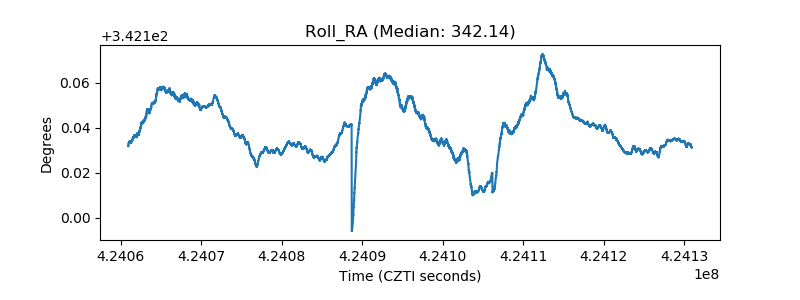 |
| Veto Counter | 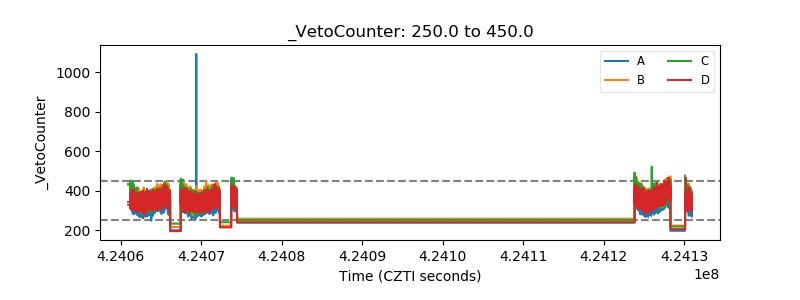 |