| Param | Original file | Final file |
|---|---|---|
| Filename | modeM0/AS1A05_013T01_9000005822_42787cztM0_level2.fits | modeM0/AS1A05_013T01_9000005822_42787cztM0_level2_quad_clean.evt |
| Size (bytes) | 941,581,440 | 254,790,720 |
| Size | 898.0 MB | 243.0 MB |
| Events in quadrant A | 8,504,010 | 1,709,188 |
| Events in quadrant B | 8,602,422 | 1,662,316 |
| Events in quadrant C | 7,278,947 | 1,700,230 |
| Events in quadrant D | 9,267,639 | 1,572,305 |
| Mode M0 | |||
|---|---|---|---|
| Quadrant | BADHDUFLAG | Total packets | Discarded packets |
| A | 0 | 34095 | 3 |
| B | 0 | 36169 | 3 |
| C | 0 | 31467 | 3 |
| D | 0 | 38515 | 3 |
| Mode M9 | |||
|---|---|---|---|
| Quadrant | BADHDUFLAG | Total packets | Discarded packets |
| A | 0 | 41 | 0 |
| B | 0 | 41 | 0 |
| C | 0 | 41 | 0 |
| D | 0 | 41 | 0 |
| Mode SS | |||
|---|---|---|---|
| Quadrant | BADHDUFLAG | Total packets | Discarded packets |
| A | 0 | 318 | 0 |
| B | 0 | 318 | 0 |
| C | 0 | 318 | 0 |
| D | 0 | 318 | 0 |
| Quadrant | Total seconds | Saturated seconds | Saturation percentage |
|---|---|---|---|
| A | 15505 | 39 | 0.251532% |
| B | 15504 | 422 | 2.721878% |
| C | 15505 | 8 | 0.051596% |
| D | 15505 | 328 | 2.115447% |
Noise dominated data is calculated using 1-second bins in cleaned event files. If a bin has >2000 counts, and if more than 50% of those come from <1% of pixels, then it is considered to be noise-dominated and hence unusable.
| Quadrant | # 1 sec bins | Bins with >0 counts | Bins with >2000 counts | High rate bins dominated by noise | Noise dominated (total time) | Noise dominated (detector-on time) | Marked lightcurve |
|---|---|---|---|---|---|---|---|
| A | 19686 | 15508 | 18 | 18 | 0.09% | 0.12% | 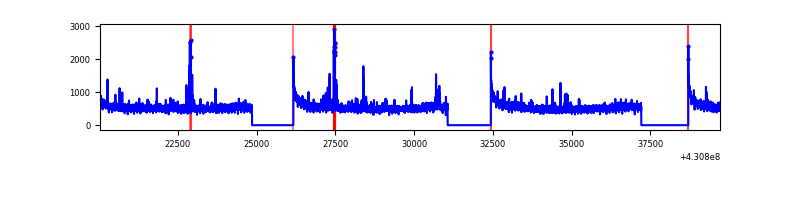 |
| B | 19685 | 15507 | 387 | 387 | 1.97% | 2.50% | 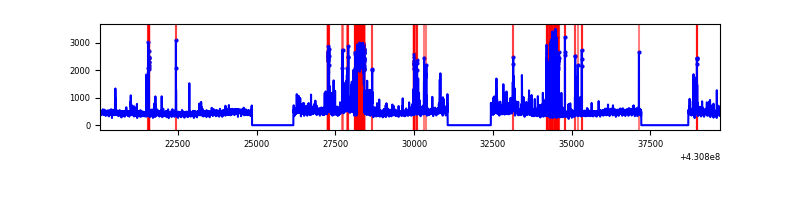 |
| C | 19686 | 15508 | 3 | 3 | 0.02% | 0.02% | 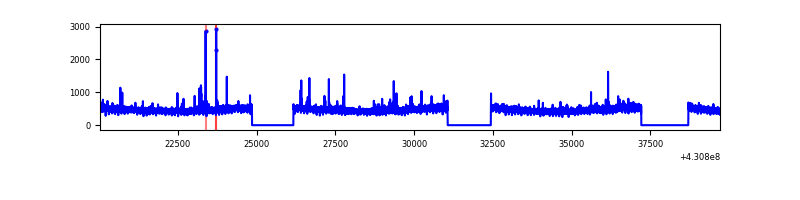 |
| D | 19686 | 15508 | 339 | 339 | 1.72% | 2.19% | 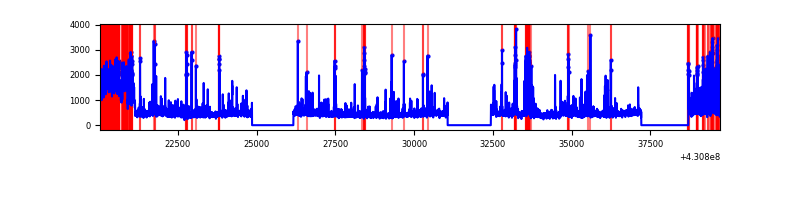 |
Top three noisy pixels from each quadrant. If the there are fewer than three noisy pixels in the level2.evt file, extra rows are filled as -1
| Pixel properties | Quadrant properties | ||||||
|---|---|---|---|---|---|---|---|
| Quadrant | DetID | PixID | Counts | Sigma | Mean | Median | Sigma |
| A | 10 | 83 | 1545954 | 4365.59 | 1723 | 1687 | 353.7 |
| A | 15 | 223 | 124722 | 347.82 | 1723 | 1687 | 353.7 |
| A | 12 | 189 | 71118 | 196.28 | 1723 | 1687 | 353.7 |
| B | 10 | 247 | 1211700 | 3723.48 | 1671 | 1623 | 325.0 |
| B | 0 | 229 | 528222 | 1620.38 | 1671 | 1623 | 325.0 |
| B | 10 | 246 | 81149 | 244.71 | 1671 | 1623 | 325.0 |
| C | 15 | 214 | 622801 | 1583.4 | 1676 | 1685 | 392.3 |
| C | 14 | 254 | 96644 | 242.08 | 1676 | 1685 | 392.3 |
| C | 3 | 233 | 11656 | 25.42 | 1676 | 1685 | 392.3 |
| D | 13 | 169 | 1305810 | 3182.96 | 1676 | 1631 | 409.7 |
| D | 1 | 52 | 498605 | 1212.91 | 1676 | 1631 | 409.7 |
| D | 2 | 249 | 213127 | 516.17 | 1676 | 1631 | 409.7 |
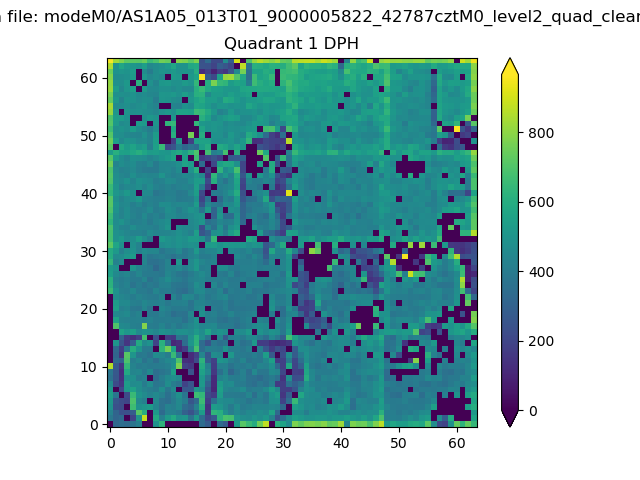
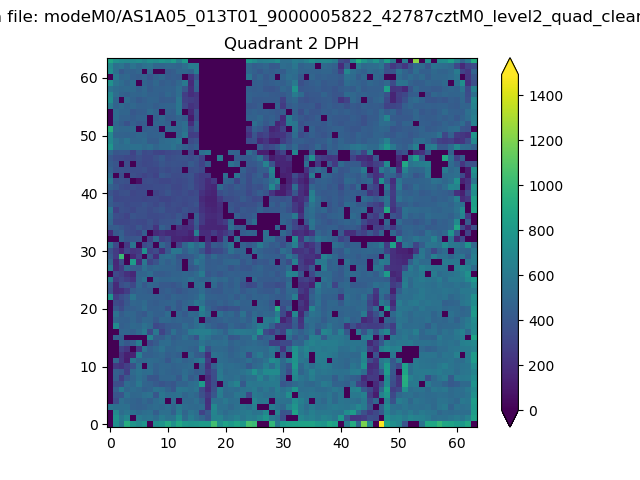
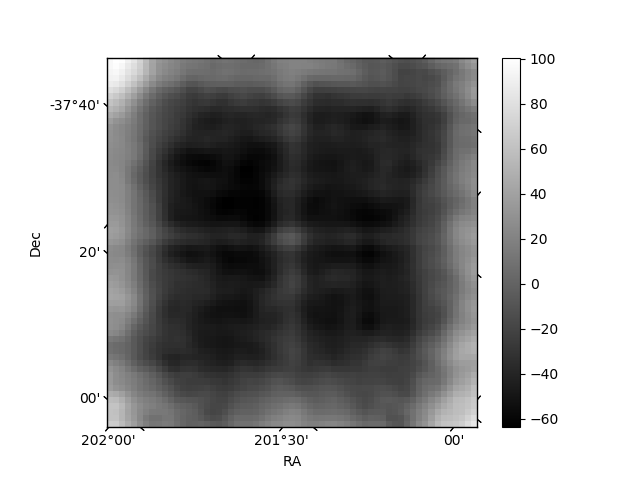
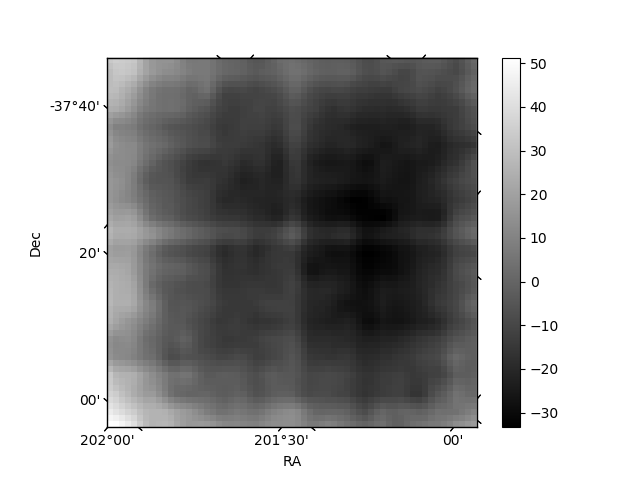
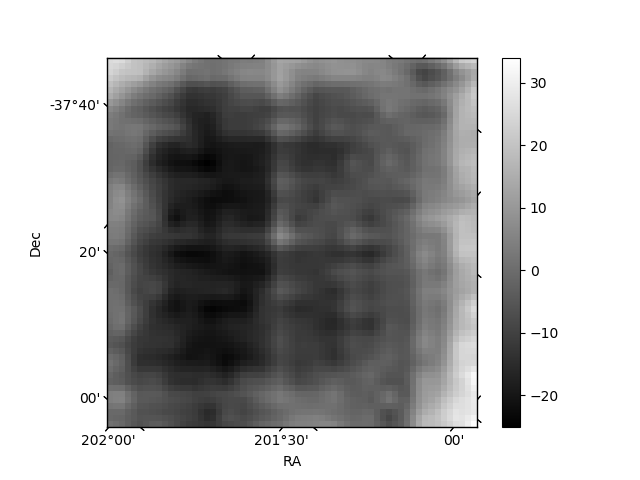
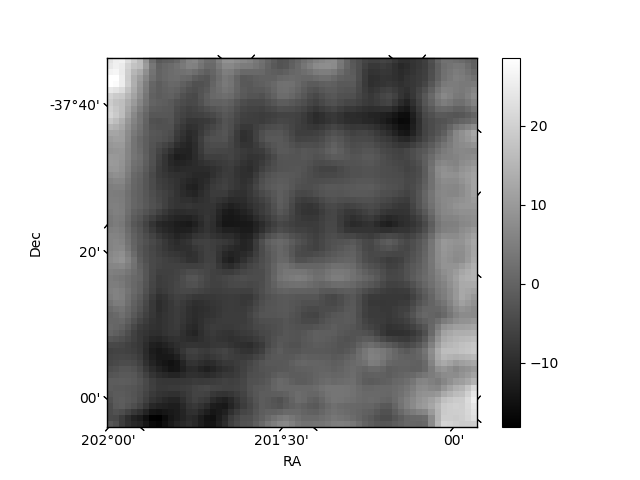
Histogram calculated using DETX and DETY for each event in the final _common_clean file
| Quadrant A |  |
 |
Quadrant B |
|---|---|---|---|
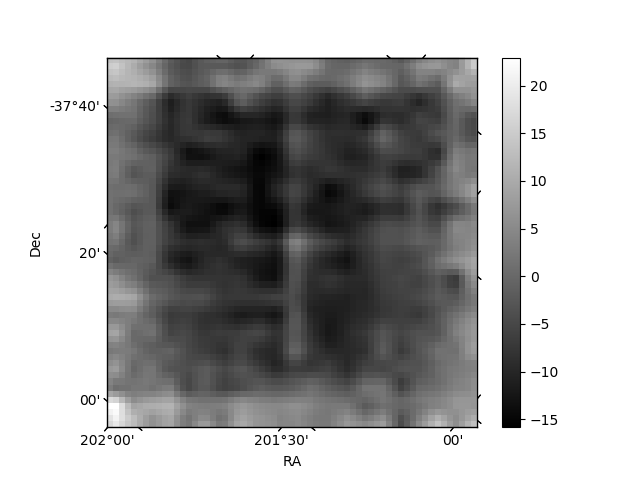
| Quadrant D | 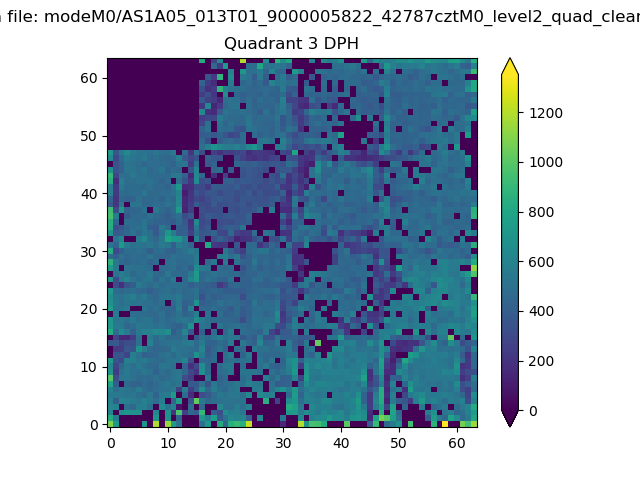 |
 |
Quadrant C |
| Plot type | Count rate plots | Images |
|---|---|---|
| Comparison with Poisson distribution Blue bars denote a histogram of data divided into 1 sec bins. Red curve is a Poisson curve with rate = median count rate of data. |
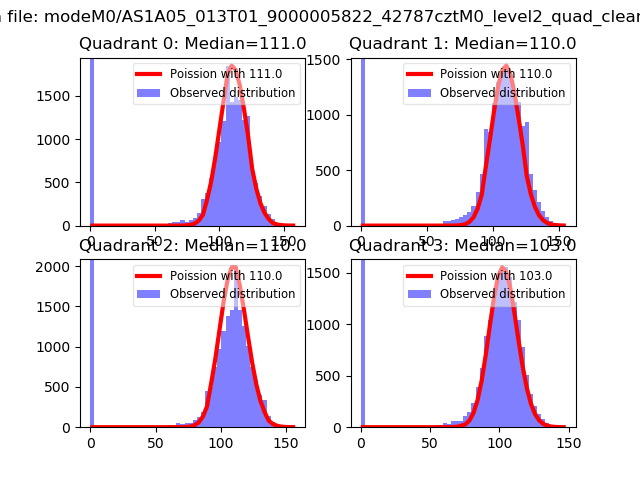 |
 |
| Quadrant-wise count rates Data is divided into 100 sec bins |
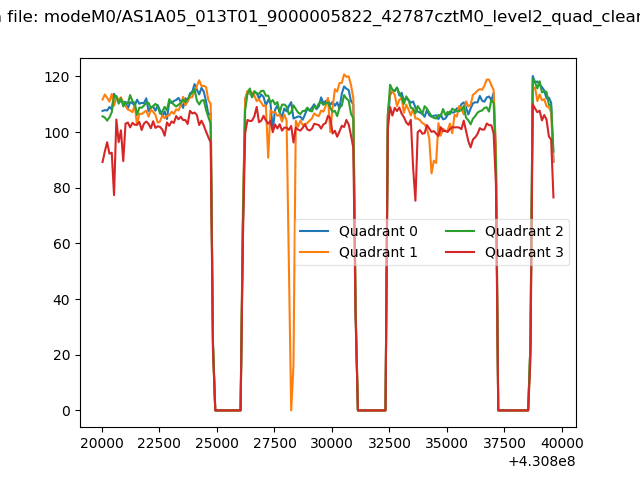 |
|
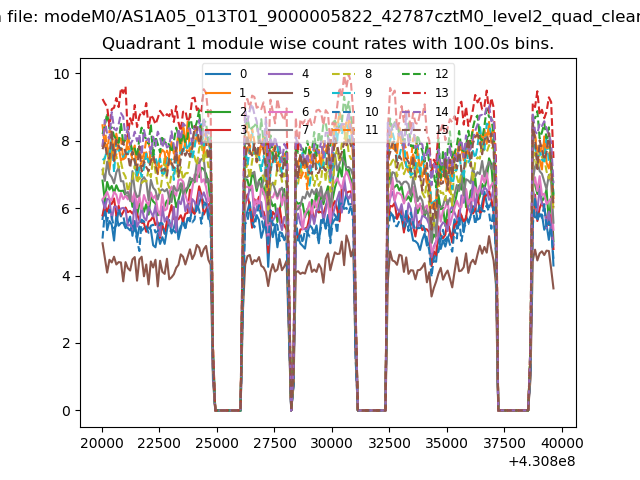
| Module-wise count rates for Quadrant A Data is divided into 100 sec bins |
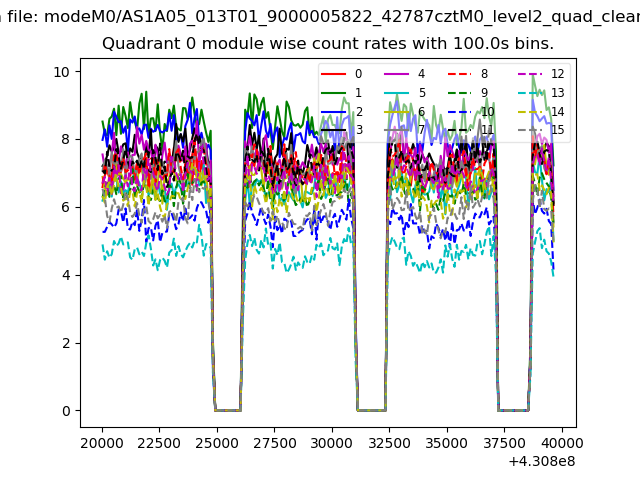 |
 |
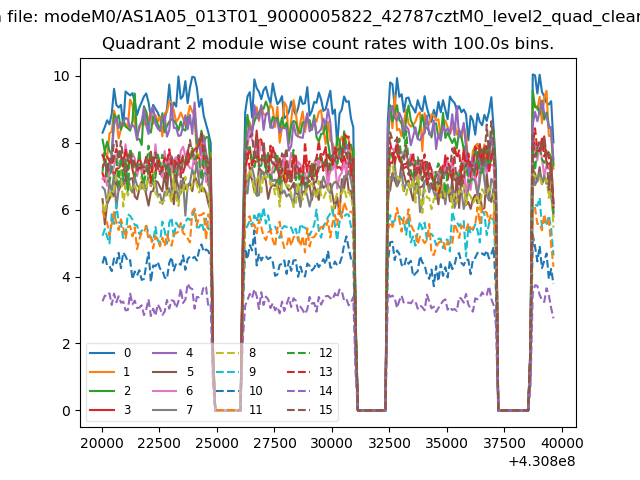
| Module-wise count rates for Quadrant B Data is divided into 100 sec bins |
 |
 |
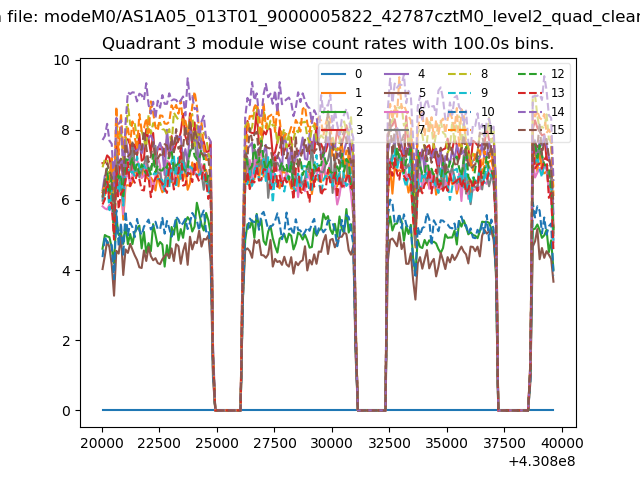
| Module-wise count rates for Quadrant C Data is divided into 100 sec bins |
 |
 |
| Module-wise count rates for Quadrant D Data is divided into 100 sec bins |
 |
 |
| Parameter | Plot |
|---|---|
| CZT HV Monitor | 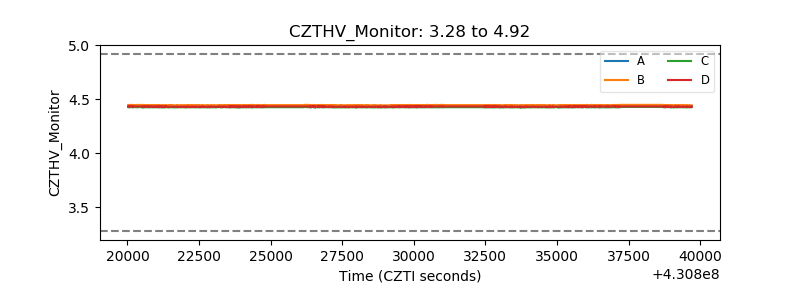 |
| D_VDD | 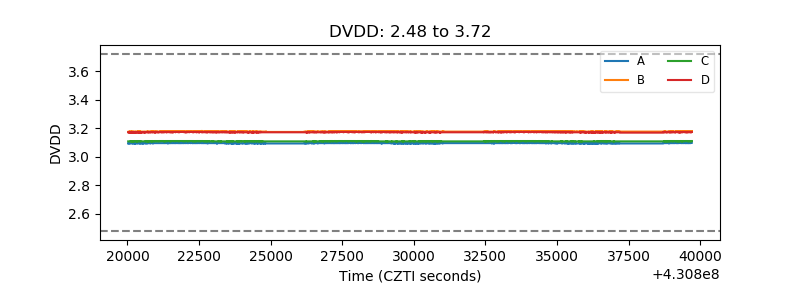 |
| Temperature 1 |  |
| Veto HV Monitor |  |
| Veto LLD | 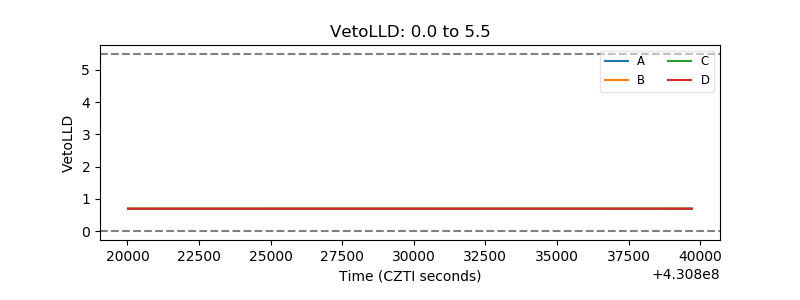 |
| Alpha Counter | 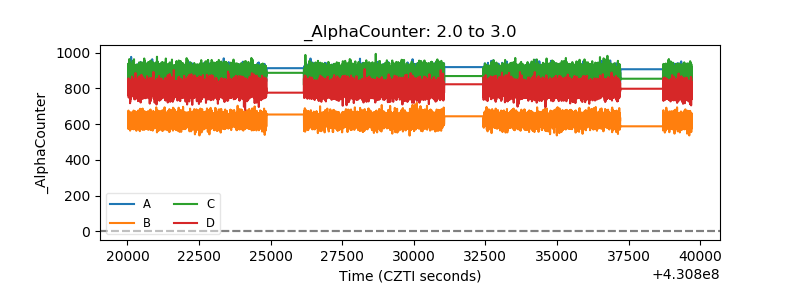 |
| _CPM_Rate | 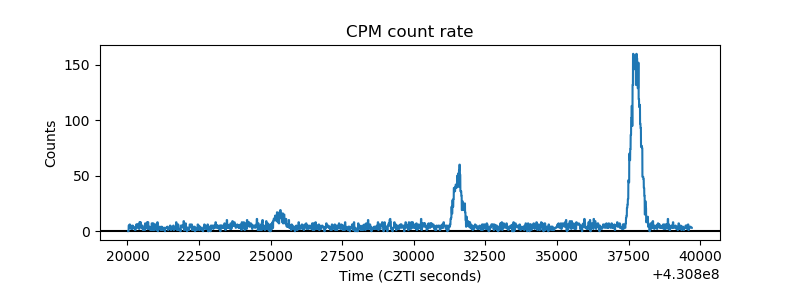 |
| CZT Counter | 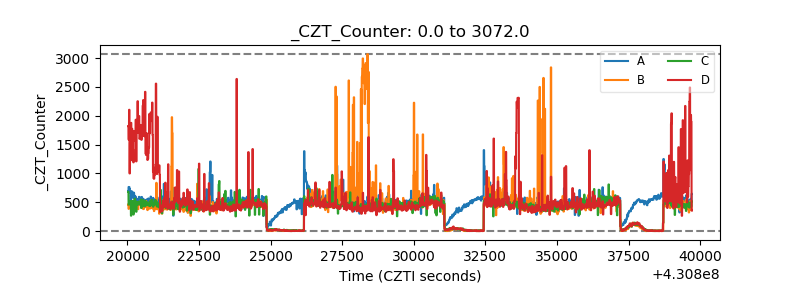 |
| +2.5 Volts monitor | 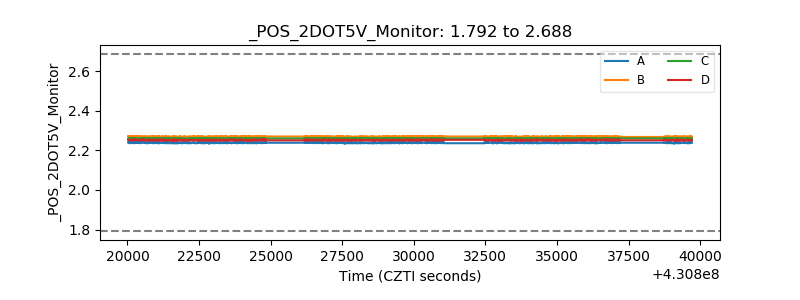 |
| +5 Volts monitor | 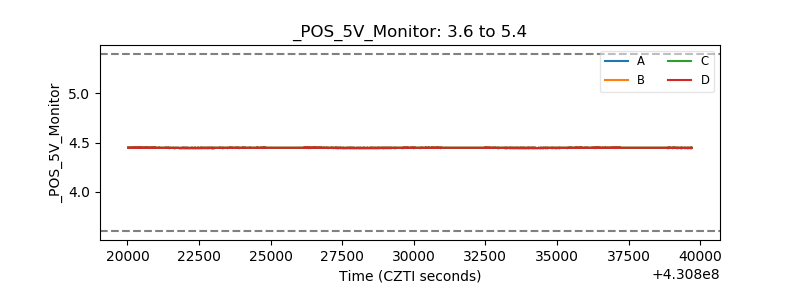 |
| _ROLL_ROT | 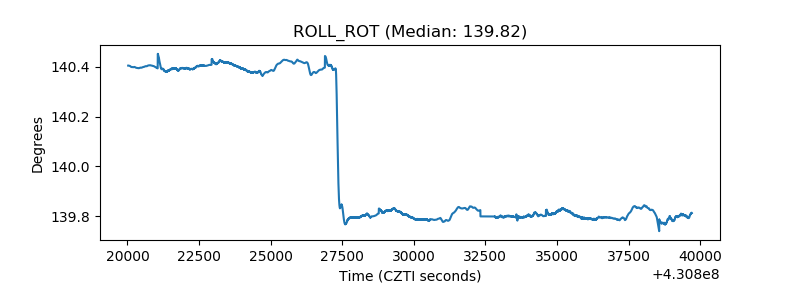 |
| _Roll_DEC |  |
| _Roll_RA | 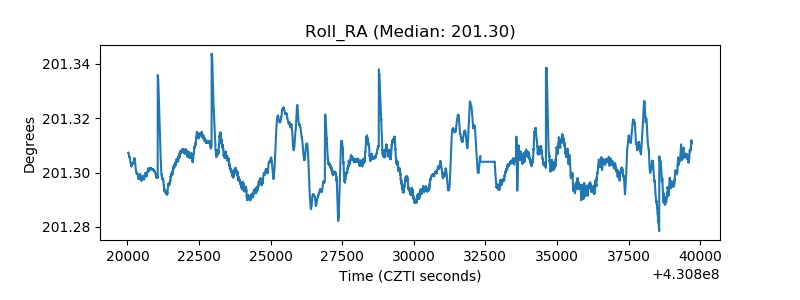 |
| Veto Counter | 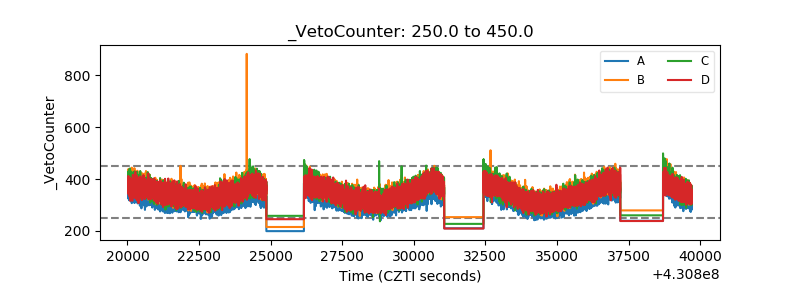 |