| Param | Original file | Final file |
|---|---|---|
| Filename | modeM0/AS1A09_036T17_9000005858_43184cztM0_level2.fits | modeM0/AS1A09_036T17_9000005858_43184cztM0_level2_quad_clean.evt |
| Size (bytes) | 367,488,000 | 92,439,360 |
| Size | 350.5 MB | 88.2 MB |
| Events in quadrant A | 4,490,659 | 591,822 |
| Events in quadrant B | 3,197,050 | 645,396 |
| Events in quadrant C | 2,771,520 | 619,562 |
| Events in quadrant D | 2,729,637 | 569,713 |
| Mode M0 | |||
|---|---|---|---|
| Quadrant | BADHDUFLAG | Total packets | Discarded packets |
| A | 0 | 16891 | 2 |
| B | 0 | 13031 | 2 |
| C | 0 | 11393 | 2 |
| D | 0 | 11754 | 2 |
| Mode SS | |||
|---|---|---|---|
| Quadrant | BADHDUFLAG | Total packets | Discarded packets |
| A | 0 | 108 | 0 |
| B | 0 | 108 | 0 |
| C | 0 | 108 | 0 |
| D | 0 | 108 | 0 |
| Mode M9 | |||
|---|---|---|---|
| Quadrant | BADHDUFLAG | Total packets | Discarded packets |
| A | 0 | 22 | 0 |
| B | 0 | 23 | 0 |
| C | 0 | 23 | 0 |
| D | 0 | 23 | 0 |
| Quadrant | Total seconds | Saturated seconds | Saturation percentage |
|---|---|---|---|
| A | 5323 | 483 | 9.073831% |
| B | 5323 | 131 | 2.461018% |
| C | 5323 | 15 | 0.281796% |
| D | 5323 | 65 | 1.221116% |
Noise dominated data is calculated using 1-second bins in cleaned event files. If a bin has >2000 counts, and if more than 50% of those come from <1% of pixels, then it is considered to be noise-dominated and hence unusable.
| Quadrant | # 1 sec bins | Bins with >0 counts | Bins with >2000 counts | High rate bins dominated by noise | Noise dominated (total time) | Noise dominated (detector-on time) | Marked lightcurve |
|---|---|---|---|---|---|---|---|
| A | 7416 | 5324 | 420 | 420 | 5.66% | 7.89% | 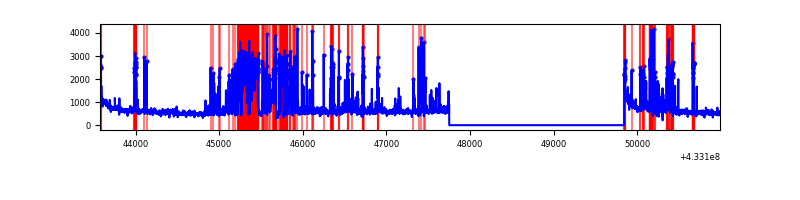 |
| B | 7416 | 5324 | 73 | 73 | 0.98% | 1.37% | 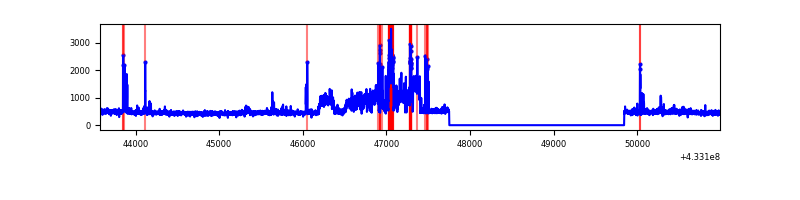 |
| C | 7416 | 5324 | 14 | 14 | 0.19% | 0.26% | 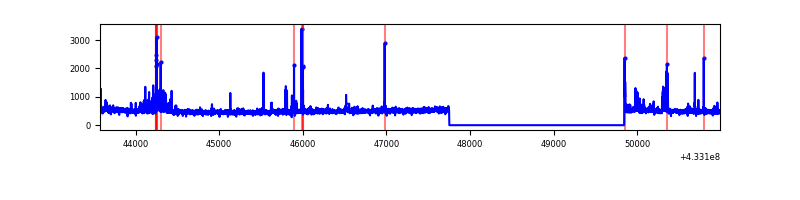 |
| D | 7416 | 5324 | 56 | 56 | 0.76% | 1.05% | 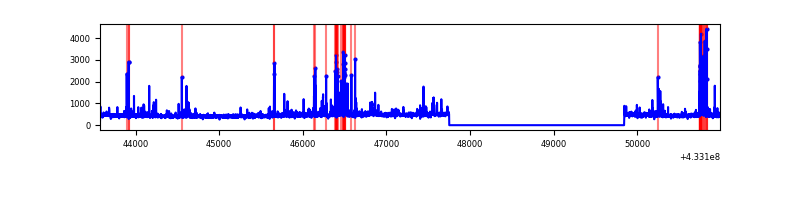 |
Top three noisy pixels from each quadrant. If the there are fewer than three noisy pixels in the level2.evt file, extra rows are filled as -1
| Pixel properties | Quadrant properties | ||||||
|---|---|---|---|---|---|---|---|
| Quadrant | DetID | PixID | Counts | Sigma | Mean | Median | Sigma |
| A | 15 | 222 | 1089345 | 8994.19 | 592 | 581 | 121.1 |
| A | 10 | 83 | 561780 | 4636.02 | 592 | 581 | 121.1 |
| A | 15 | 237 | 410037 | 3382.48 | 592 | 581 | 121.1 |
| B | 0 | 186 | 442491 | 3770.53 | 603 | 588 | 117.2 |
| B | 0 | 229 | 259422 | 2208.5 | 603 | 588 | 117.2 |
| B | 5 | 255 | 100706 | 854.25 | 603 | 588 | 117.2 |
| C | 15 | 214 | 224328 | 1598.74 | 597 | 603 | 139.9 |
| C | 0 | 239 | 77627 | 550.42 | 597 | 603 | 139.9 |
| C | 4 | 254 | 71546 | 506.96 | 597 | 603 | 139.9 |
| D | 1 | 52 | 180386 | 1220.63 | 600 | 582 | 147.3 |
| D | 12 | 233 | 159993 | 1082.19 | 600 | 582 | 147.3 |
| D | 2 | 249 | 38876 | 259.97 | 600 | 582 | 147.3 |
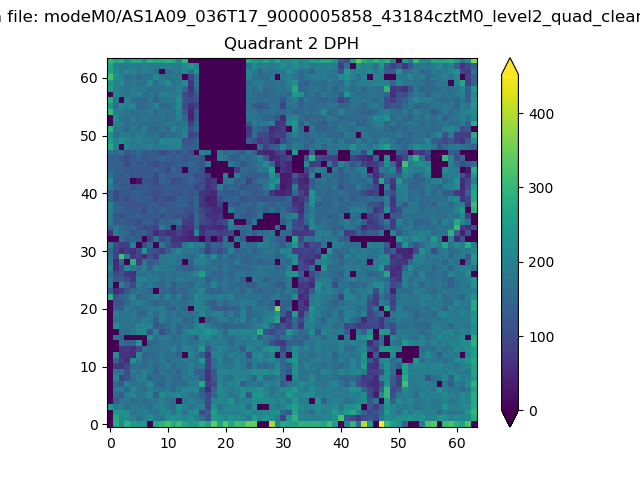
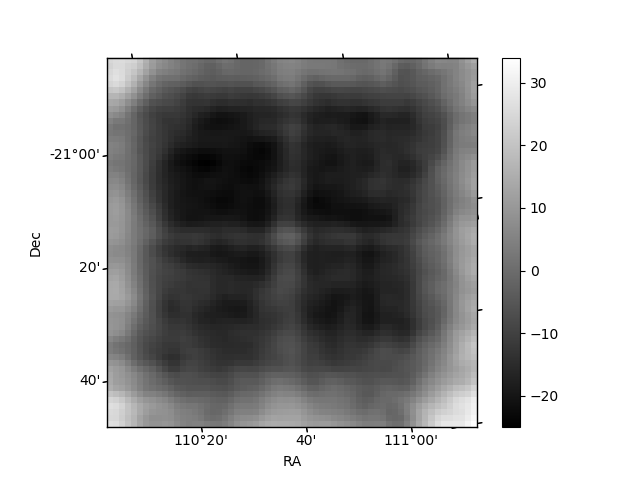
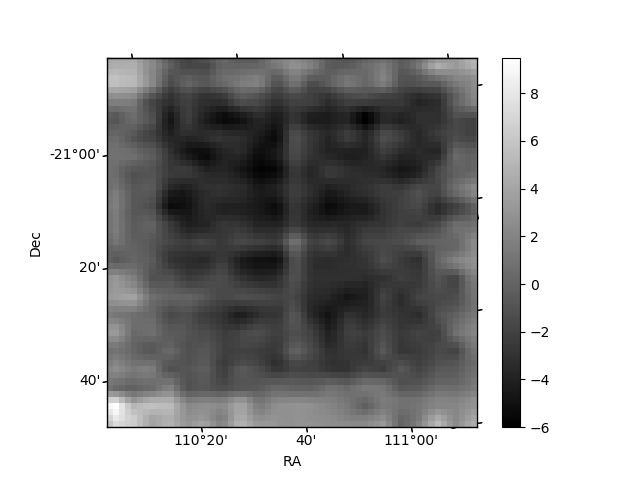
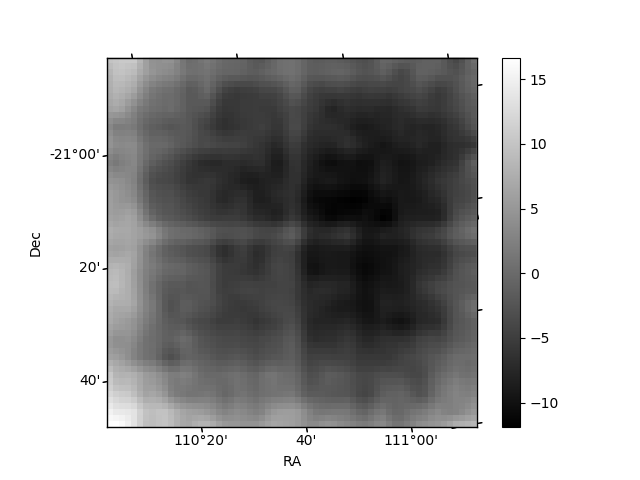
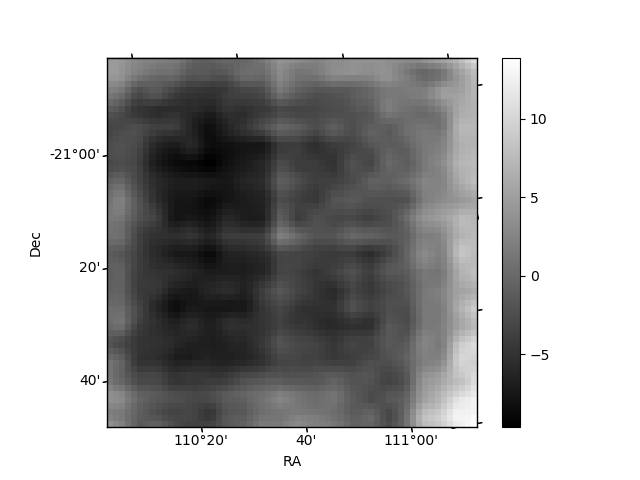
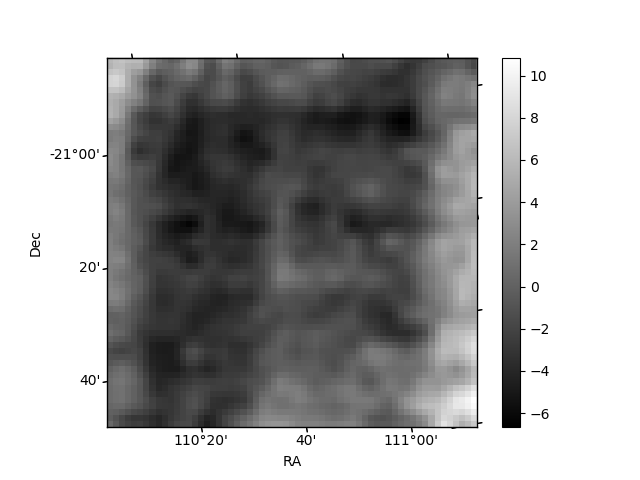
Histogram calculated using DETX and DETY for each event in the final _common_clean file
| Quadrant A | 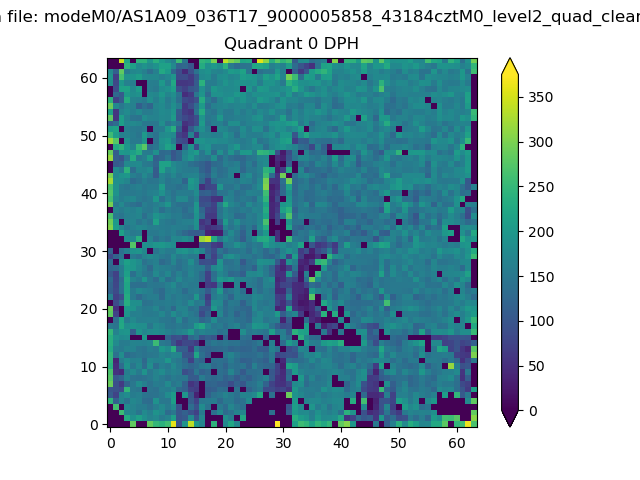 |
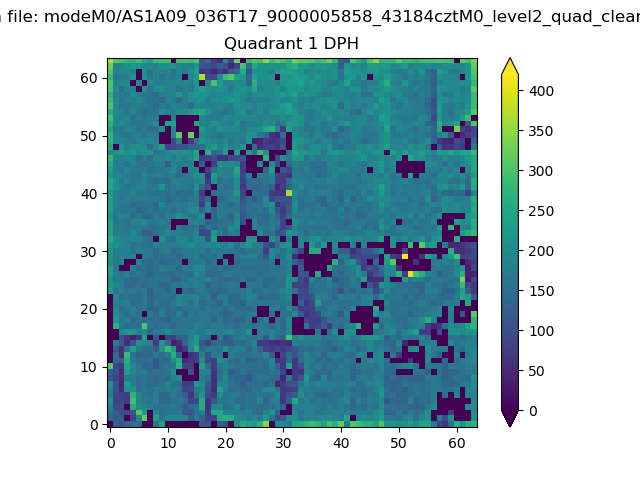 |
Quadrant B |
|---|---|---|---|
| Quadrant D | 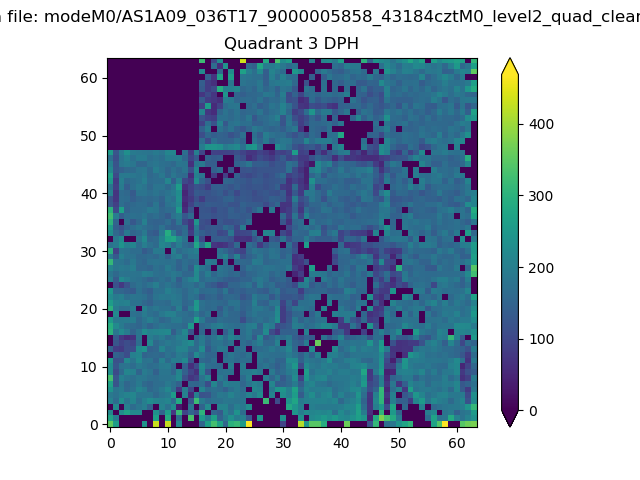 |
 |
Quadrant C |
| Plot type | Count rate plots | Images |
|---|---|---|
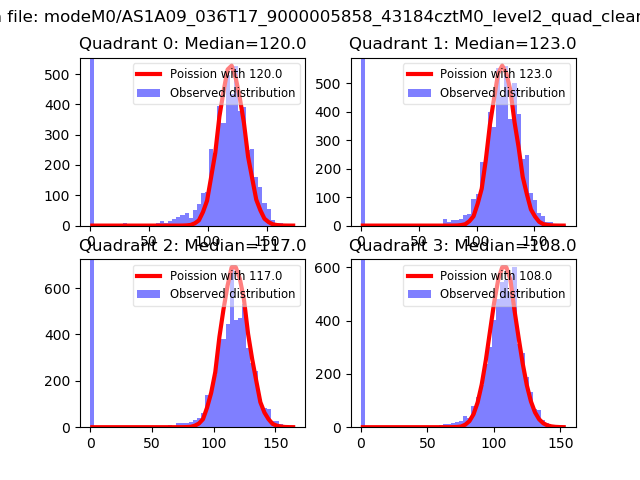
| Comparison with Poisson distribution Blue bars denote a histogram of data divided into 1 sec bins. Red curve is a Poisson curve with rate = median count rate of data. |
 |
 |
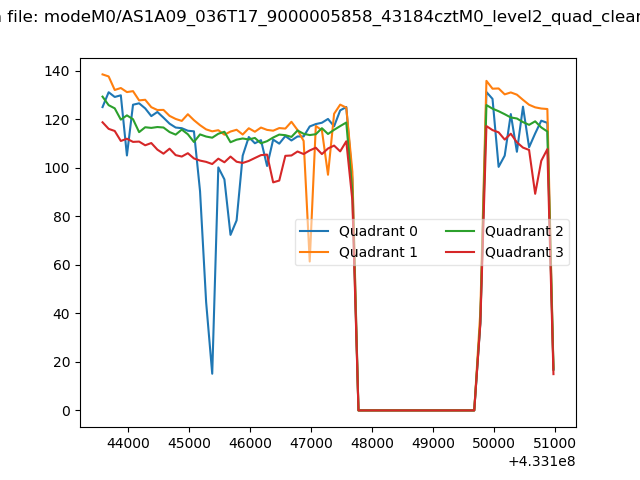
| Quadrant-wise count rates Data is divided into 100 sec bins |
 |
|
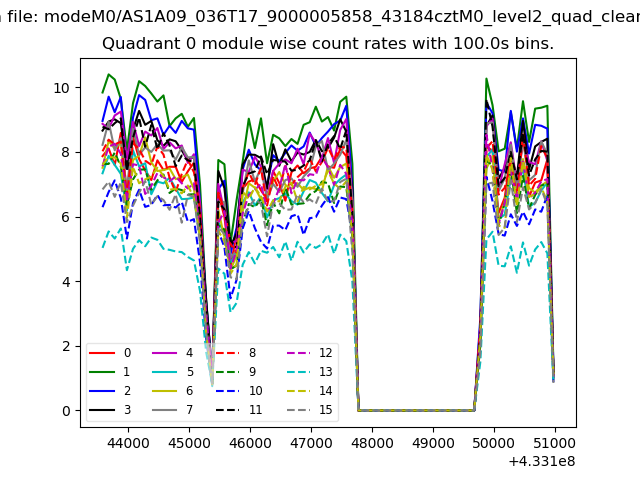
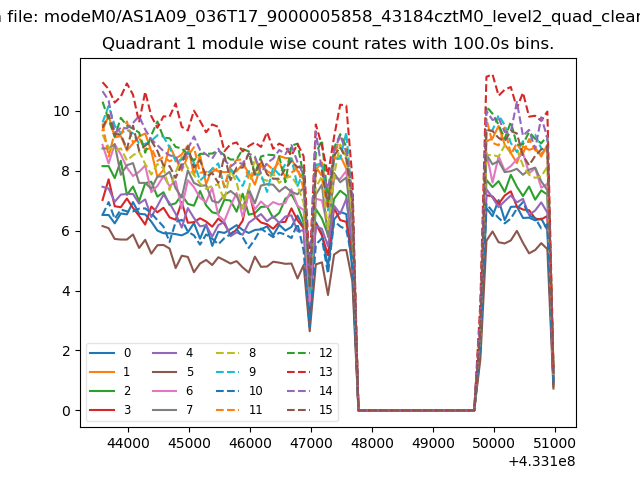
| Module-wise count rates for Quadrant A Data is divided into 100 sec bins |
 |
 |
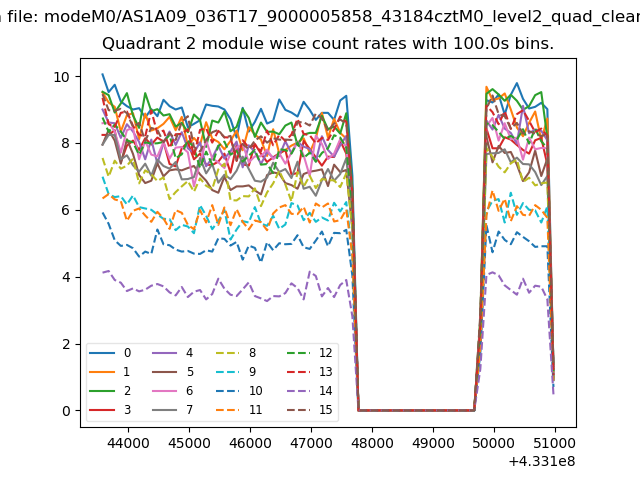
| Module-wise count rates for Quadrant B Data is divided into 100 sec bins |
 |
 |
| Module-wise count rates for Quadrant C Data is divided into 100 sec bins |
 |
 |
| Module-wise count rates for Quadrant D Data is divided into 100 sec bins |
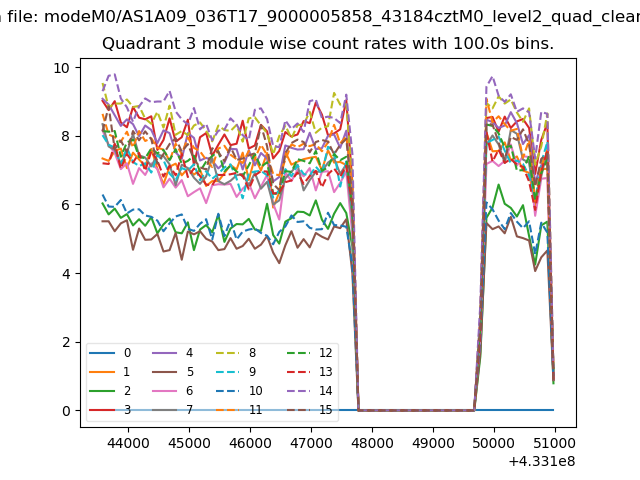 |
 |
| Parameter | Plot |
|---|---|
| CZT HV Monitor | 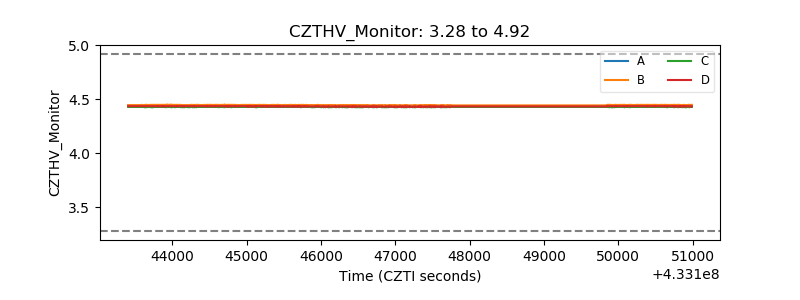 |
| D_VDD | 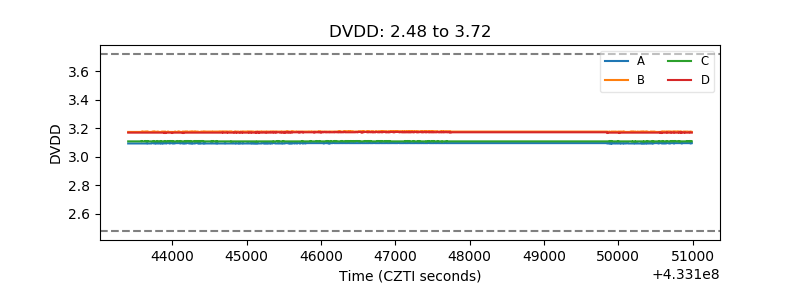 |
| Temperature 1 | 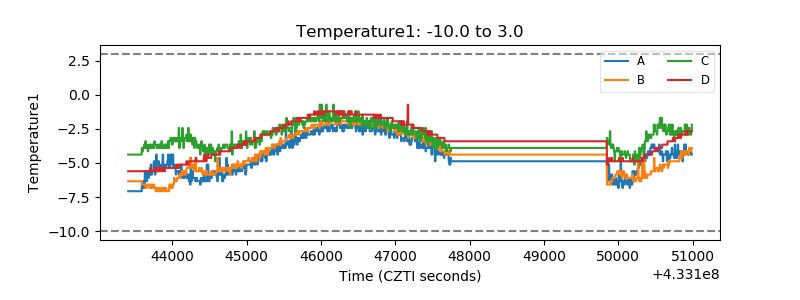 |
| Veto HV Monitor | 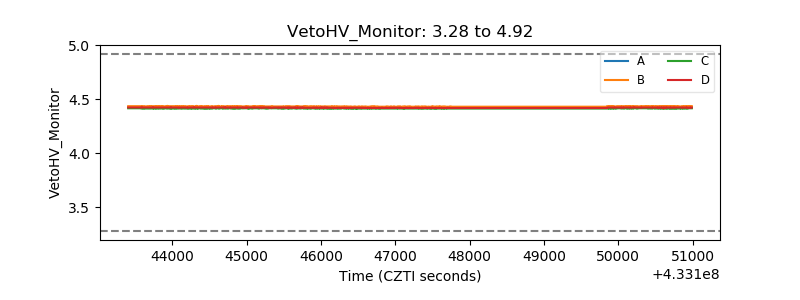 |
| Veto LLD | 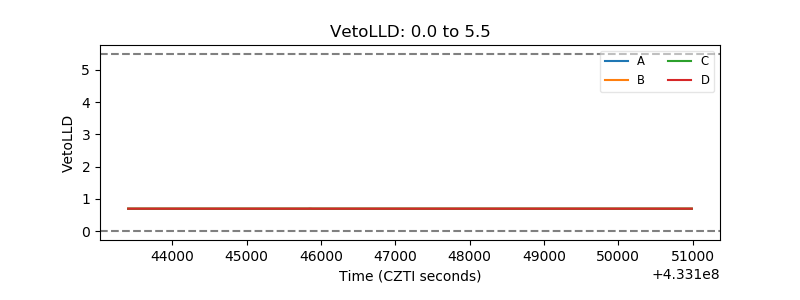 |
| Alpha Counter | 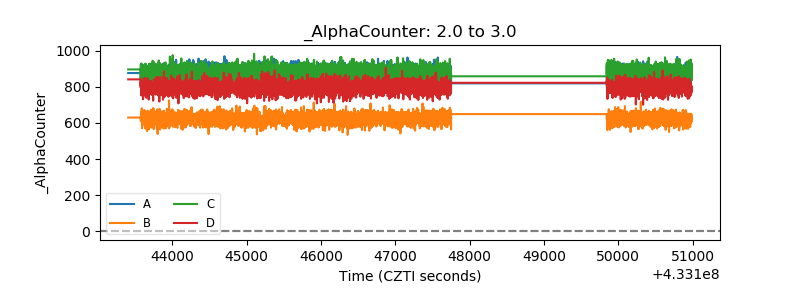 |
| _CPM_Rate | 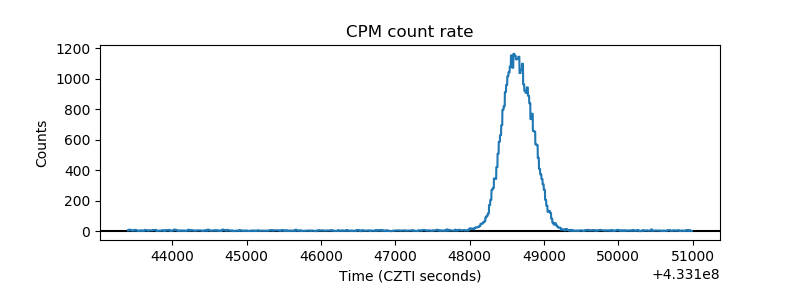 |
| CZT Counter | 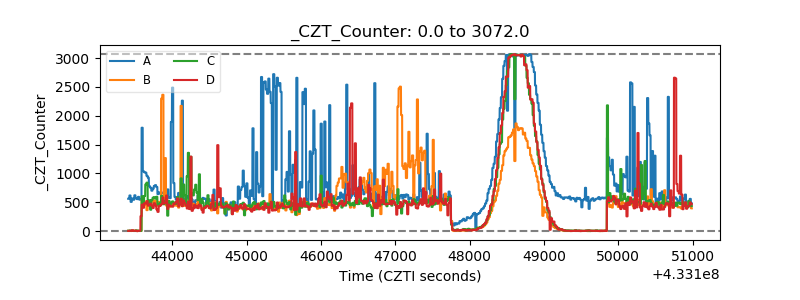 |
| +2.5 Volts monitor |  |
| +5 Volts monitor | 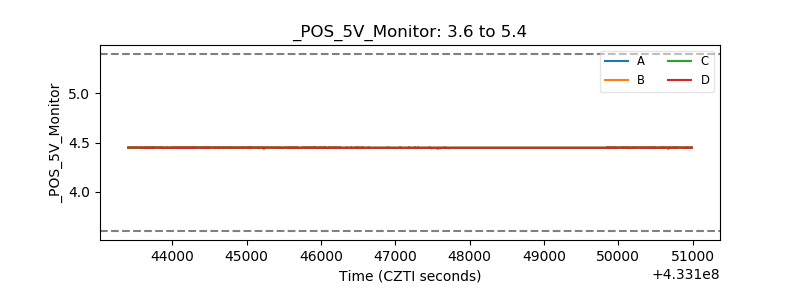 |
| _ROLL_ROT | 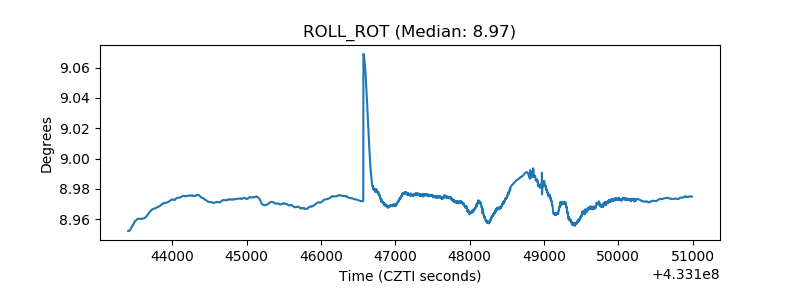 |
| _Roll_DEC | 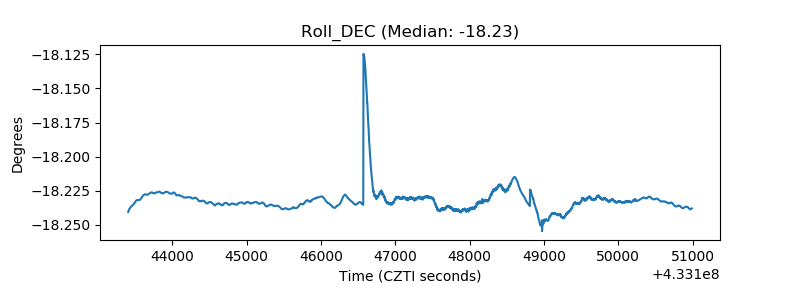 |
| _Roll_RA | 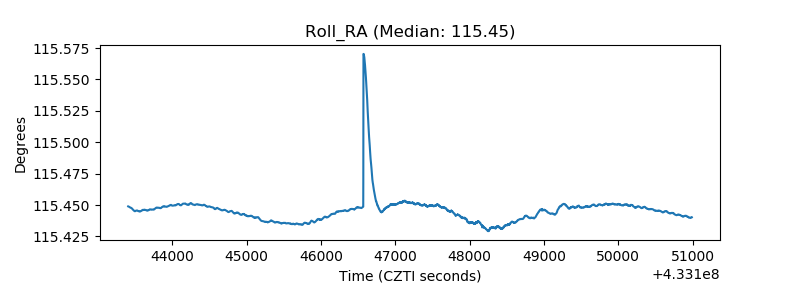 |
| Veto Counter |  |