| Param | Original file | Final file |
|---|---|---|
| Filename | modeM0/AS1A09_036T17_9000005858_43194cztM0_level2.fits | modeM0/AS1A09_036T17_9000005858_43194cztM0_level2_quad_clean.evt |
| Size (bytes) | 356,152,320 | 89,017,920 |
| Size | 339.7 MB | 84.9 MB |
| Events in quadrant A | 3,684,446 | 590,051 |
| Events in quadrant B | 3,043,048 | 608,719 |
| Events in quadrant C | 2,858,441 | 579,660 |
| Events in quadrant D | 3,171,745 | 533,960 |
| Mode M0 | |||
|---|---|---|---|
| Quadrant | BADHDUFLAG | Total packets | Discarded packets |
| A | 0 | 14502 | 2 |
| B | 0 | 12873 | 3 |
| C | 0 | 11949 | 2 |
| D | 0 | 13251 | 2 |
| Mode SS | |||
|---|---|---|---|
| Quadrant | BADHDUFLAG | Total packets | Discarded packets |
| A | 0 | 112 | 0 |
| B | 0 | 112 | 0 |
| C | 0 | 112 | 0 |
| D | 0 | 112 | 0 |
| Mode M9 | |||
|---|---|---|---|
| Quadrant | BADHDUFLAG | Total packets | Discarded packets |
| A | 0 | 30 | 0 |
| B | 0 | 31 | 0 |
| C | 0 | 31 | 0 |
| D | 0 | 31 | 0 |
| Quadrant | Total seconds | Saturated seconds | Saturation percentage |
|---|---|---|---|
| A | 5470 | 160 | 2.925046% |
| B | 5469 | 130 | 2.377034% |
| C | 5469 | 75 | 1.371366% |
| D | 5469 | 129 | 2.358749% |
Noise dominated data is calculated using 1-second bins in cleaned event files. If a bin has >2000 counts, and if more than 50% of those come from <1% of pixels, then it is considered to be noise-dominated and hence unusable.
| Quadrant | # 1 sec bins | Bins with >0 counts | Bins with >2000 counts | High rate bins dominated by noise | Noise dominated (total time) | Noise dominated (detector-on time) | Marked lightcurve |
|---|---|---|---|---|---|---|---|
| A | 7112 | 5471 | 129 | 129 | 1.81% | 2.36% | 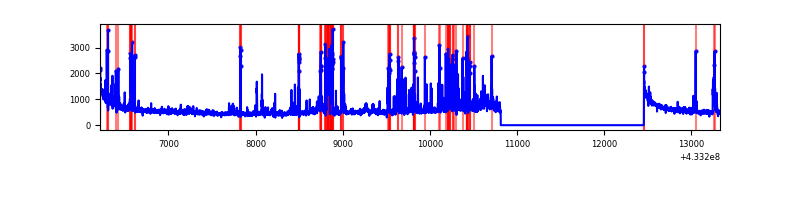 |
| B | 7111 | 5470 | 107 | 107 | 1.50% | 1.96% | 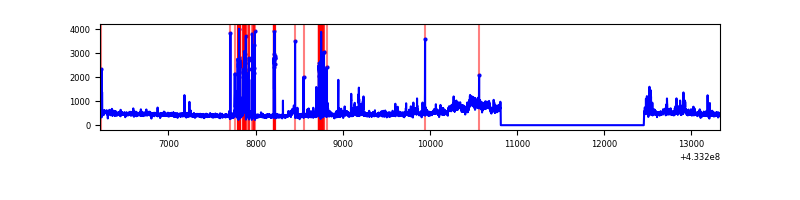 |
| C | 7111 | 5470 | 67 | 67 | 0.94% | 1.22% | 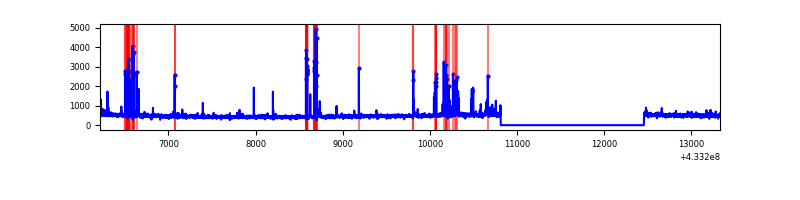 |
| D | 7111 | 5470 | 134 | 134 | 1.88% | 2.45% | 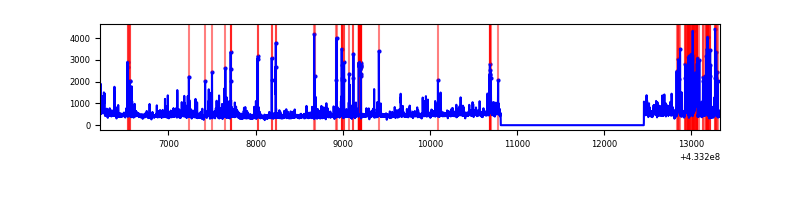 |
Top three noisy pixels from each quadrant. If the there are fewer than three noisy pixels in the level2.evt file, extra rows are filled as -1
| Pixel properties | Quadrant properties | ||||||
|---|---|---|---|---|---|---|---|
| Quadrant | DetID | PixID | Counts | Sigma | Mean | Median | Sigma |
| A | 10 | 83 | 570608 | 4601.6 | 593 | 581 | 123.9 |
| A | 15 | 237 | 568439 | 4584.09 | 593 | 581 | 123.9 |
| A | 12 | 189 | 113643 | 912.7 | 593 | 581 | 123.9 |
| B | 0 | 229 | 332969 | 2873.04 | 592 | 575 | 115.7 |
| B | 0 | 186 | 125028 | 1075.71 | 592 | 575 | 115.7 |
| B | 0 | 189 | 112915 | 971.01 | 592 | 575 | 115.7 |
| C | 15 | 159 | 282239 | 2020.76 | 585 | 590 | 139.4 |
| C | 15 | 214 | 225217 | 1611.64 | 585 | 590 | 139.4 |
| C | 14 | 254 | 51595 | 365.95 | 585 | 590 | 139.4 |
| D | 1 | 52 | 458385 | 3199.9 | 582 | 565 | 143.1 |
| D | 12 | 218 | 149717 | 1042.49 | 582 | 565 | 143.1 |
| D | 13 | 249 | 113872 | 791.95 | 582 | 565 | 143.1 |
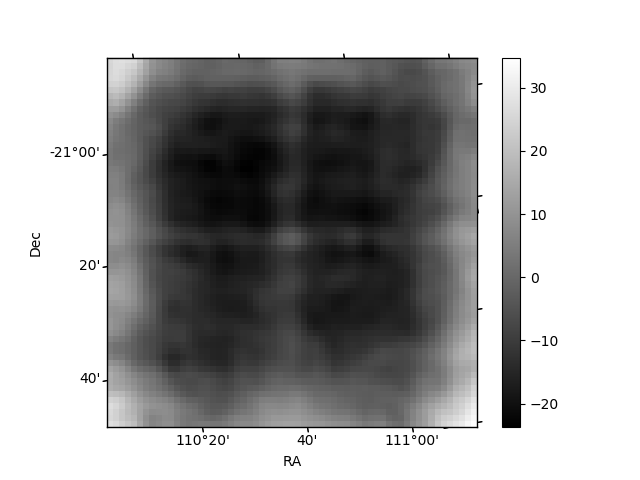
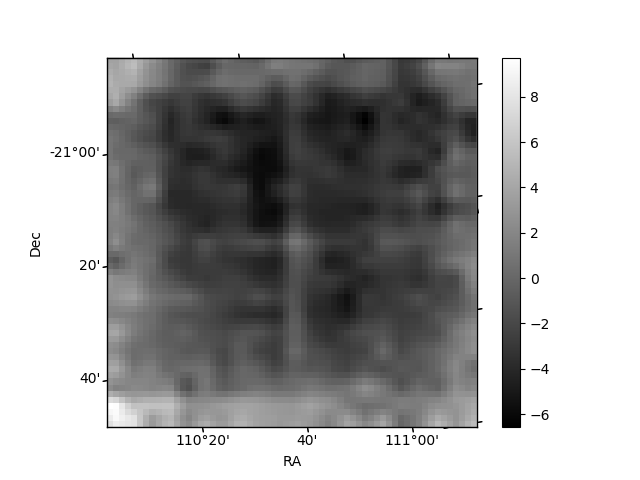
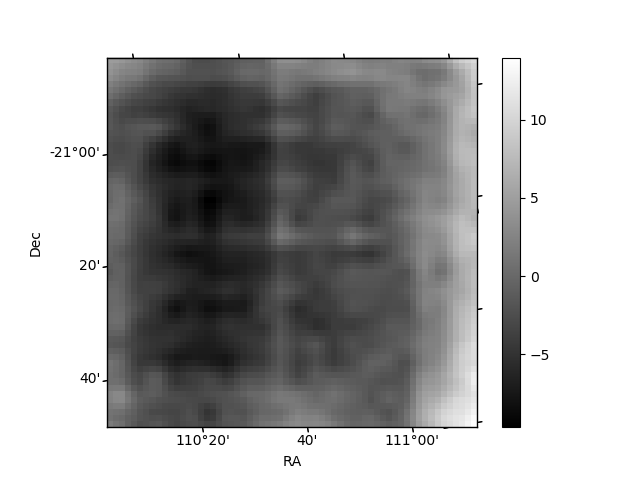
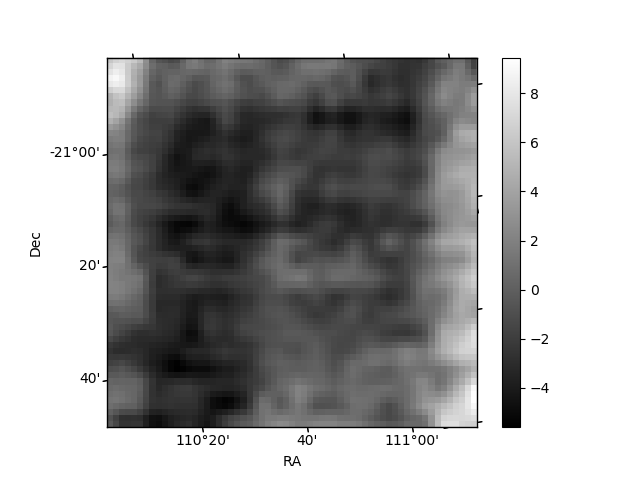
Histogram calculated using DETX and DETY for each event in the final _common_clean file
| Quadrant A | 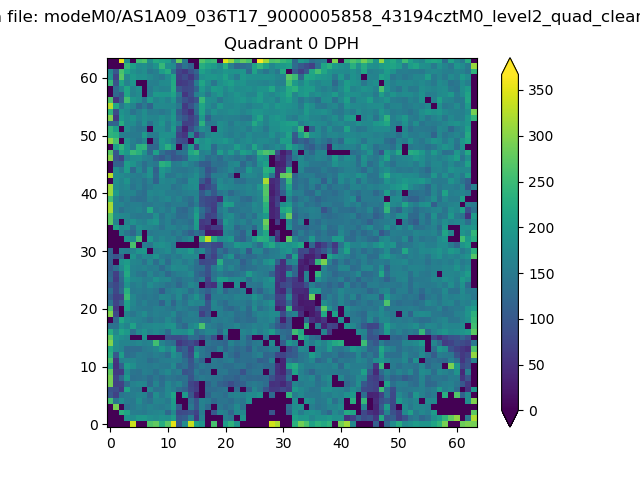 |
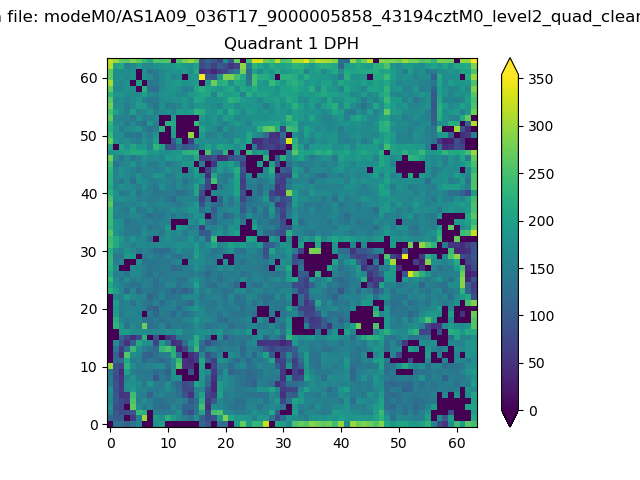 |
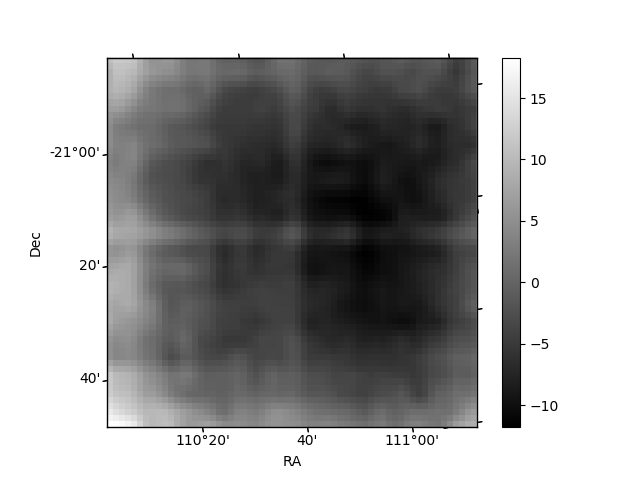
Quadrant B |
|---|---|---|---|
| Quadrant D | 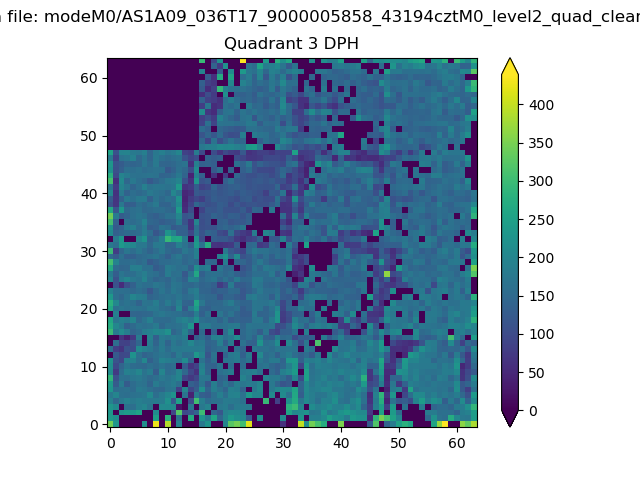 |
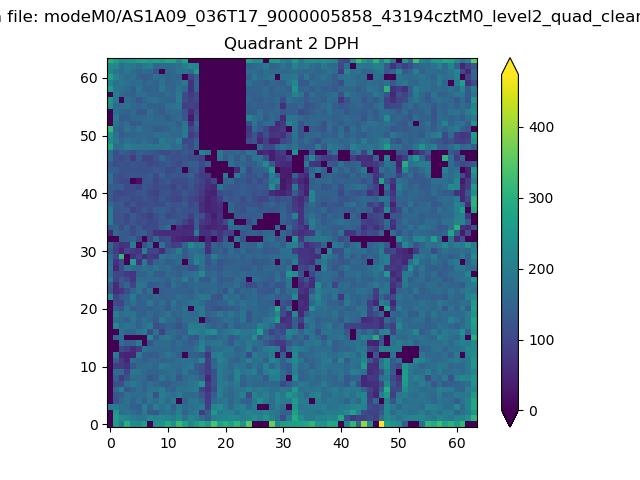 |
Quadrant C |
| Plot type | Count rate plots | Images |
|---|---|---|
| Comparison with Poisson distribution Blue bars denote a histogram of data divided into 1 sec bins. Red curve is a Poisson curve with rate = median count rate of data. |
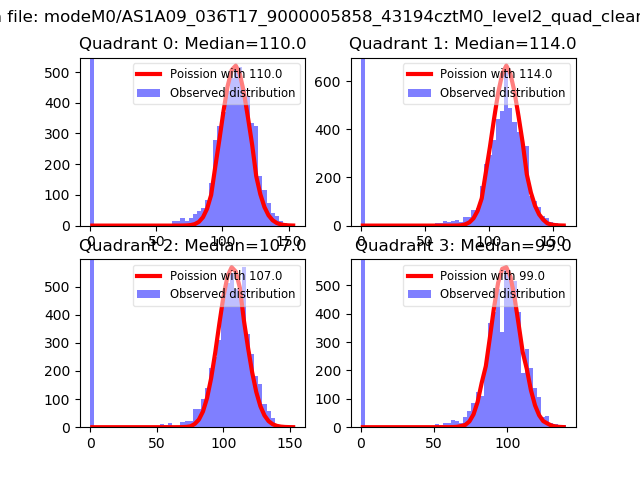 |
 |
| Quadrant-wise count rates Data is divided into 100 sec bins |
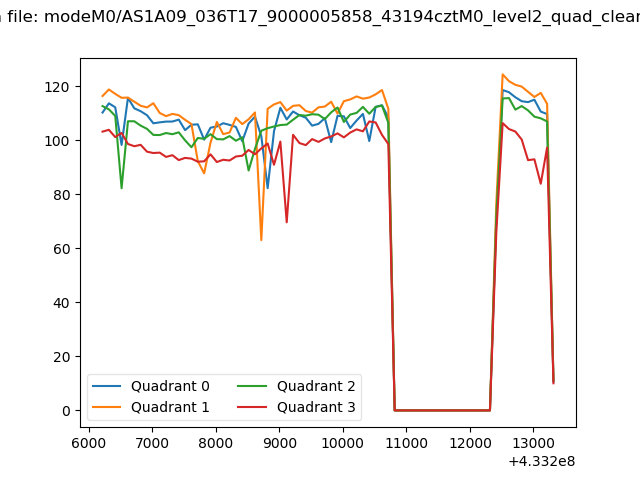 |
|
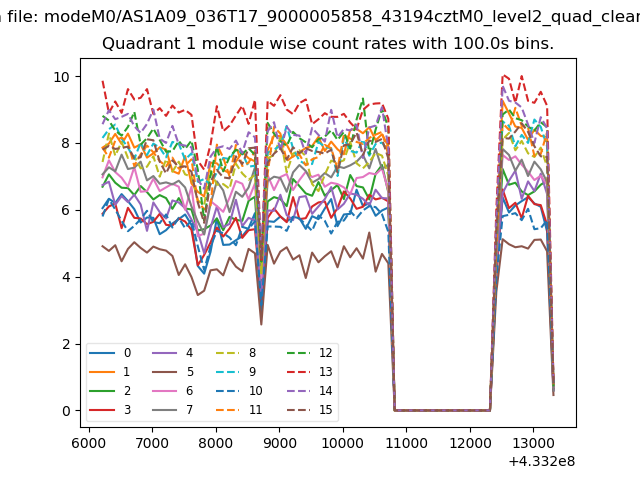
| Module-wise count rates for Quadrant A Data is divided into 100 sec bins |
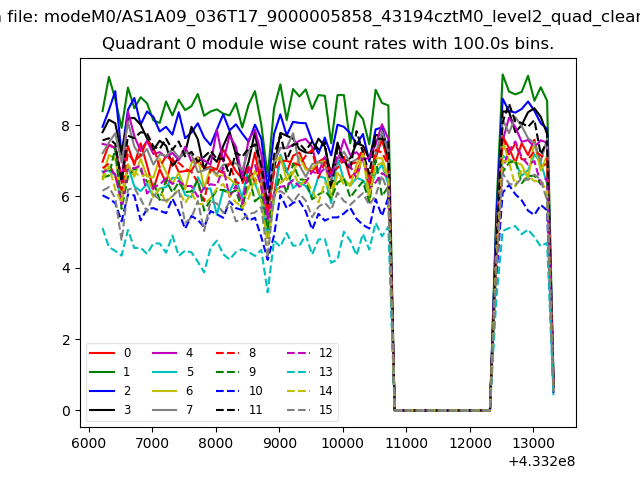 |
 |
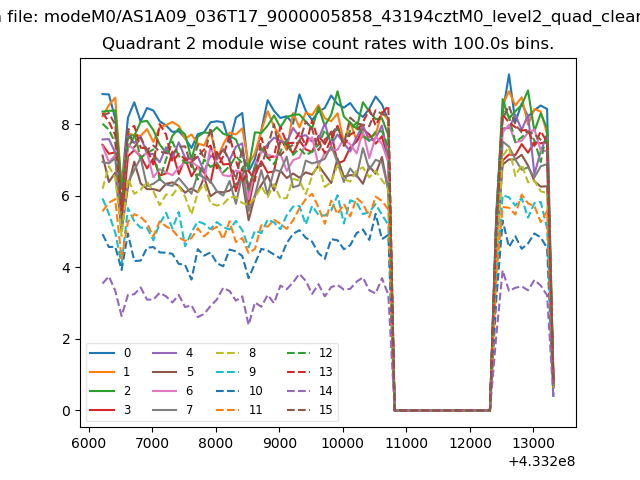
| Module-wise count rates for Quadrant B Data is divided into 100 sec bins |
 |
 |
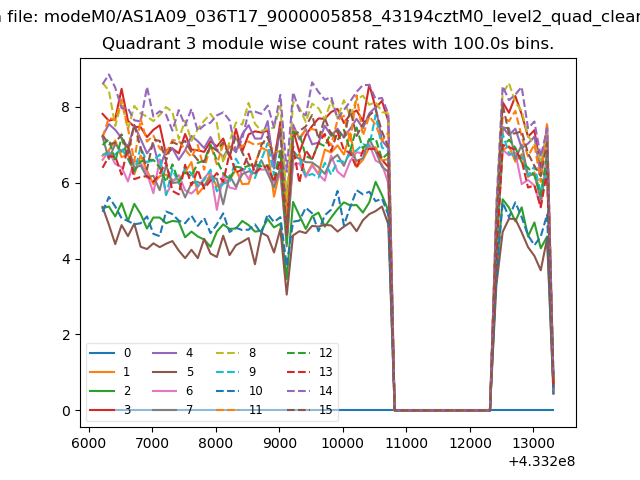
| Module-wise count rates for Quadrant C Data is divided into 100 sec bins |
 |
 |
| Module-wise count rates for Quadrant D Data is divided into 100 sec bins |
 |
 |
| Parameter | Plot |
|---|---|
| CZT HV Monitor | 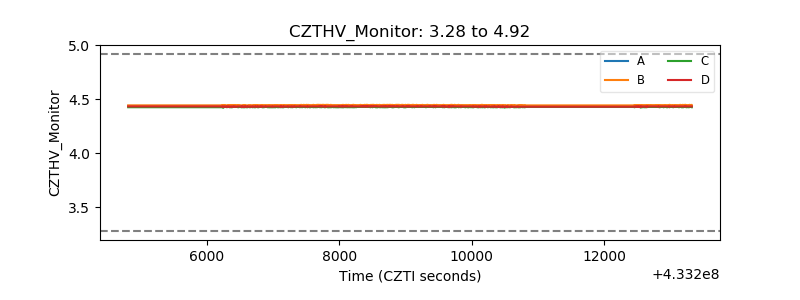 |
| D_VDD | 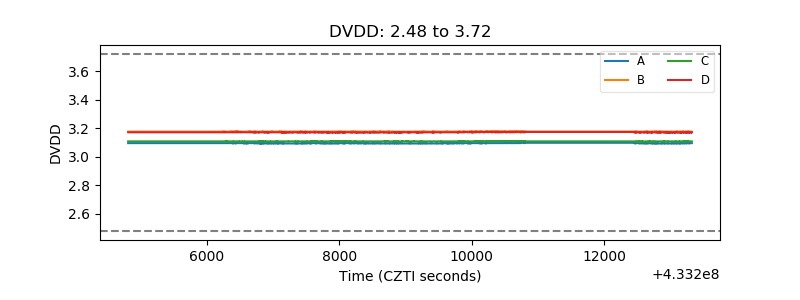 |
| Temperature 1 | 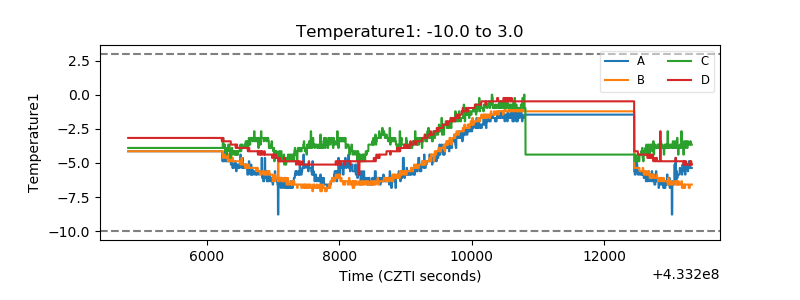 |
| Veto HV Monitor | 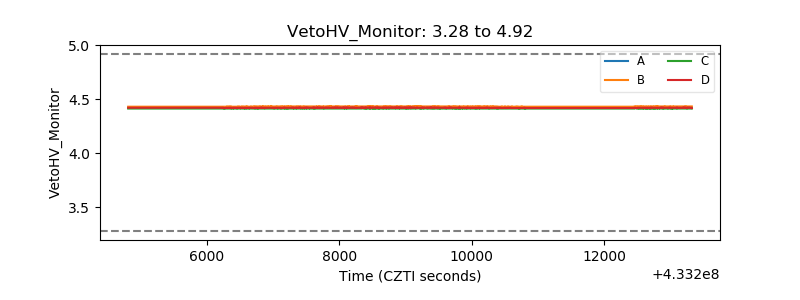 |
| Veto LLD | 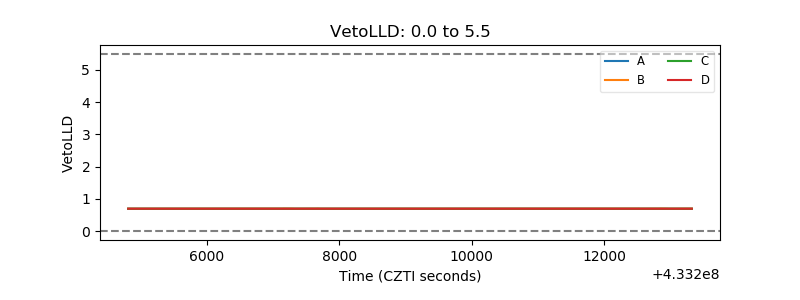 |
| Alpha Counter | 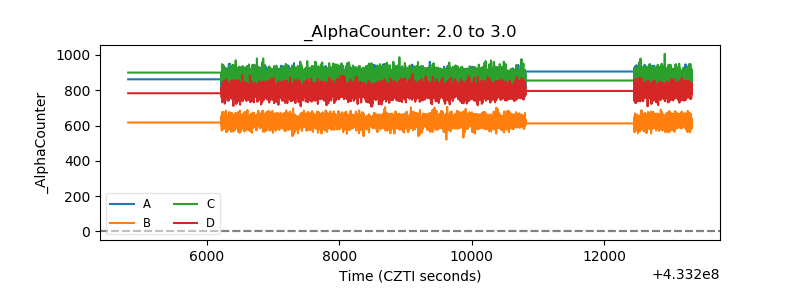 |
| _CPM_Rate |  |
| CZT Counter | 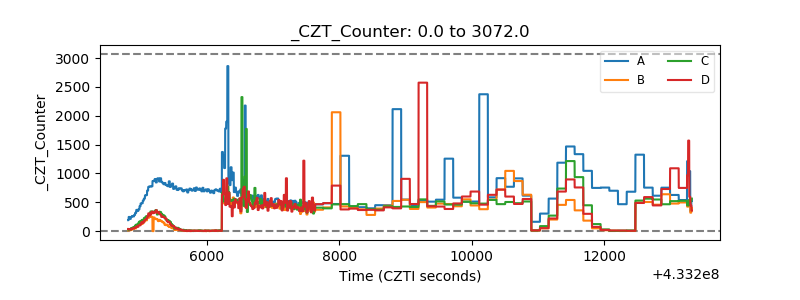 |
| +2.5 Volts monitor | 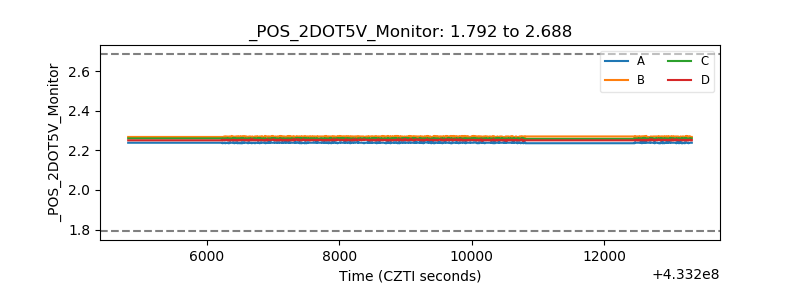 |
| +5 Volts monitor | 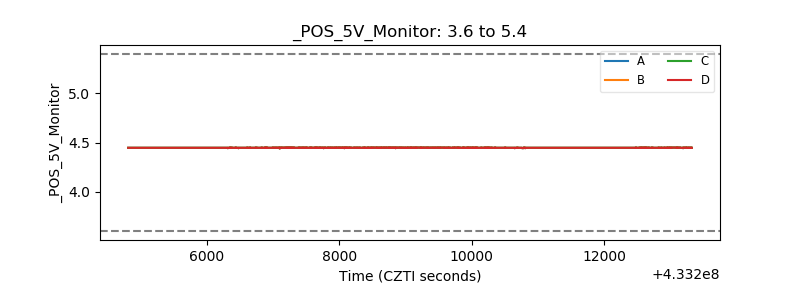 |
| _ROLL_ROT | 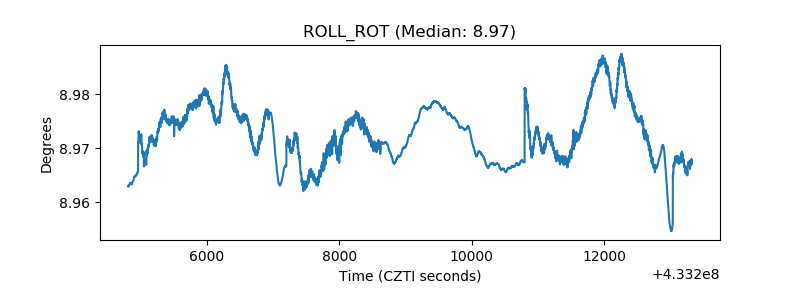 |
| _Roll_DEC | 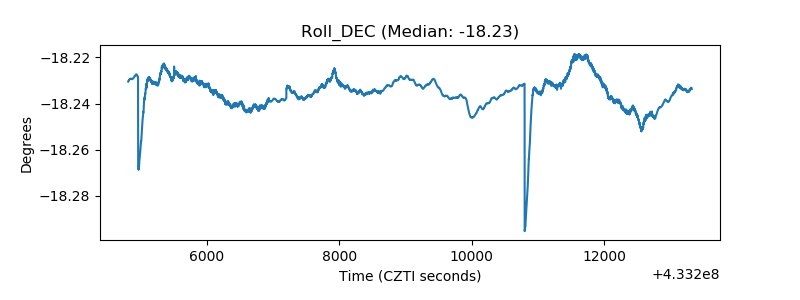 |
| _Roll_RA | 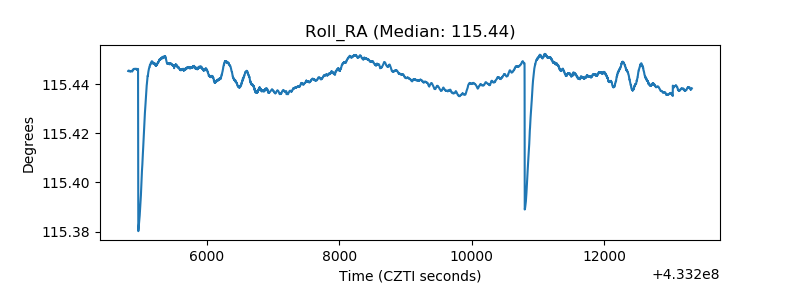 |
| Veto Counter | 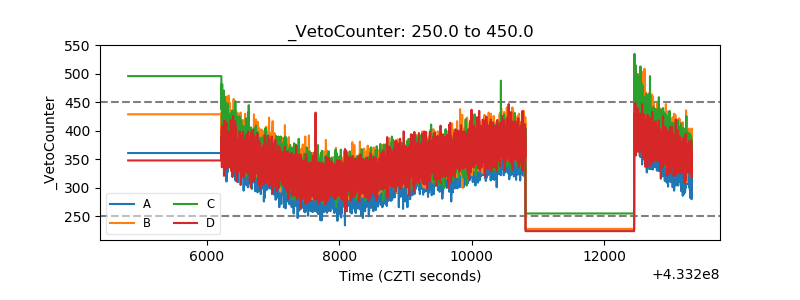 |