| Param | Original file | Final file |
|---|---|---|
| Filename | modeM0/AS1A09_036T17_9000005858_43196cztM0_level2.fits | modeM0/AS1A09_036T17_9000005858_43196cztM0_level2_quad_clean.evt |
| Size (bytes) | 348,981,120 | 88,381,440 |
| Size | 332.8 MB | 84.3 MB |
| Events in quadrant A | 3,282,454 | 588,027 |
| Events in quadrant B | 2,719,875 | 611,948 |
| Events in quadrant C | 2,679,684 | 581,538 |
| Events in quadrant D | 3,823,254 | 523,347 |
| Mode M0 | |||
|---|---|---|---|
| Quadrant | BADHDUFLAG | Total packets | Discarded packets |
| A | 0 | 13174 | 2 |
| B | 0 | 11785 | 2 |
| C | 0 | 11179 | 2 |
| D | 0 | 14991 | 2 |
| Mode SS | |||
|---|---|---|---|
| Quadrant | BADHDUFLAG | Total packets | Discarded packets |
| A | 0 | 108 | 0 |
| B | 0 | 108 | 0 |
| C | 0 | 108 | 0 |
| D | 0 | 108 | 0 |
| Mode M9 | |||
|---|---|---|---|
| Quadrant | BADHDUFLAG | Total packets | Discarded packets |
| A | 0 | 31 | 0 |
| B | 0 | 32 | 0 |
| C | 0 | 32 | 0 |
| D | 0 | 32 | 0 |
| Quadrant | Total seconds | Saturated seconds | Saturation percentage |
|---|---|---|---|
| A | 5302 | 91 | 1.716333% |
| B | 5302 | 41 | 0.773293% |
| C | 5302 | 10 | 0.188608% |
| D | 5302 | 191 | 3.602414% |
Noise dominated data is calculated using 1-second bins in cleaned event files. If a bin has >2000 counts, and if more than 50% of those come from <1% of pixels, then it is considered to be noise-dominated and hence unusable.
| Quadrant | # 1 sec bins | Bins with >0 counts | Bins with >2000 counts | High rate bins dominated by noise | Noise dominated (total time) | Noise dominated (detector-on time) | Marked lightcurve |
|---|---|---|---|---|---|---|---|
| A | 7094 | 5303 | 64 | 64 | 0.90% | 1.21% | 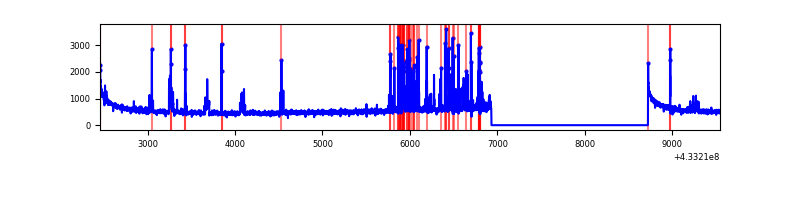 |
| B | 7094 | 5303 | 15 | 15 | 0.21% | 0.28% | 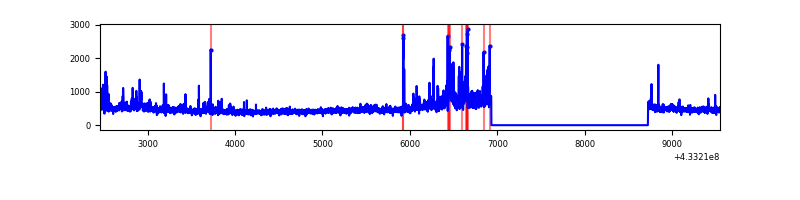 |
| C | 7094 | 5303 | 13 | 13 | 0.18% | 0.25% | 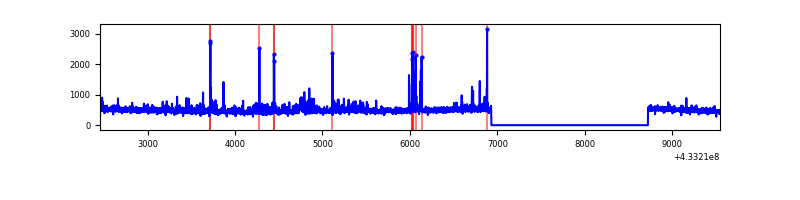 |
| D | 7094 | 5303 | 207 | 207 | 2.92% | 3.90% | 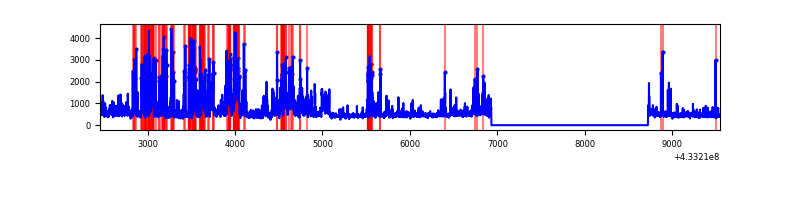 |
Top three noisy pixels from each quadrant. If the there are fewer than three noisy pixels in the level2.evt file, extra rows are filled as -1
| Pixel properties | Quadrant properties | ||||||
|---|---|---|---|---|---|---|---|
| Quadrant | DetID | PixID | Counts | Sigma | Mean | Median | Sigma |
| A | 10 | 83 | 576004 | 4777.39 | 582 | 569 | 120.4 |
| A | 15 | 237 | 295331 | 2447.18 | 582 | 569 | 120.4 |
| A | 13 | 248 | 111899 | 924.29 | 582 | 569 | 120.4 |
| B | 0 | 186 | 186790 | 1624.89 | 584 | 567 | 114.6 |
| B | 0 | 189 | 115714 | 1004.72 | 584 | 567 | 114.6 |
| B | 5 | 255 | 43535 | 374.92 | 584 | 567 | 114.6 |
| C | 15 | 214 | 220150 | 1625.58 | 576 | 581 | 135.1 |
| C | 0 | 239 | 95069 | 699.54 | 576 | 581 | 135.1 |
| C | 14 | 254 | 62817 | 460.76 | 576 | 581 | 135.1 |
| D | 12 | 218 | 774035 | 5531.61 | 566 | 550 | 139.8 |
| D | 1 | 52 | 466893 | 3335.07 | 566 | 550 | 139.8 |
| D | 13 | 249 | 283164 | 2021.13 | 566 | 550 | 139.8 |
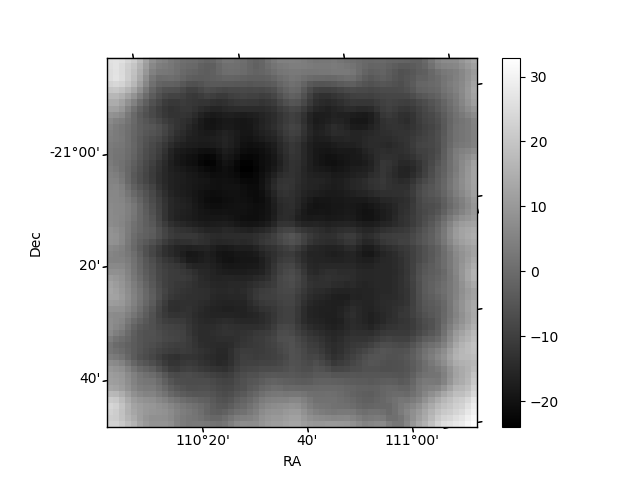
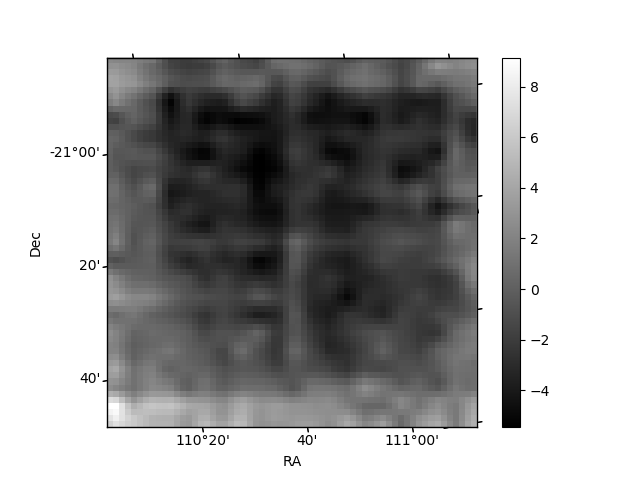
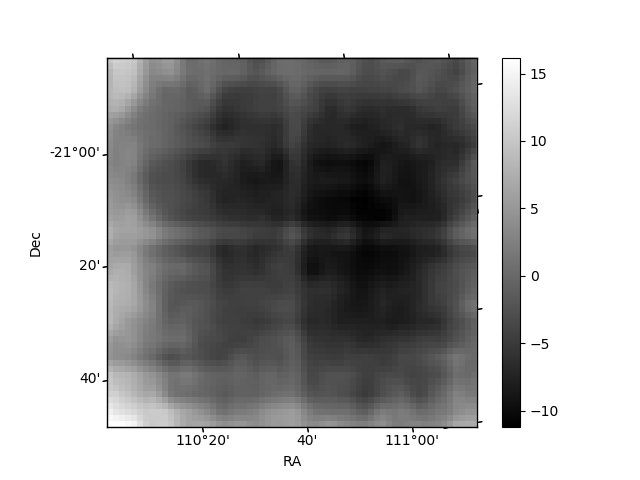
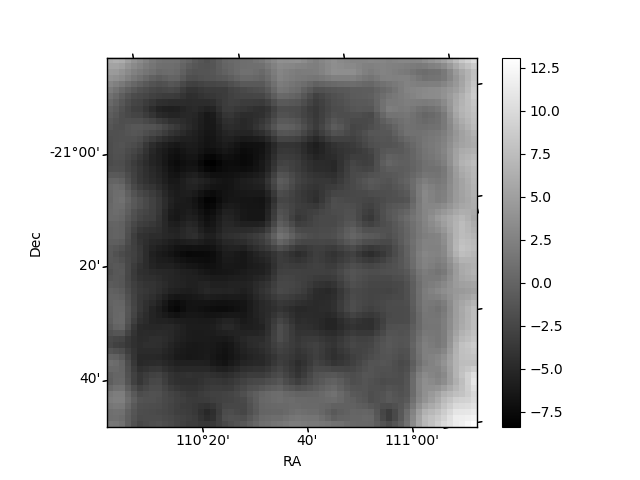
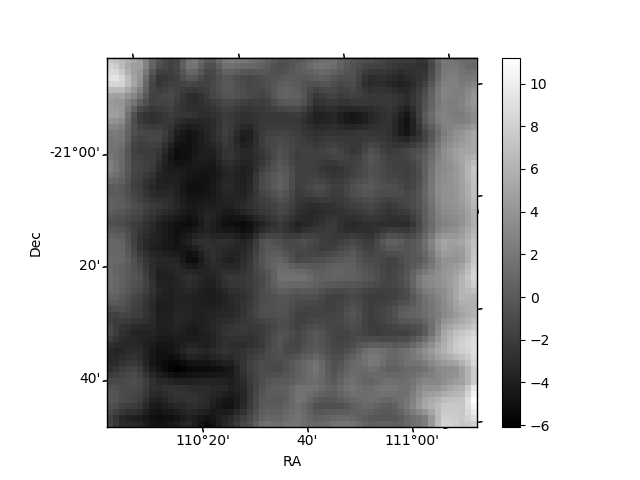
Histogram calculated using DETX and DETY for each event in the final _common_clean file
| Quadrant A | 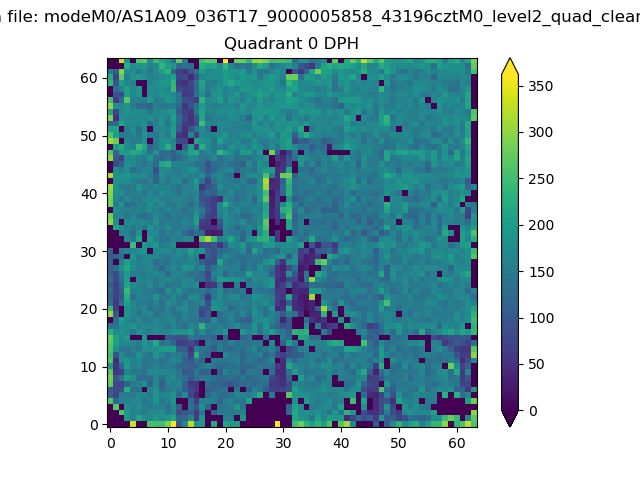 |
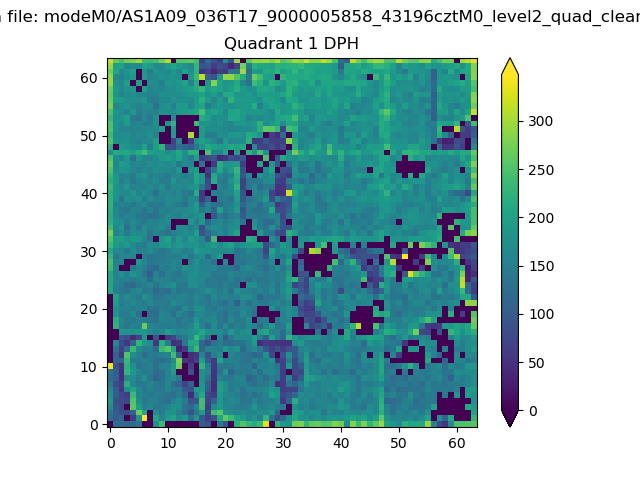 |
Quadrant B |
|---|---|---|---|
| Quadrant D | 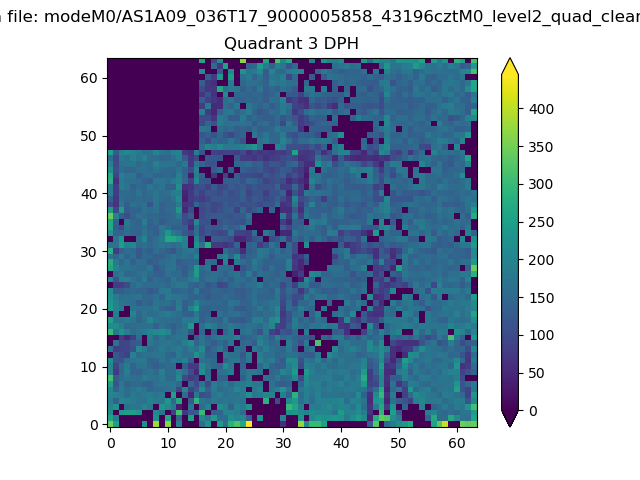 |
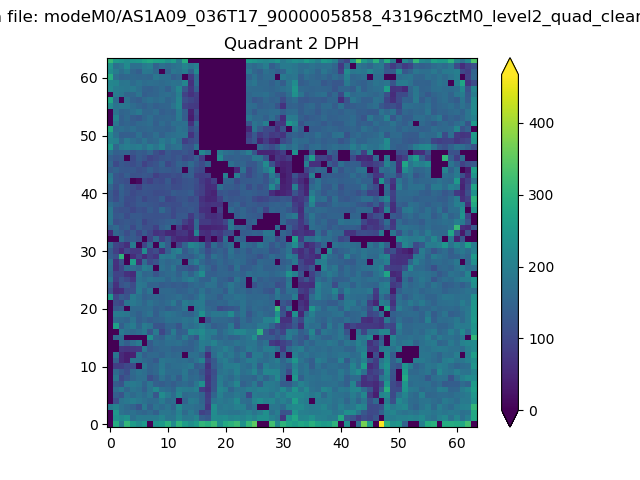 |
Quadrant C |
| Plot type | Count rate plots | Images |
|---|---|---|
| Comparison with Poisson distribution Blue bars denote a histogram of data divided into 1 sec bins. Red curve is a Poisson curve with rate = median count rate of data. |
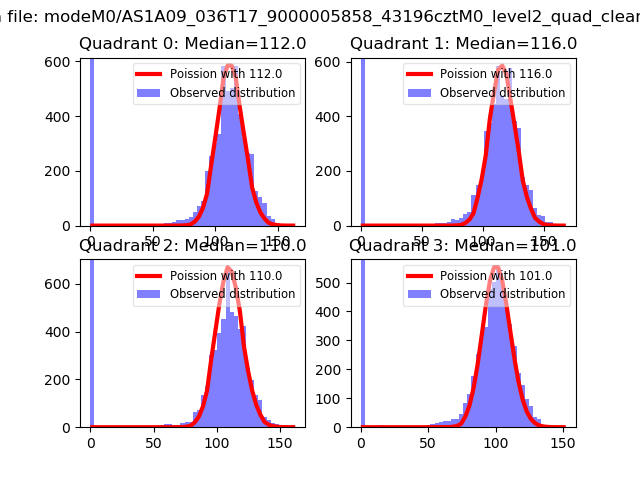 |
 |
| Quadrant-wise count rates Data is divided into 100 sec bins |
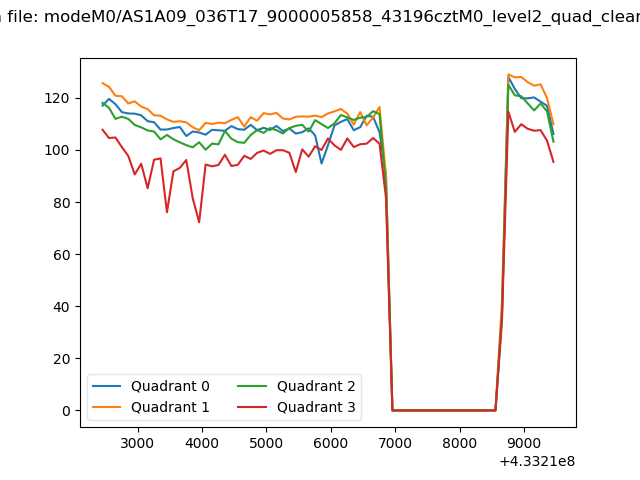 |
|
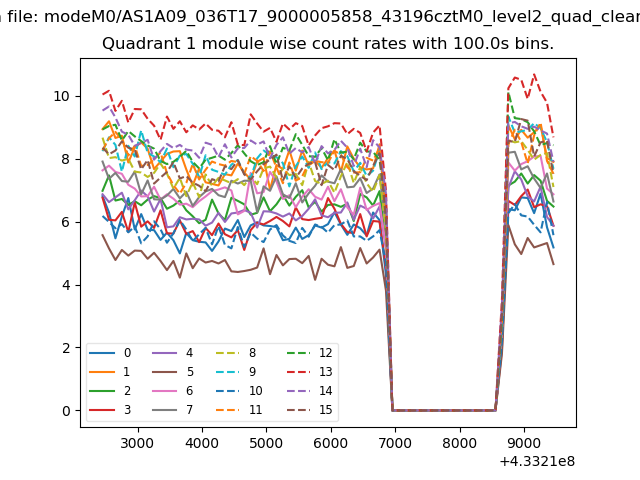
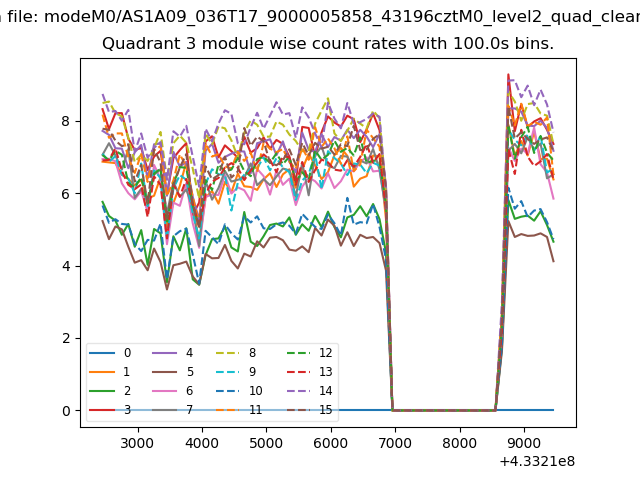
| Module-wise count rates for Quadrant A Data is divided into 100 sec bins |
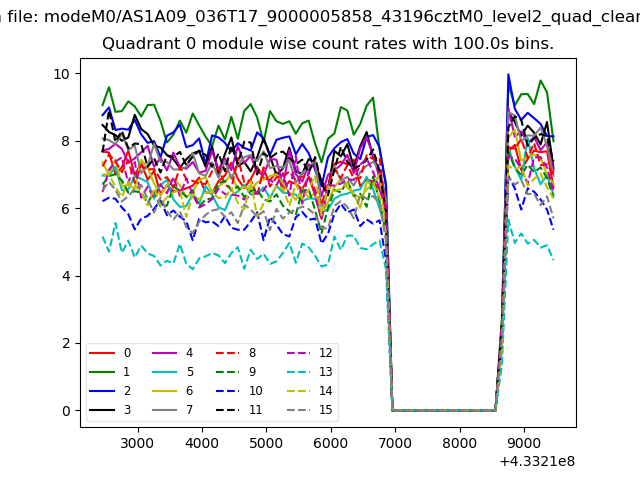 |
 |
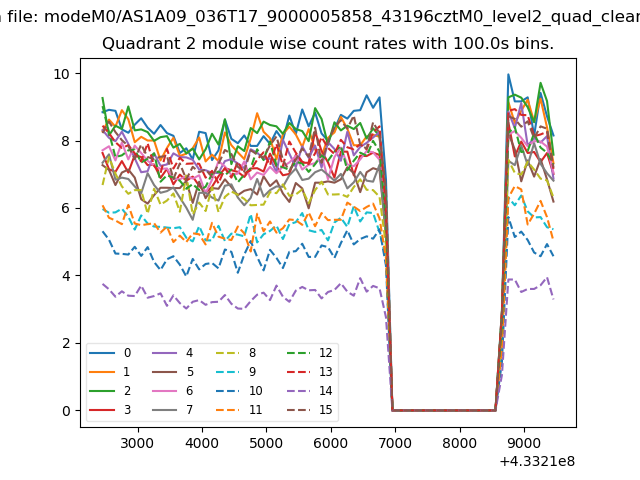
| Module-wise count rates for Quadrant B Data is divided into 100 sec bins |
 |
 |
| Module-wise count rates for Quadrant C Data is divided into 100 sec bins |
 |
 |
| Module-wise count rates for Quadrant D Data is divided into 100 sec bins |
 |
 |
| Parameter | Plot |
|---|---|
| CZT HV Monitor | 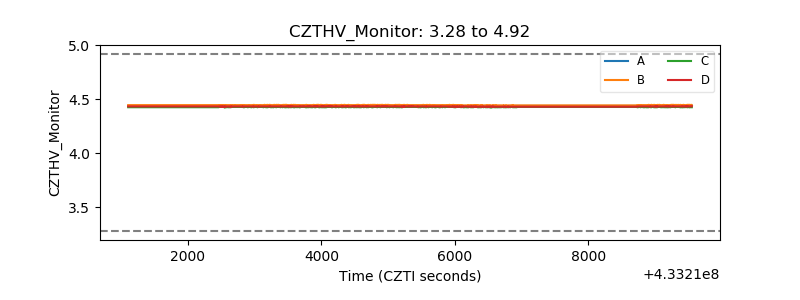 |
| D_VDD | 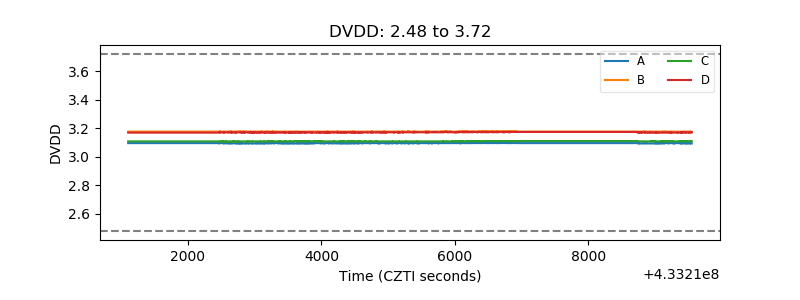 |
| Temperature 1 | 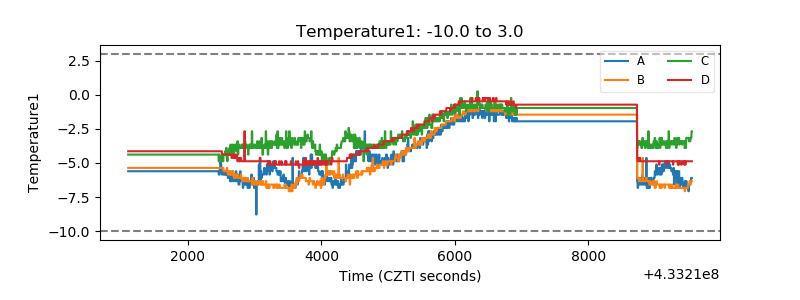 |
| Veto HV Monitor |  |
| Veto LLD | 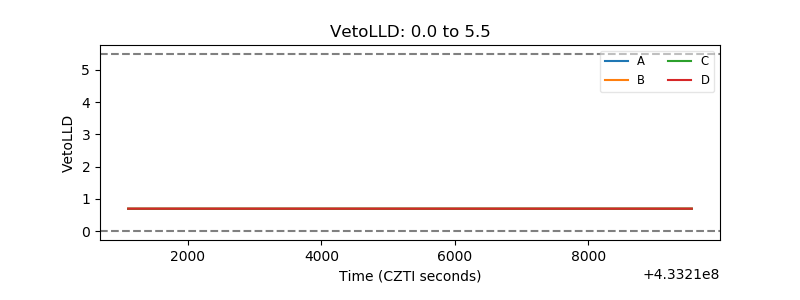 |
| Alpha Counter | 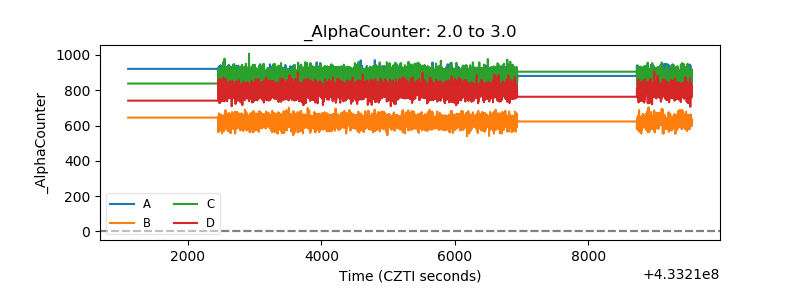 |
| _CPM_Rate | 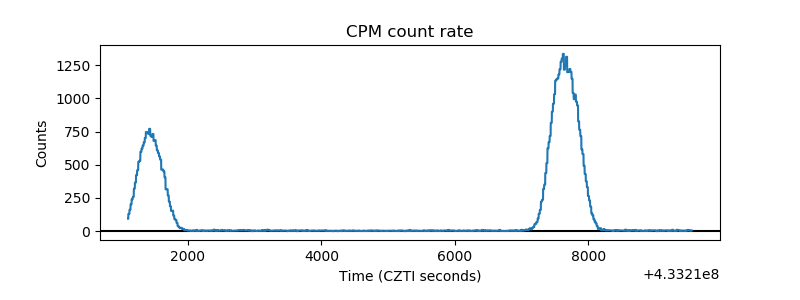 |
| CZT Counter | 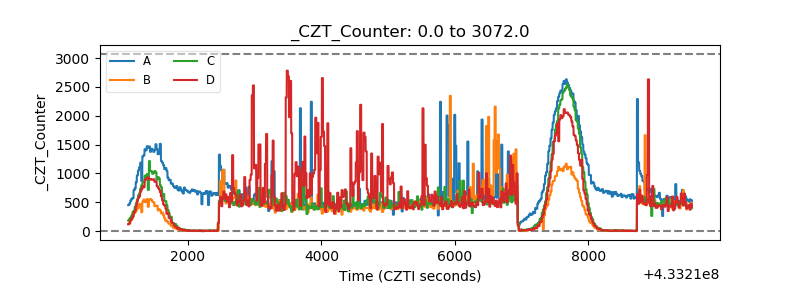 |
| +2.5 Volts monitor | 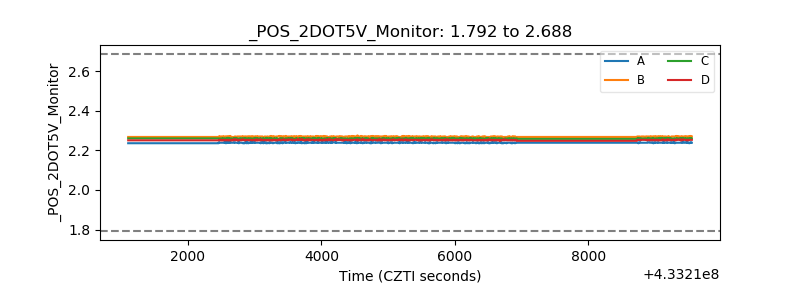 |
| +5 Volts monitor | 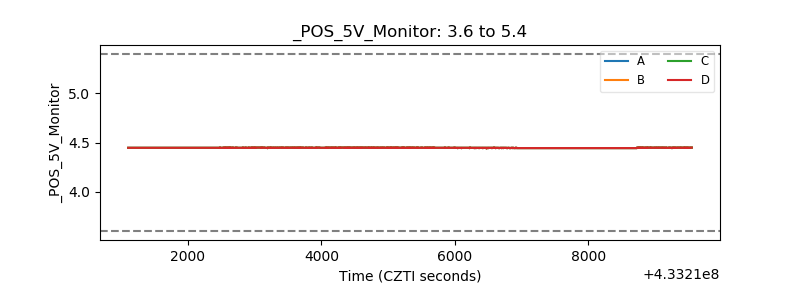 |
| _ROLL_ROT | 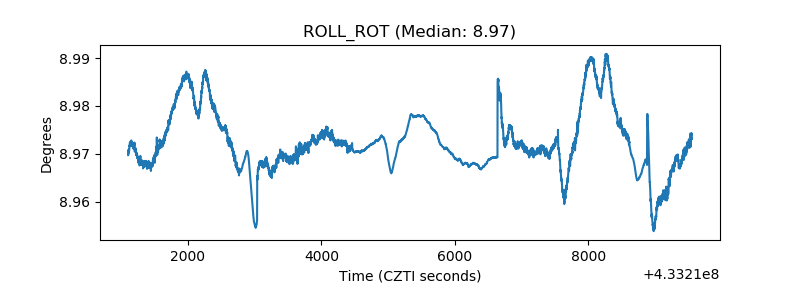 |
| _Roll_DEC | 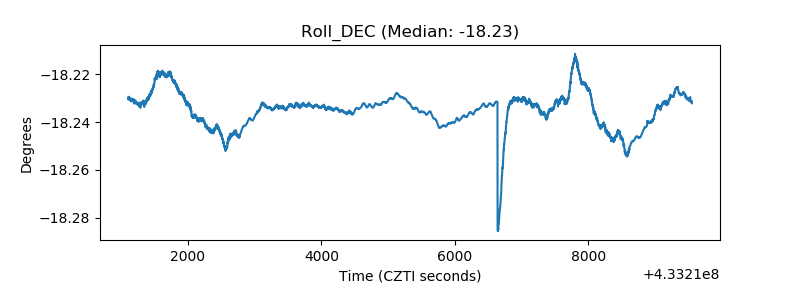 |
| _Roll_RA | 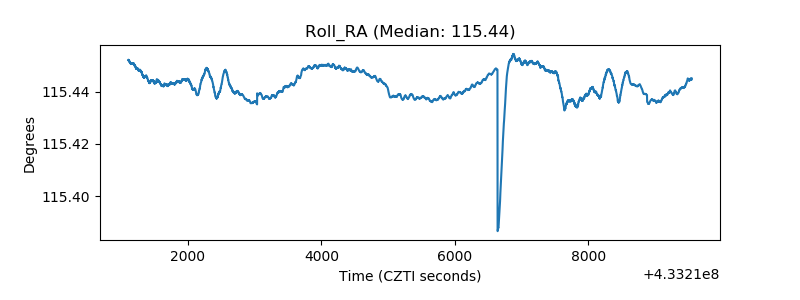 |
| Veto Counter | 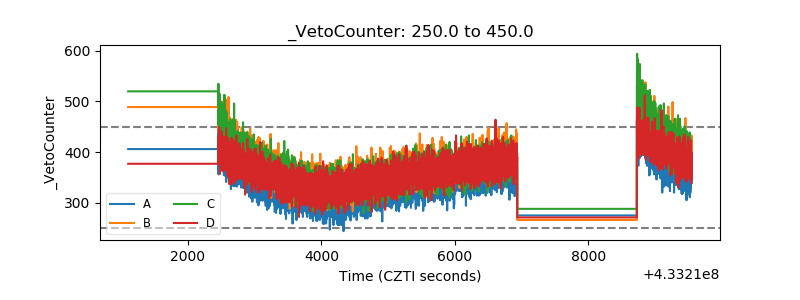 |