| Param | Original file | Final file |
|---|---|---|
| Filename | modeM0/AS1A09_036T17_9000005858_43198cztM0_level2.fits | modeM0/AS1A09_036T17_9000005858_43198cztM0_level2_quad_clean.evt |
| Size (bytes) | 418,847,040 | 87,868,800 |
| Size | 399.4 MB | 83.8 MB |
| Events in quadrant A | 3,347,213 | 625,576 |
| Events in quadrant B | 6,263,447 | 464,582 |
| Events in quadrant C | 2,803,415 | 622,948 |
| Events in quadrant D | 2,673,914 | 573,679 |
| Mode M0 | |||
|---|---|---|---|
| Quadrant | BADHDUFLAG | Total packets | Discarded packets |
| A | 0 | 13267 | 1 |
| B | 0 | 22255 | 1 |
| C | 0 | 11518 | 1 |
| D | 0 | 11620 | 1 |
| Mode SS | |||
|---|---|---|---|
| Quadrant | BADHDUFLAG | Total packets | Discarded packets |
| A | 0 | 108 | 0 |
| B | 0 | 108 | 0 |
| C | 0 | 108 | 0 |
| D | 0 | 108 | 0 |
| Mode M9 | |||
|---|---|---|---|
| Quadrant | BADHDUFLAG | Total packets | Discarded packets |
| A | 0 | 21 | 0 |
| B | 0 | 21 | 0 |
| C | 0 | 21 | 0 |
| D | 0 | 21 | 0 |
| Quadrant | Total seconds | Saturated seconds | Saturation percentage |
|---|---|---|---|
| A | 5344 | 89 | 1.665419% |
| B | 5345 | 1708 | 31.955098% |
| C | 5345 | 23 | 0.430309% |
| D | 5345 | 19 | 0.355472% |
Noise dominated data is calculated using 1-second bins in cleaned event files. If a bin has >2000 counts, and if more than 50% of those come from <1% of pixels, then it is considered to be noise-dominated and hence unusable.
| Quadrant | # 1 sec bins | Bins with >0 counts | Bins with >2000 counts | High rate bins dominated by noise | Noise dominated (total time) | Noise dominated (detector-on time) | Marked lightcurve |
|---|---|---|---|---|---|---|---|
| A | 7406 | 5345 | 81 | 81 | 1.09% | 1.52% | 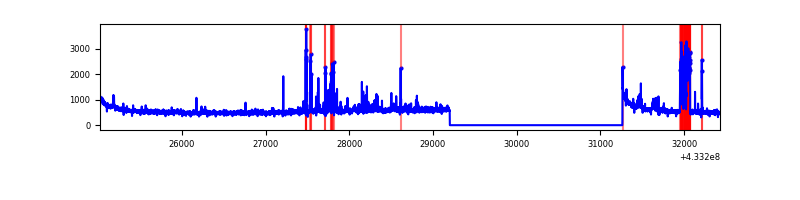 |
| B | 7407 | 5346 | 1528 | 1528 | 20.63% | 28.58% |  |
| C | 7407 | 5346 | 20 | 20 | 0.27% | 0.37% | 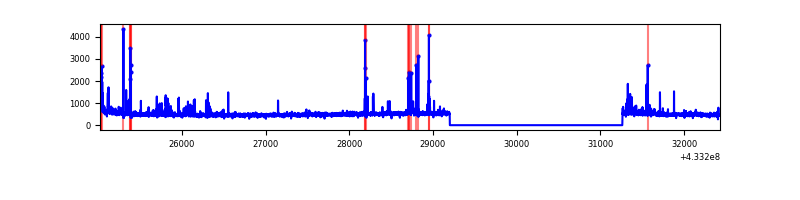 |
| D | 7407 | 5346 | 15 | 15 | 0.20% | 0.28% |  |
Top three noisy pixels from each quadrant. If the there are fewer than three noisy pixels in the level2.evt file, extra rows are filled as -1
| Pixel properties | Quadrant properties | ||||||
|---|---|---|---|---|---|---|---|
| Quadrant | DetID | PixID | Counts | Sigma | Mean | Median | Sigma |
| A | 10 | 83 | 576870 | 4676.86 | 607 | 594 | 123.2 |
| A | 15 | 237 | 286832 | 2323.01 | 607 | 594 | 123.2 |
| A | 12 | 189 | 78993 | 636.26 | 607 | 594 | 123.2 |
| B | 0 | 229 | 4096242 | 39906.34 | 538 | 525 | 102.6 |
| B | 0 | 189 | 17321 | 163.65 | 538 | 525 | 102.6 |
| B | 0 | 186 | 14196 | 133.2 | 538 | 525 | 102.6 |
| C | 15 | 214 | 223363 | 1583.7 | 601 | 606 | 140.7 |
| C | 14 | 254 | 99328 | 701.87 | 601 | 606 | 140.7 |
| C | 4 | 254 | 71894 | 506.83 | 601 | 606 | 140.7 |
| D | 1 | 52 | 194977 | 1320.32 | 600 | 584 | 147.2 |
| D | 13 | 249 | 36265 | 242.35 | 600 | 584 | 147.2 |
| D | 7 | 96 | 27940 | 185.8 | 600 | 584 | 147.2 |
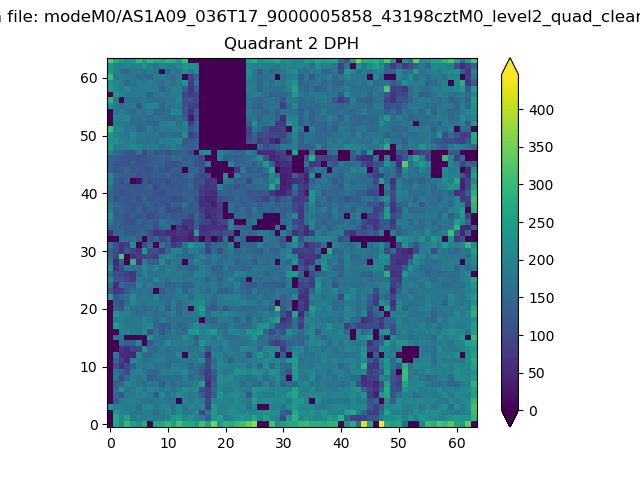
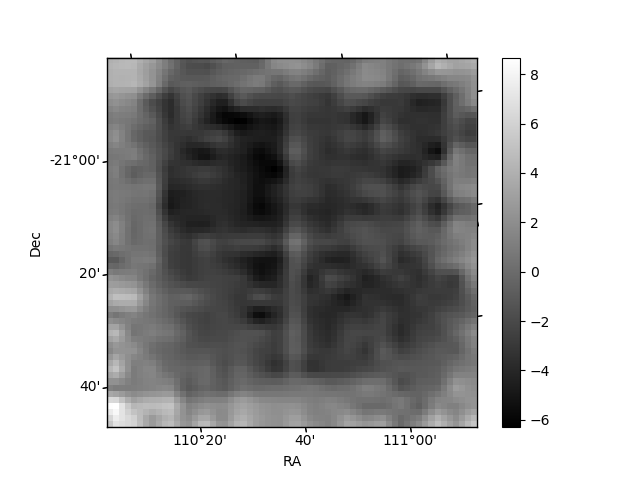
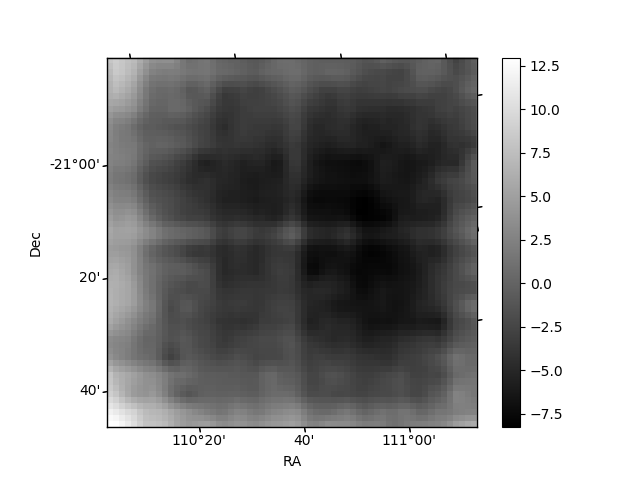
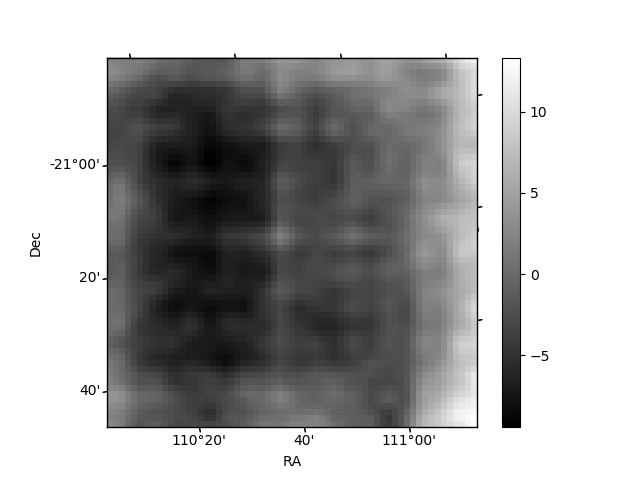
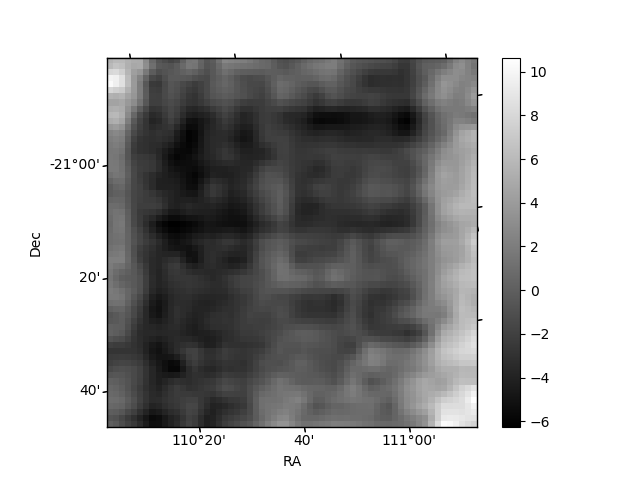
Histogram calculated using DETX and DETY for each event in the final _common_clean file
| Quadrant A | 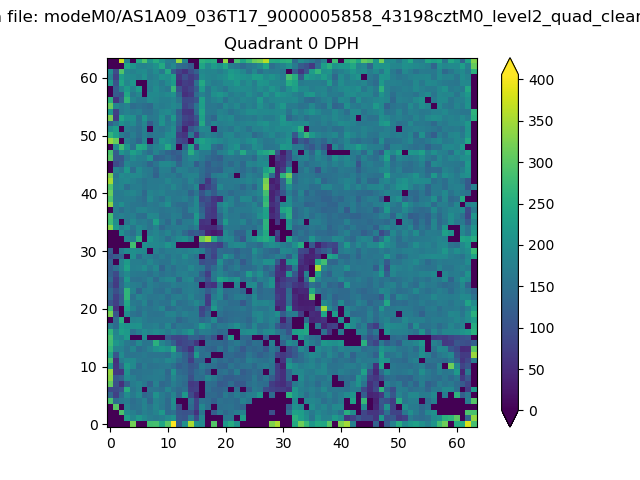 |
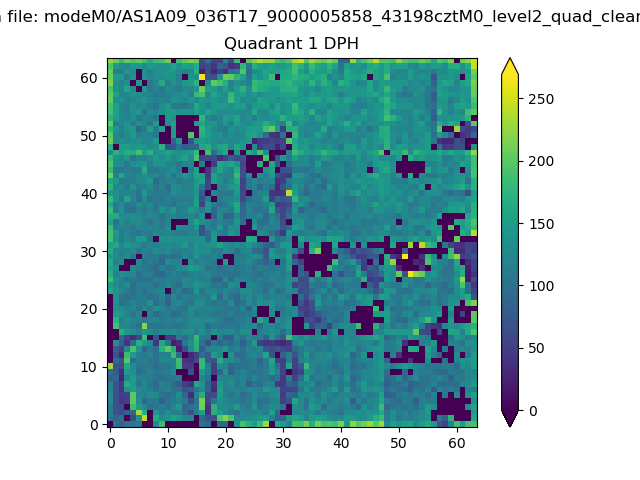 |
Quadrant B |
|---|---|---|---|
| Quadrant D | 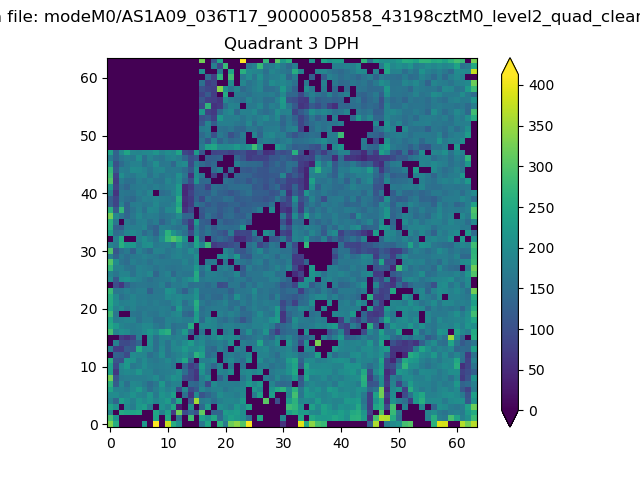 |
 |
Quadrant C |
| Plot type | Count rate plots | Images |
|---|---|---|
| Comparison with Poisson distribution Blue bars denote a histogram of data divided into 1 sec bins. Red curve is a Poisson curve with rate = median count rate of data. |
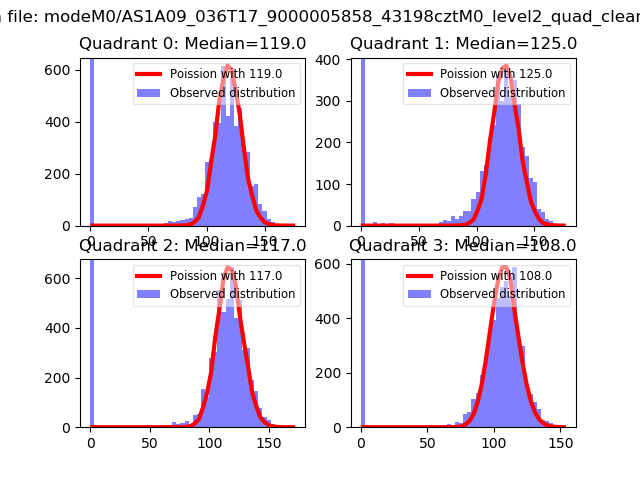 |
 |
| Quadrant-wise count rates Data is divided into 100 sec bins |
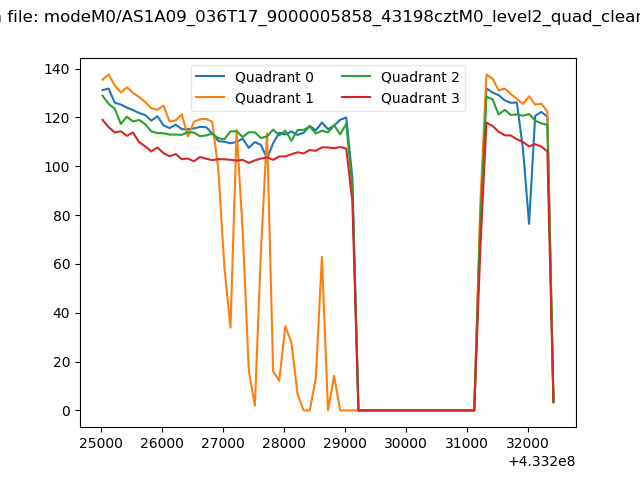 |
|
| Module-wise count rates for Quadrant A Data is divided into 100 sec bins |
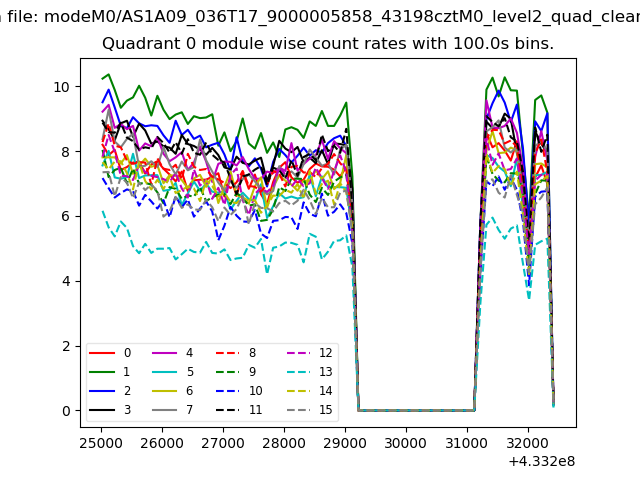 |
 |
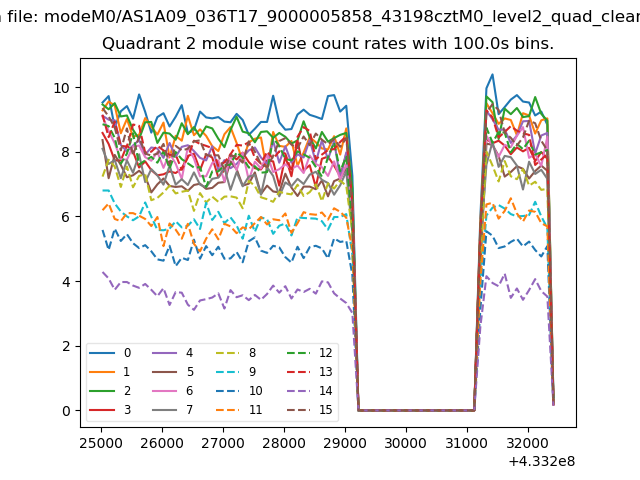
| Module-wise count rates for Quadrant B Data is divided into 100 sec bins |
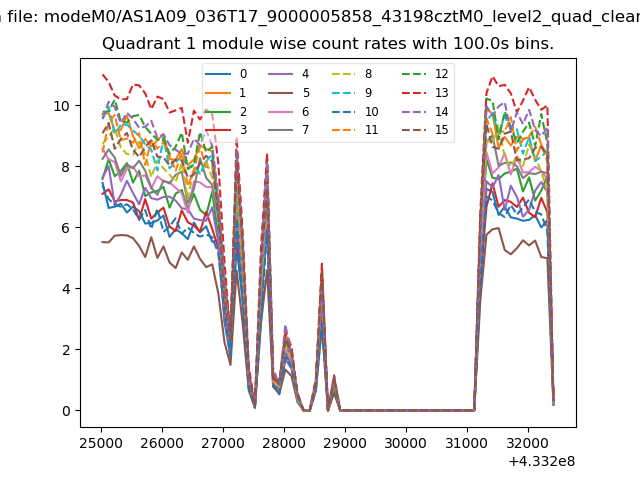 |
 |
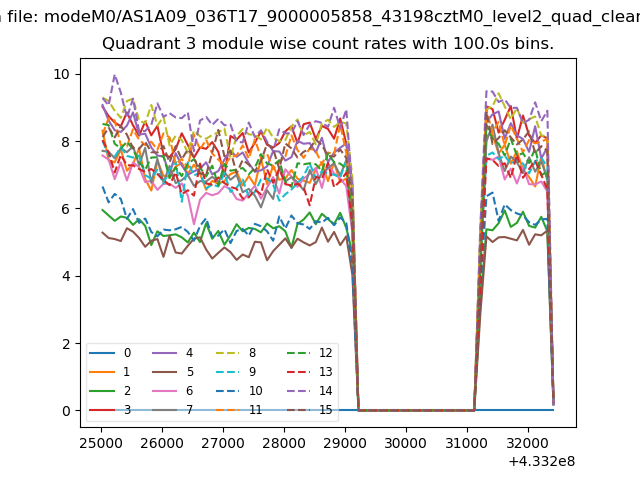
| Module-wise count rates for Quadrant C Data is divided into 100 sec bins |
 |
 |
| Module-wise count rates for Quadrant D Data is divided into 100 sec bins |
 |
 |
| Parameter | Plot |
|---|---|
| CZT HV Monitor | 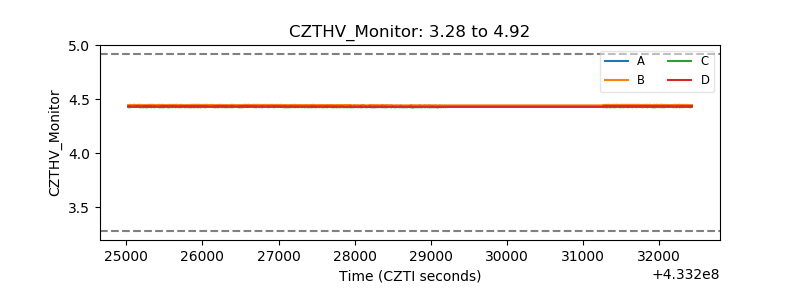 |
| D_VDD | 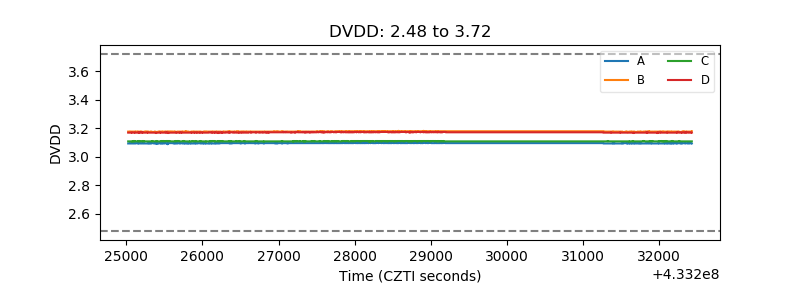 |
| Temperature 1 | 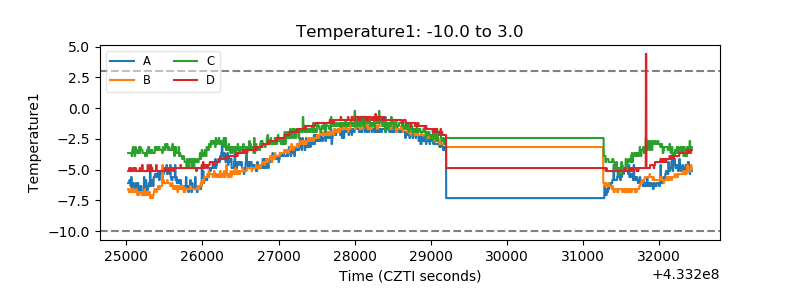 |
| Veto HV Monitor | 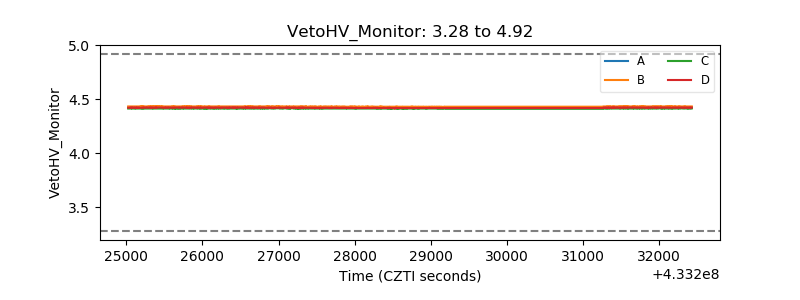 |
| Veto LLD | 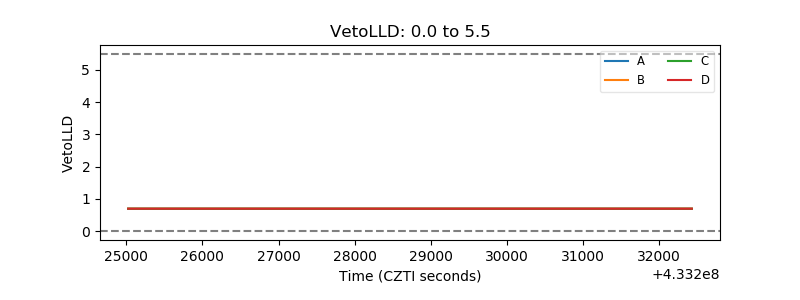 |
| Alpha Counter | 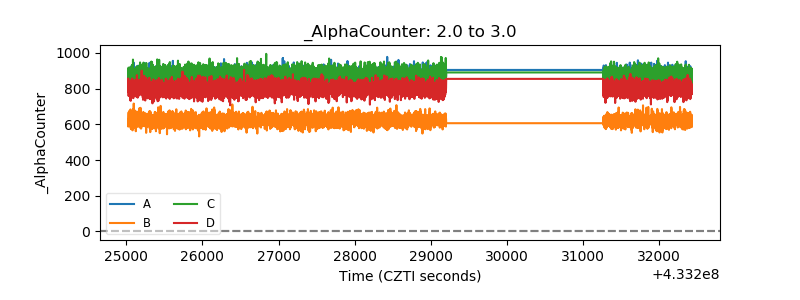 |
| _CPM_Rate | 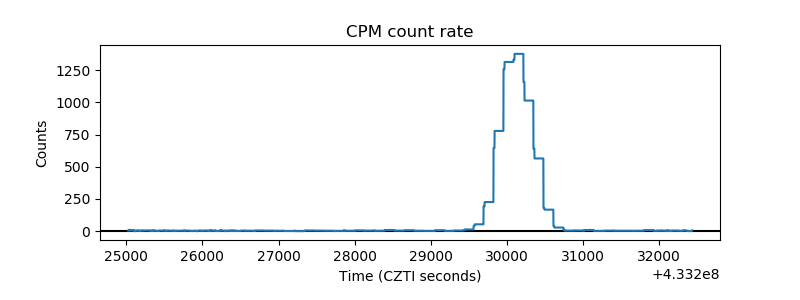 |
| CZT Counter | 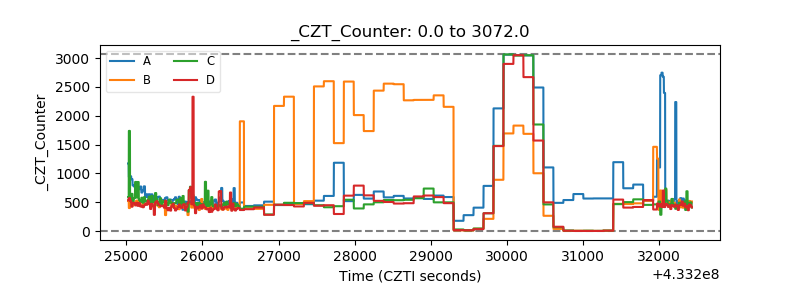 |
| +2.5 Volts monitor | 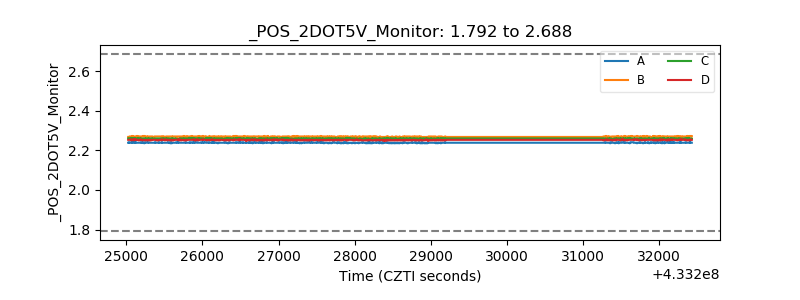 |
| +5 Volts monitor | 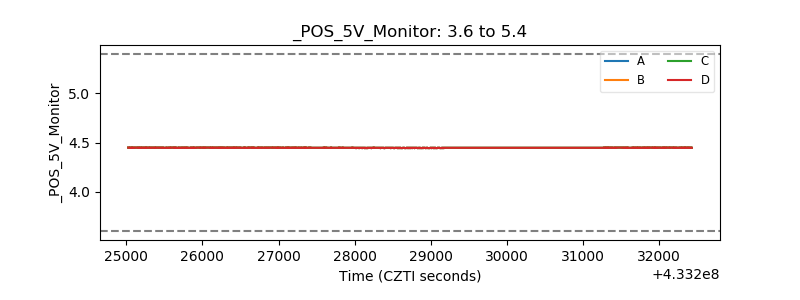 |
| _ROLL_ROT | 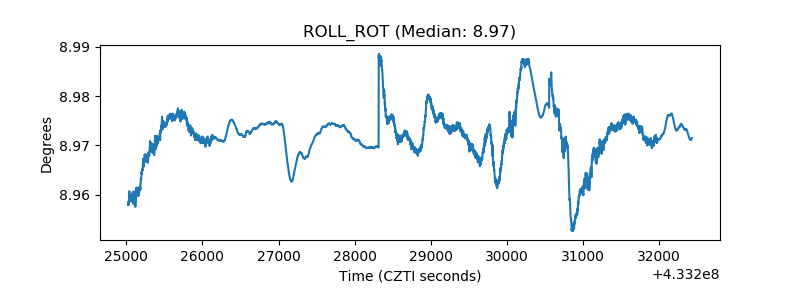 |
| _Roll_DEC | 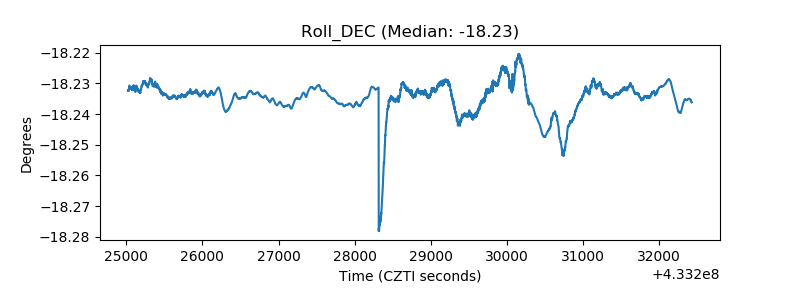 |
| _Roll_RA | 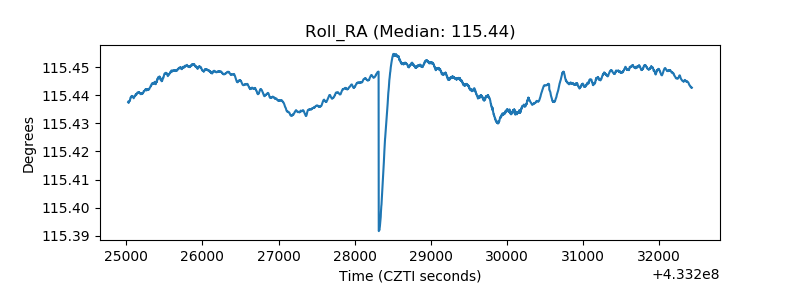 |
| Veto Counter | 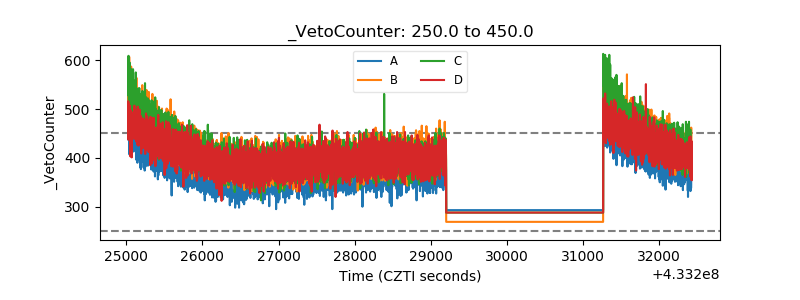 |