| Param | Original file | Final file |
|---|---|---|
| Filename | modeM0/AS1A09_036T17_9000005858_43199cztM0_level2.fits | modeM0/AS1A09_036T17_9000005858_43199cztM0_level2_quad_clean.evt |
| Size (bytes) | 325,368,000 | 84,395,520 |
| Size | 310.3 MB | 80.5 MB |
| Events in quadrant A | 3,267,266 | 566,522 |
| Events in quadrant B | 3,532,516 | 548,999 |
| Events in quadrant C | 2,437,125 | 570,888 |
| Events in quadrant D | 2,423,848 | 523,982 |
| Mode M0 | |||
|---|---|---|---|
| Quadrant | BADHDUFLAG | Total packets | Discarded packets |
| A | 0 | 12756 | 1 |
| B | 0 | 13696 | 1 |
| C | 0 | 10097 | 1 |
| D | 0 | 10498 | 1 |
| Mode SS | |||
|---|---|---|---|
| Quadrant | BADHDUFLAG | Total packets | Discarded packets |
| A | 0 | 102 | 0 |
| B | 0 | 102 | 0 |
| C | 0 | 102 | 0 |
| D | 0 | 102 | 0 |
| Mode M9 | |||
|---|---|---|---|
| Quadrant | BADHDUFLAG | Total packets | Discarded packets |
| A | 0 | 20 | 0 |
| B | 0 | 20 | 0 |
| C | 0 | 20 | 0 |
| D | 0 | 20 | 0 |
| Quadrant | Total seconds | Saturated seconds | Saturation percentage |
|---|---|---|---|
| A | 4915 | 148 | 3.011190% |
| B | 4915 | 424 | 8.626653% |
| C | 4915 | 3 | 0.061038% |
| D | 4915 | 9 | 0.183113% |
Noise dominated data is calculated using 1-second bins in cleaned event files. If a bin has >2000 counts, and if more than 50% of those come from <1% of pixels, then it is considered to be noise-dominated and hence unusable.
| Quadrant | # 1 sec bins | Bins with >0 counts | Bins with >2000 counts | High rate bins dominated by noise | Noise dominated (total time) | Noise dominated (detector-on time) | Marked lightcurve |
|---|---|---|---|---|---|---|---|
| A | 7009 | 4916 | 143 | 143 | 2.04% | 2.91% | 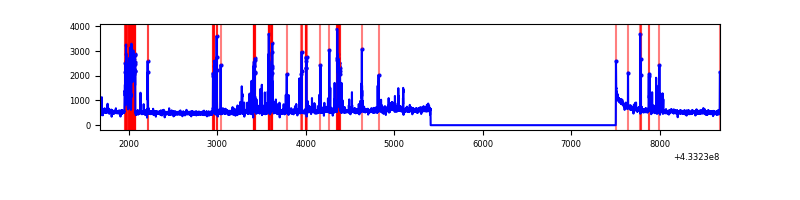 |
| B | 7009 | 4916 | 370 | 370 | 5.28% | 7.53% | 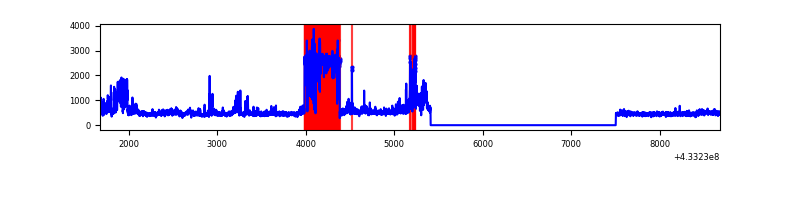 |
| C | 7009 | 4916 | 1 | 1 | 0.01% | 0.02% | 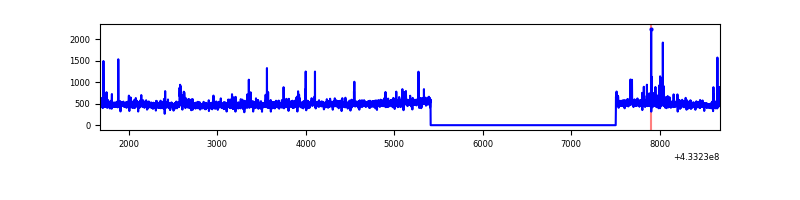 |
| D | 7009 | 4916 | 4 | 4 | 0.06% | 0.08% | 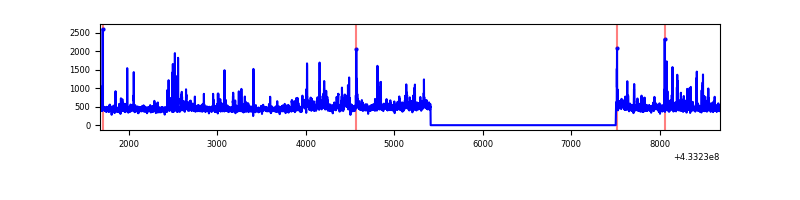 |
Top three noisy pixels from each quadrant. If the there are fewer than three noisy pixels in the level2.evt file, extra rows are filled as -1
| Pixel properties | Quadrant properties | ||||||
|---|---|---|---|---|---|---|---|
| Quadrant | DetID | PixID | Counts | Sigma | Mean | Median | Sigma |
| A | 10 | 83 | 481422 | 4178.99 | 559 | 548 | 115.1 |
| A | 15 | 237 | 427983 | 3714.59 | 559 | 548 | 115.1 |
| A | 13 | 248 | 90756 | 783.94 | 559 | 548 | 115.1 |
| B | 0 | 229 | 1305037 | 12734.23 | 532 | 519 | 102.4 |
| B | 15 | 85 | 37510 | 361.09 | 532 | 519 | 102.4 |
| B | 0 | 186 | 33573 | 322.66 | 532 | 519 | 102.4 |
| C | 15 | 214 | 201712 | 1549.02 | 551 | 556 | 129.9 |
| C | 4 | 254 | 40154 | 304.93 | 551 | 556 | 129.9 |
| C | 15 | 159 | 37512 | 284.58 | 551 | 556 | 129.9 |
| D | 13 | 84 | 77054 | 558.55 | 557 | 543 | 137.0 |
| D | 1 | 52 | 50751 | 366.53 | 557 | 543 | 137.0 |
| D | 2 | 249 | 42466 | 306.05 | 557 | 543 | 137.0 |
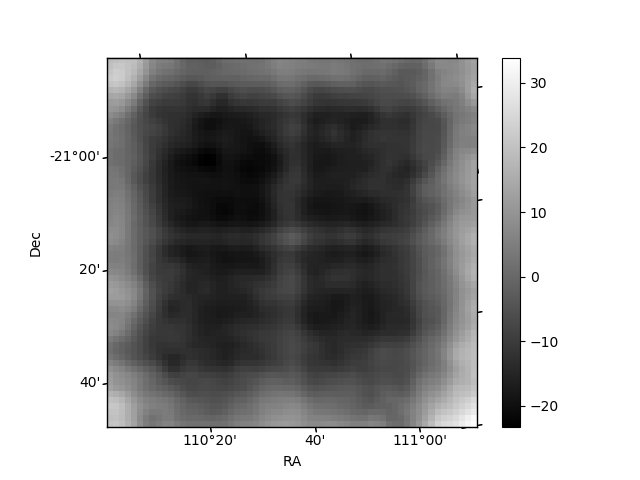
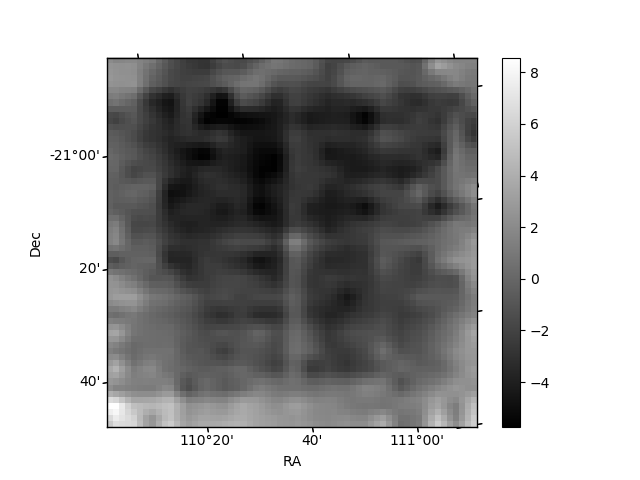
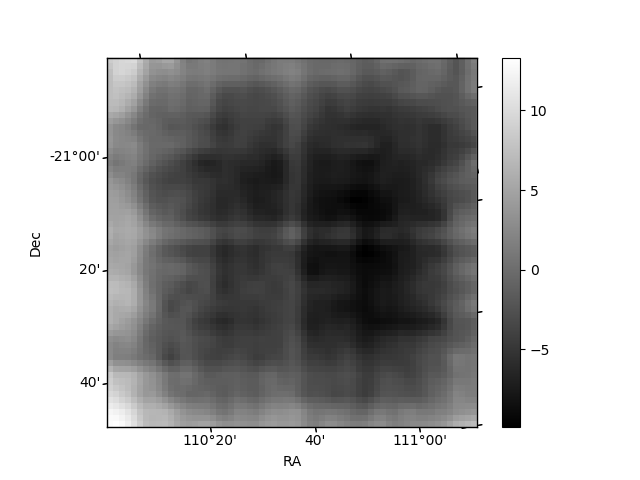
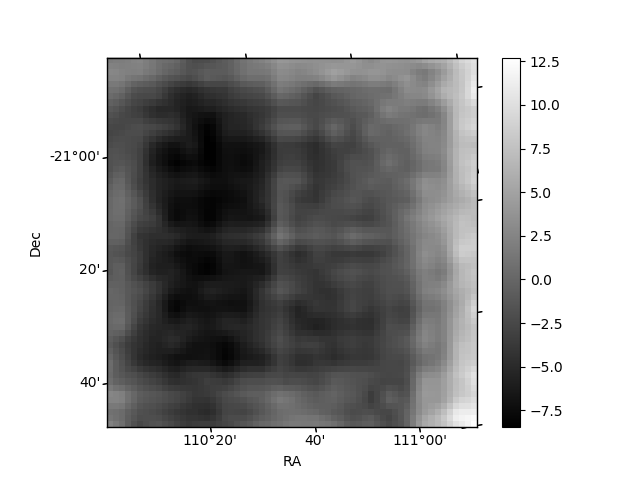
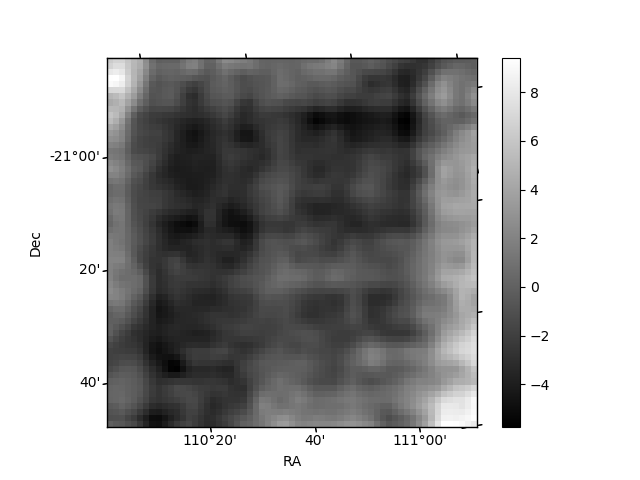
Histogram calculated using DETX and DETY for each event in the final _common_clean file
| Quadrant A | 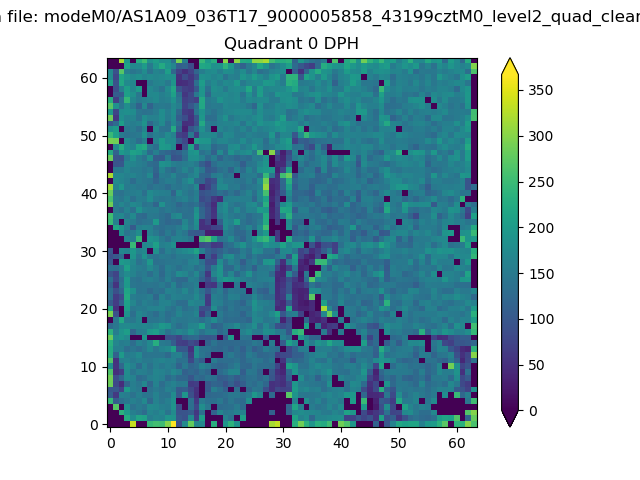 |
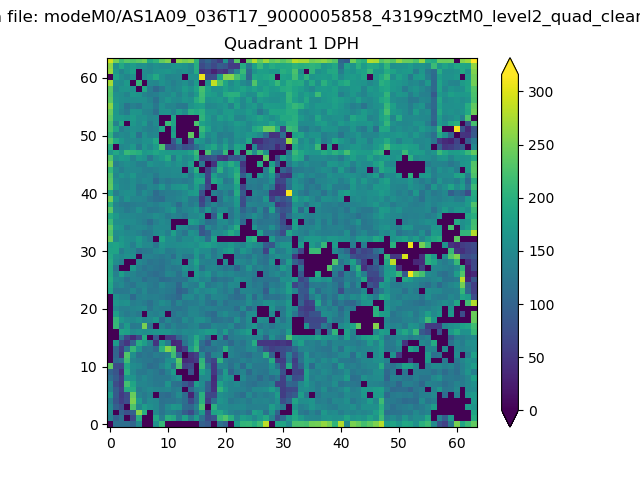 |
Quadrant B |
|---|---|---|---|
| Quadrant D | 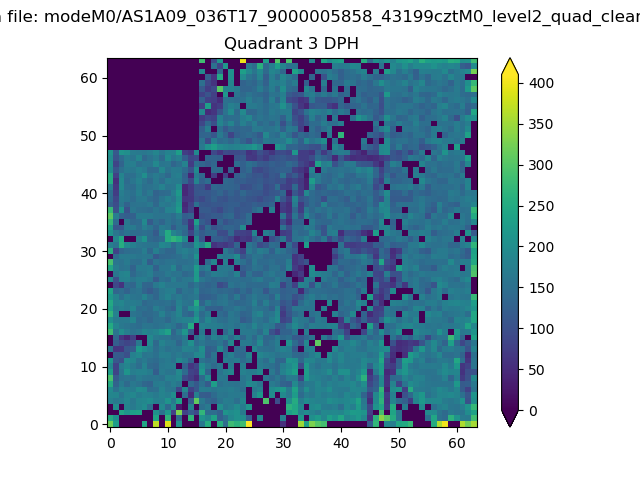 |
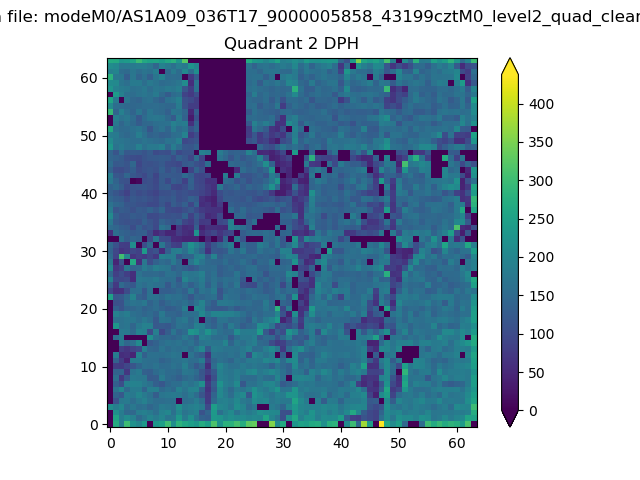 |
Quadrant C |
| Plot type | Count rate plots | Images |
|---|---|---|
| Comparison with Poisson distribution Blue bars denote a histogram of data divided into 1 sec bins. Red curve is a Poisson curve with rate = median count rate of data. |
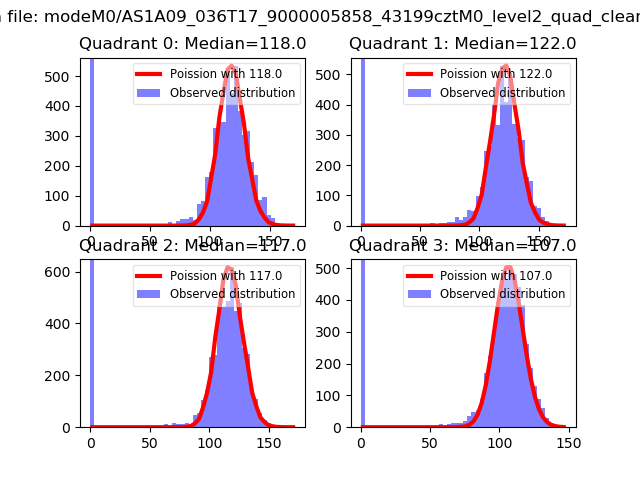 |
 |
| Quadrant-wise count rates Data is divided into 100 sec bins |
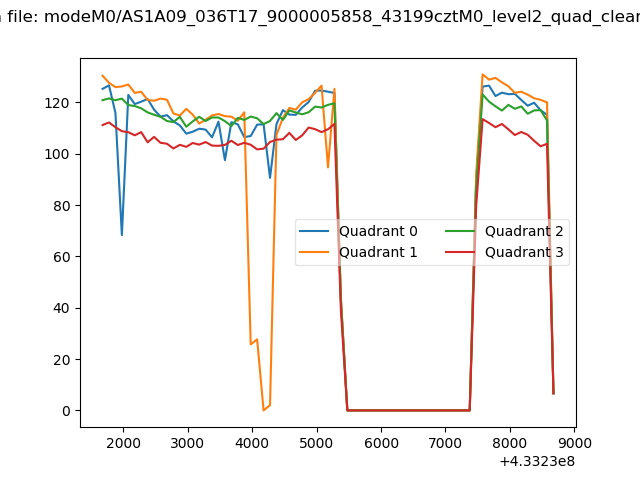 |
|
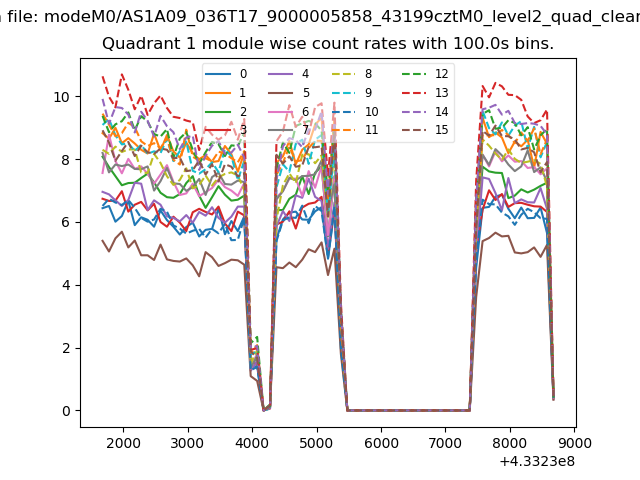
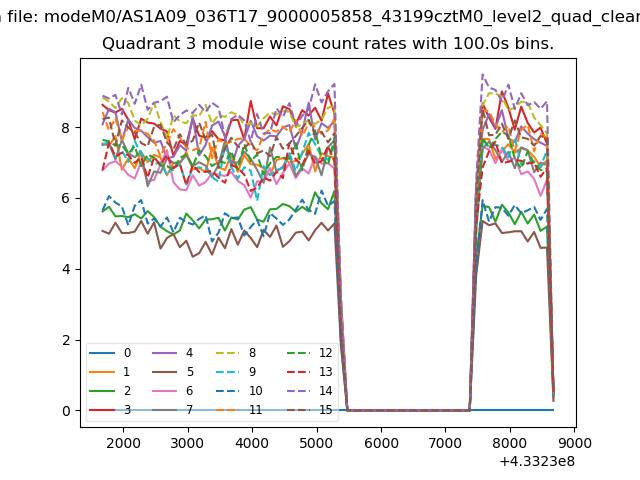
| Module-wise count rates for Quadrant A Data is divided into 100 sec bins |
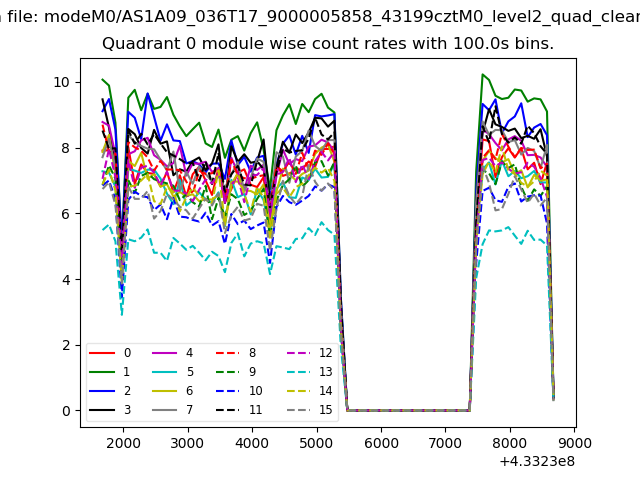 |
 |
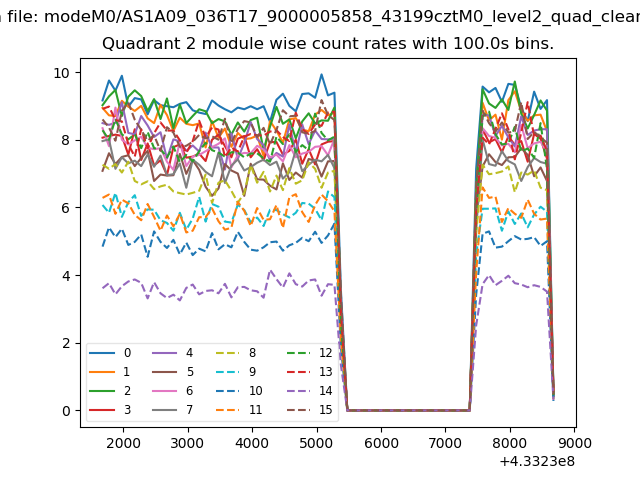
| Module-wise count rates for Quadrant B Data is divided into 100 sec bins |
 |
 |
| Module-wise count rates for Quadrant C Data is divided into 100 sec bins |
 |
 |
| Module-wise count rates for Quadrant D Data is divided into 100 sec bins |
 |
 |
| Parameter | Plot |
|---|---|
| CZT HV Monitor | 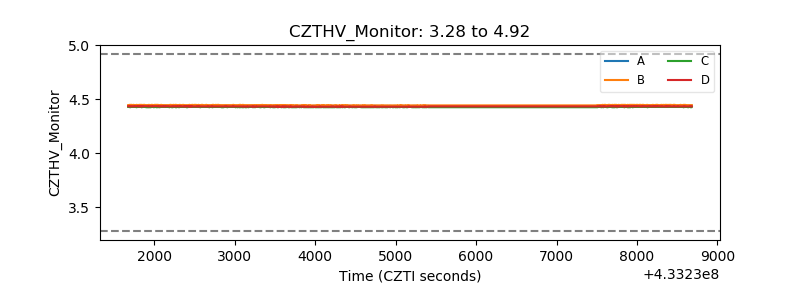 |
| D_VDD | 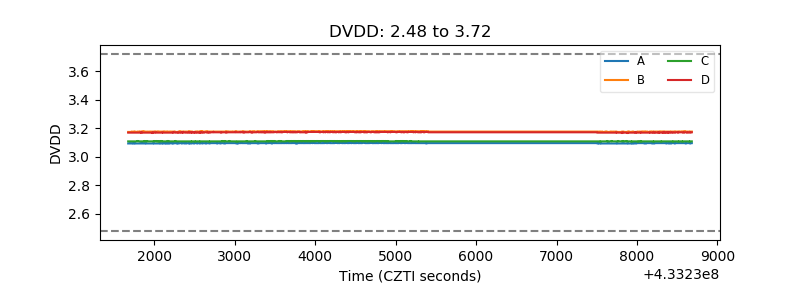 |
| Temperature 1 |  |
| Veto HV Monitor | 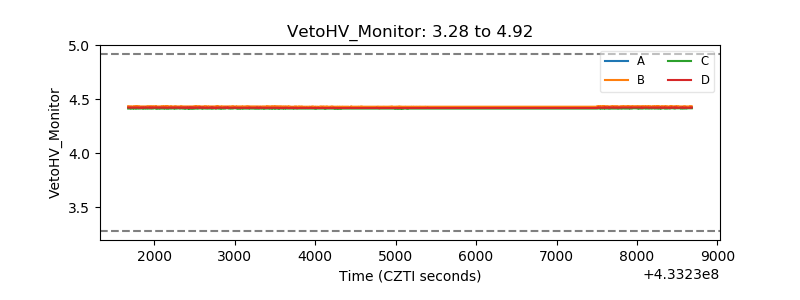 |
| Veto LLD | 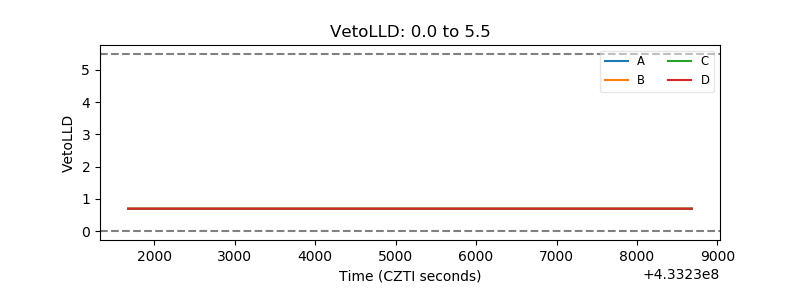 |
| Alpha Counter | 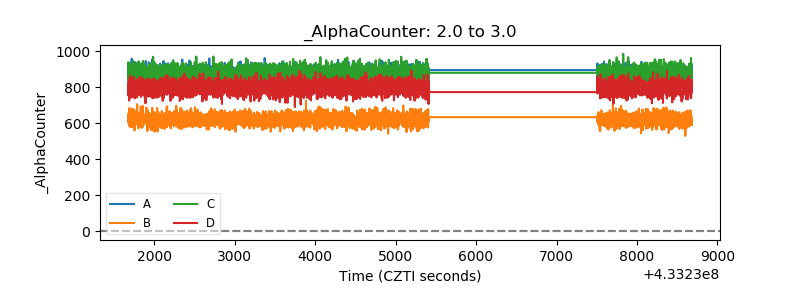 |
| _CPM_Rate | 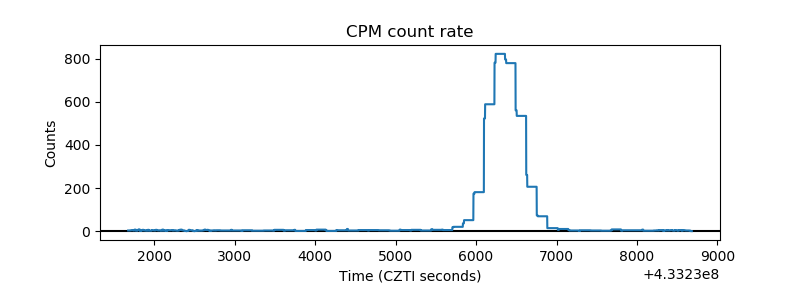 |
| CZT Counter | 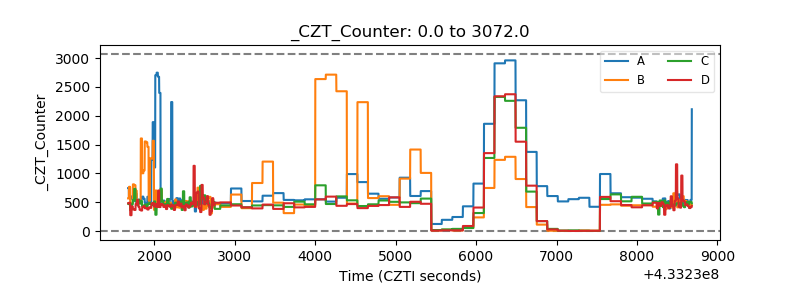 |
| +2.5 Volts monitor | 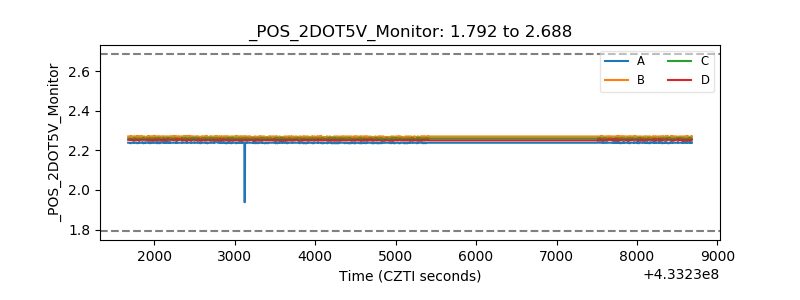 |
| +5 Volts monitor | 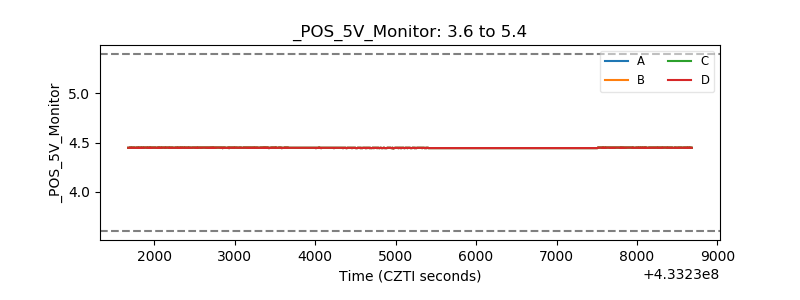 |
| _ROLL_ROT | 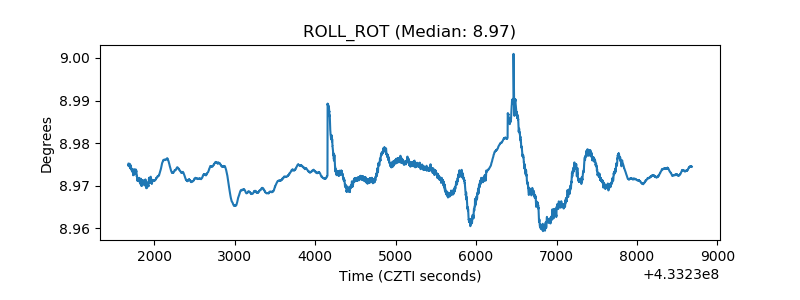 |
| _Roll_DEC | 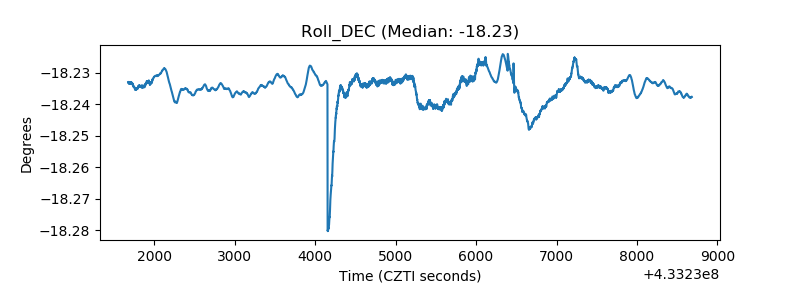 |
| _Roll_RA | 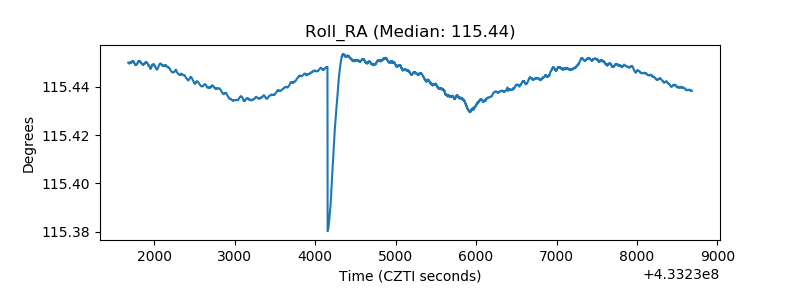 |
| Veto Counter | 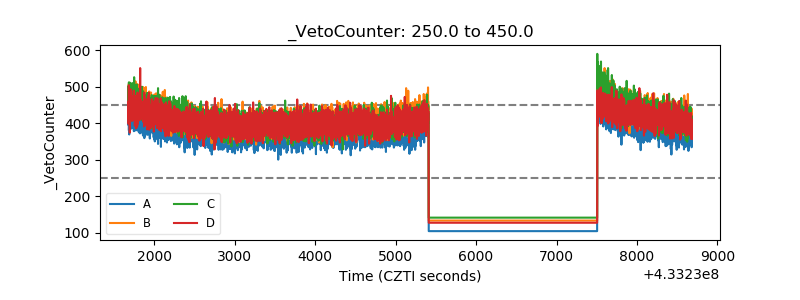 |