| Param | Original file | Final file |
|---|---|---|
| Filename | modeM0/AS1A09_036T17_9000005858_43200cztM0_level2.fits | modeM0/AS1A09_036T17_9000005858_43200cztM0_level2_quad_clean.evt |
| Size (bytes) | 319,104,000 | 85,608,000 |
| Size | 304.3 MB | 81.6 MB |
| Events in quadrant A | 3,463,315 | 559,917 |
| Events in quadrant B | 2,743,701 | 589,891 |
| Events in quadrant C | 2,492,884 | 568,977 |
| Events in quadrant D | 2,720,197 | 520,334 |
| Mode M0 | |||
|---|---|---|---|
| Quadrant | BADHDUFLAG | Total packets | Discarded packets |
| A | 0 | 13366 | 1 |
| B | 0 | 11462 | 2 |
| C | 0 | 10438 | 1 |
| D | 0 | 11477 | 1 |
| Mode SS | |||
|---|---|---|---|
| Quadrant | BADHDUFLAG | Total packets | Discarded packets |
| A | 0 | 104 | 0 |
| B | 0 | 104 | 0 |
| C | 0 | 104 | 0 |
| D | 0 | 104 | 0 |
| Mode M9 | |||
|---|---|---|---|
| Quadrant | BADHDUFLAG | Total packets | Discarded packets |
| A | 0 | 21 | 0 |
| B | 0 | 21 | 0 |
| C | 0 | 21 | 0 |
| D | 0 | 21 | 0 |
| Quadrant | Total seconds | Saturated seconds | Saturation percentage |
|---|---|---|---|
| A | 5033 | 199 | 3.953904% |
| B | 5033 | 51 | 1.013312% |
| C | 5033 | 4 | 0.079475% |
| D | 5033 | 40 | 0.794755% |
Noise dominated data is calculated using 1-second bins in cleaned event files. If a bin has >2000 counts, and if more than 50% of those come from <1% of pixels, then it is considered to be noise-dominated and hence unusable.
| Quadrant | # 1 sec bins | Bins with >0 counts | Bins with >2000 counts | High rate bins dominated by noise | Noise dominated (total time) | Noise dominated (detector-on time) | Marked lightcurve |
|---|---|---|---|---|---|---|---|
| A | 7155 | 5034 | 173 | 173 | 2.42% | 3.44% | 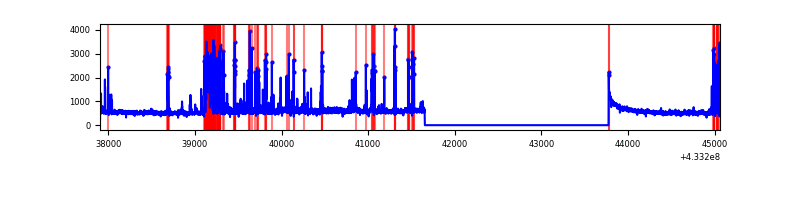 |
| B | 7155 | 5034 | 27 | 27 | 0.38% | 0.54% | 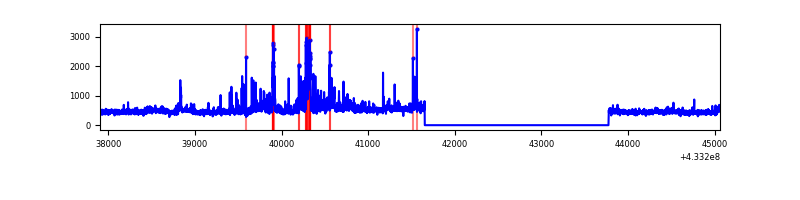 |
| C | 7155 | 5034 | 3 | 3 | 0.04% | 0.06% | 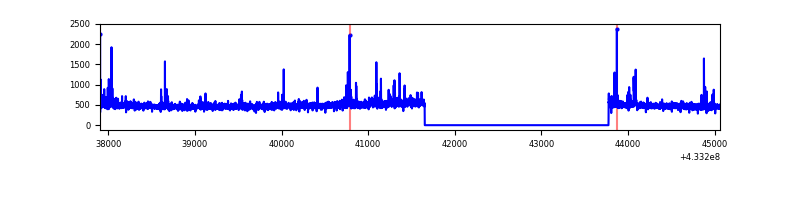 |
| D | 7155 | 5034 | 40 | 40 | 0.56% | 0.79% | 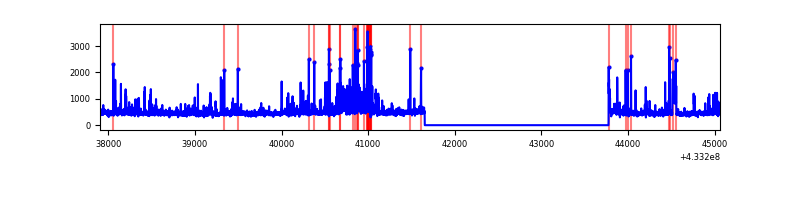 |
Top three noisy pixels from each quadrant. If the there are fewer than three noisy pixels in the level2.evt file, extra rows are filled as -1
| Pixel properties | Quadrant properties | ||||||
|---|---|---|---|---|---|---|---|
| Quadrant | DetID | PixID | Counts | Sigma | Mean | Median | Sigma |
| A | 10 | 83 | 509847 | 4381.71 | 564 | 552 | 116.2 |
| A | 13 | 248 | 386682 | 3322.06 | 564 | 552 | 116.2 |
| A | 15 | 237 | 281969 | 2421.17 | 564 | 552 | 116.2 |
| B | 0 | 229 | 274906 | 2511.8 | 564 | 550 | 109.2 |
| B | 0 | 189 | 103520 | 942.72 | 564 | 550 | 109.2 |
| B | 0 | 186 | 72869 | 662.1 | 564 | 550 | 109.2 |
| C | 15 | 214 | 205712 | 1565.26 | 557 | 560 | 131.1 |
| C | 4 | 254 | 60345 | 456.14 | 557 | 560 | 131.1 |
| C | 15 | 159 | 30913 | 231.59 | 557 | 560 | 131.1 |
| D | 1 | 52 | 327393 | 2364.24 | 562 | 548 | 138.2 |
| D | 12 | 16 | 70824 | 508.34 | 562 | 548 | 138.2 |
| D | 13 | 249 | 65248 | 468.01 | 562 | 548 | 138.2 |
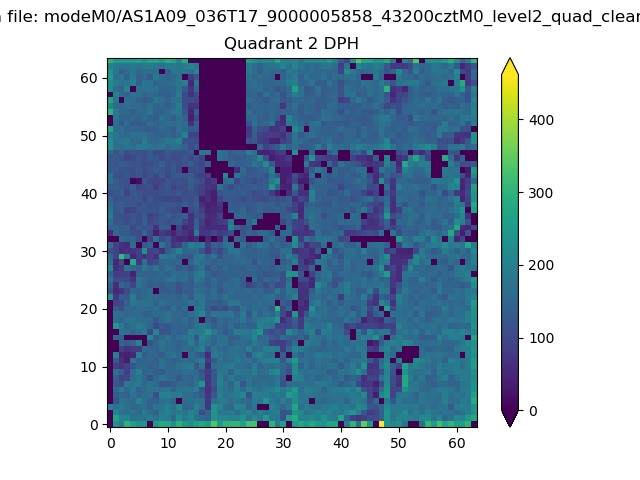
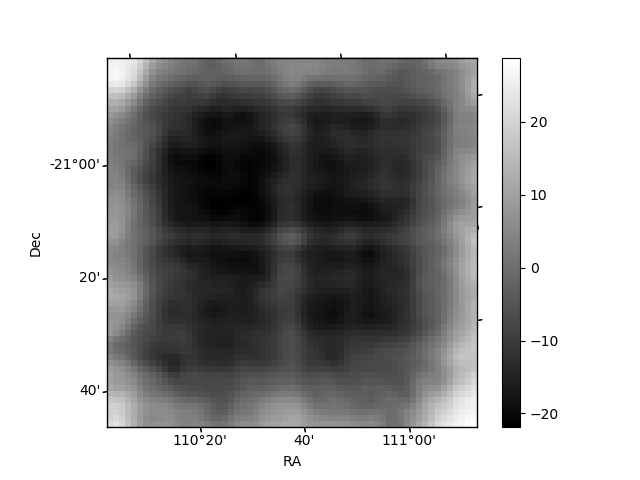
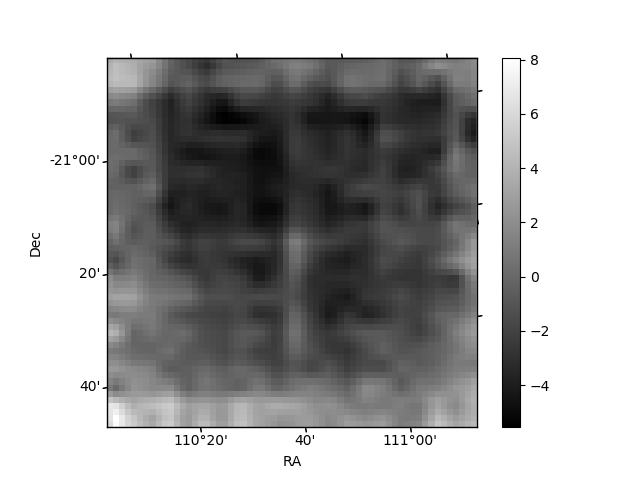
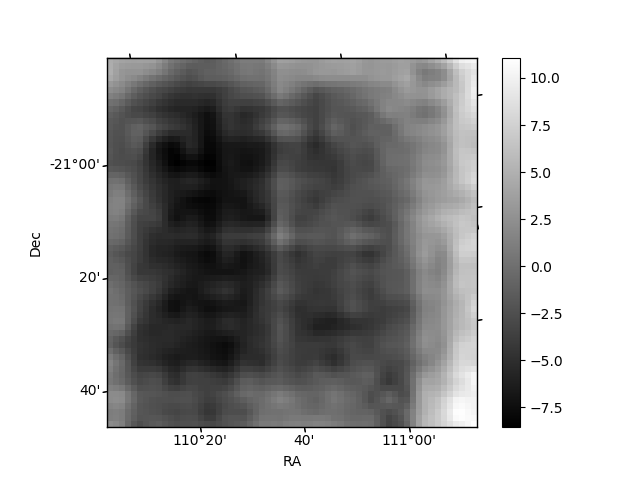
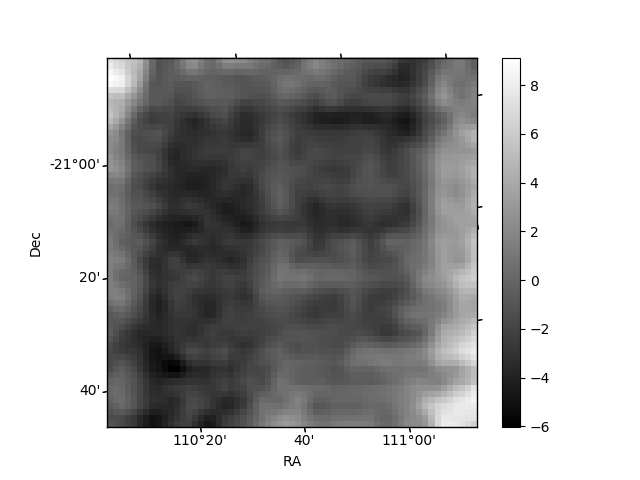
Histogram calculated using DETX and DETY for each event in the final _common_clean file
| Quadrant A | 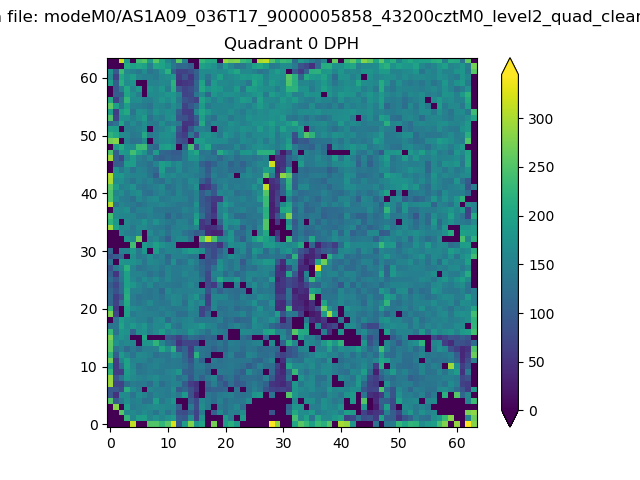 |
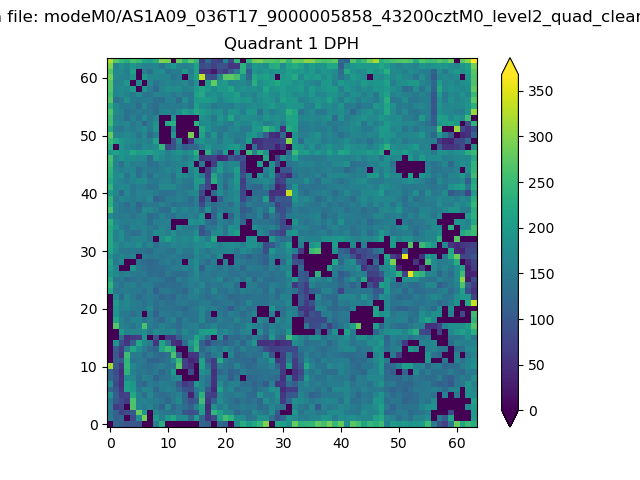 |
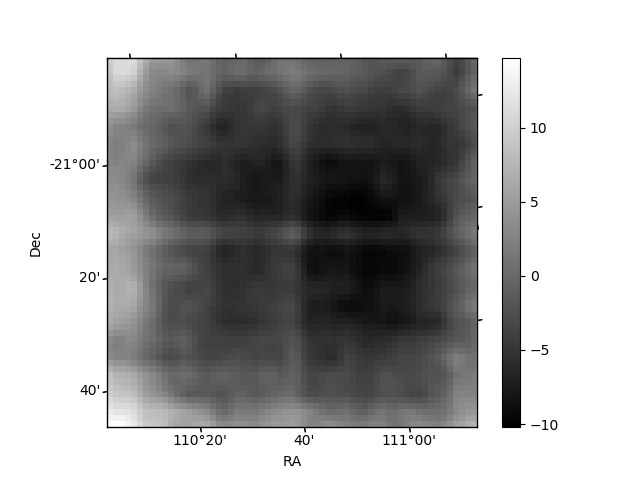
Quadrant B |
|---|---|---|---|
| Quadrant D | 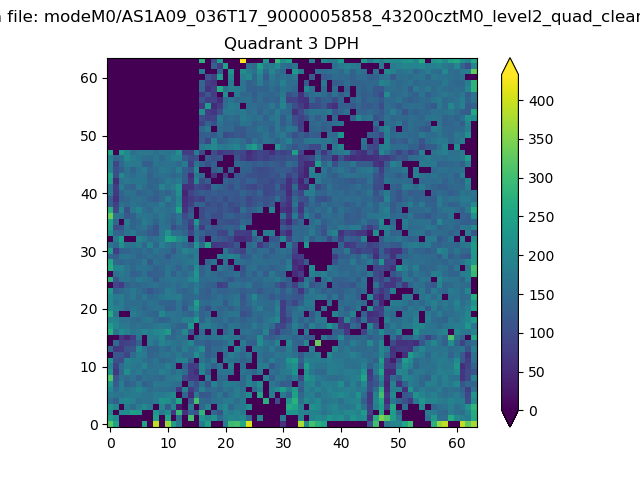 |
 |
Quadrant C |
| Plot type | Count rate plots | Images |
|---|---|---|
| Comparison with Poisson distribution Blue bars denote a histogram of data divided into 1 sec bins. Red curve is a Poisson curve with rate = median count rate of data. |
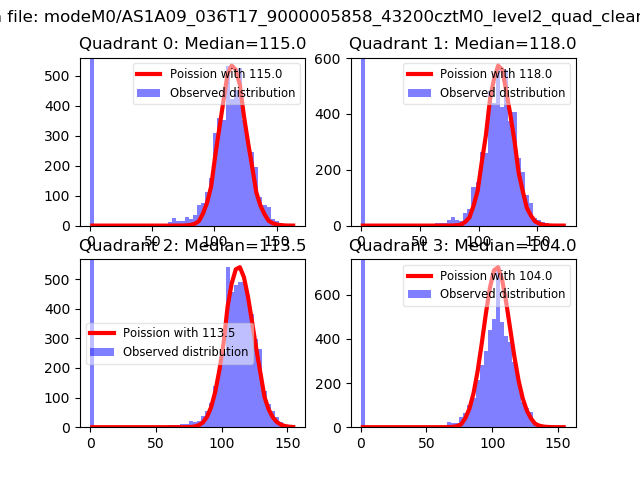 |
 |
| Quadrant-wise count rates Data is divided into 100 sec bins |
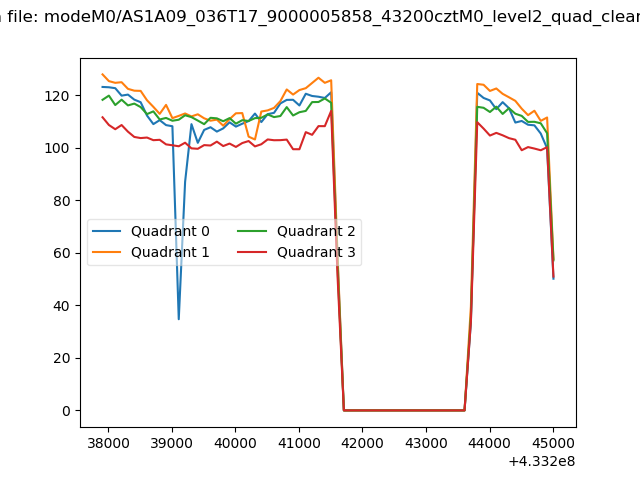 |
|
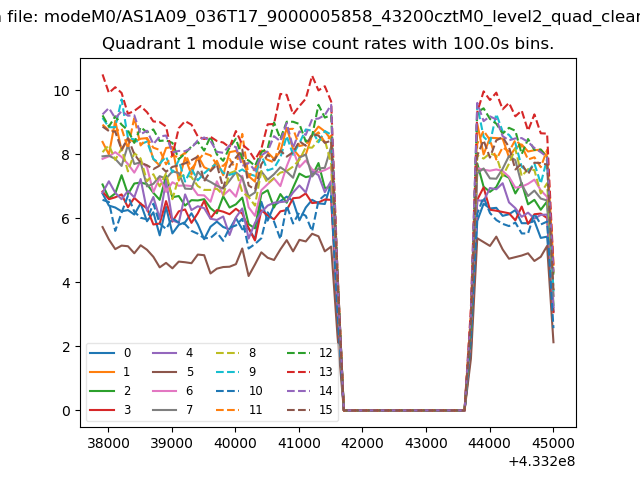
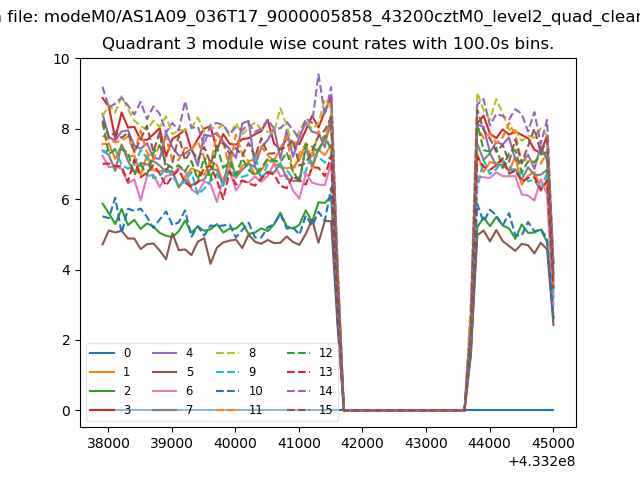
| Module-wise count rates for Quadrant A Data is divided into 100 sec bins |
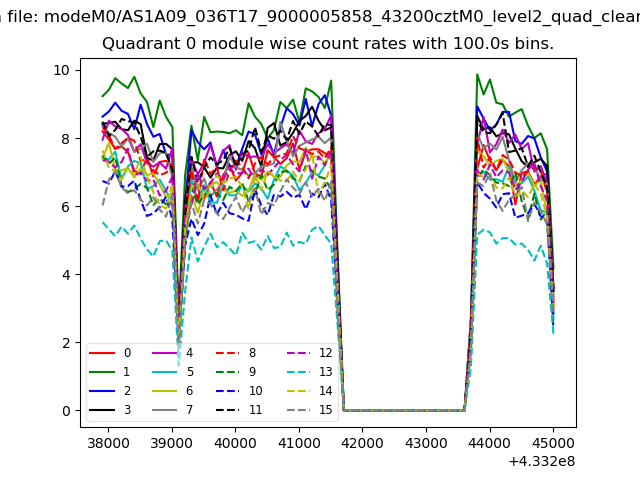 |
 |
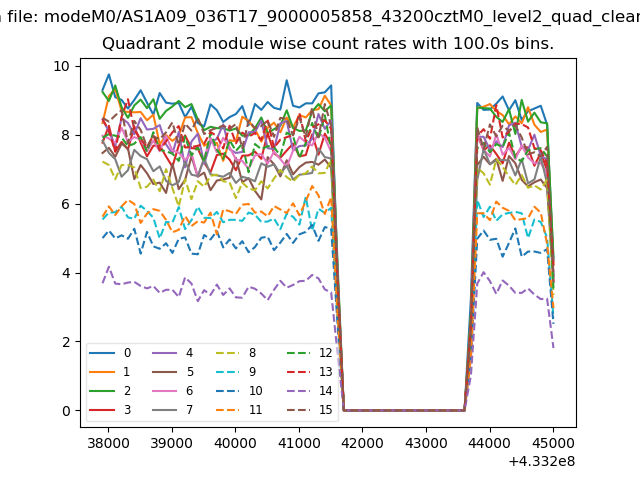
| Module-wise count rates for Quadrant B Data is divided into 100 sec bins |
 |
 |
| Module-wise count rates for Quadrant C Data is divided into 100 sec bins |
 |
 |
| Module-wise count rates for Quadrant D Data is divided into 100 sec bins |
 |
 |
| Parameter | Plot |
|---|---|
| CZT HV Monitor | 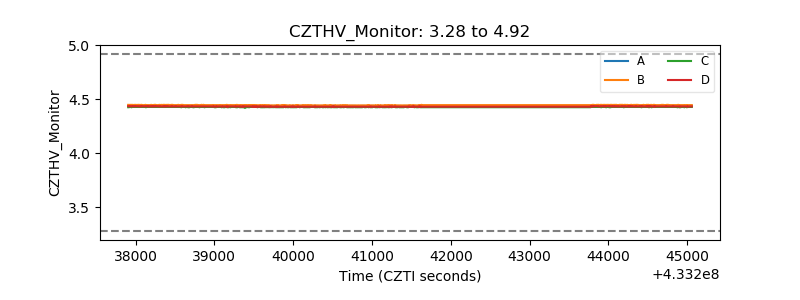 |
| D_VDD | 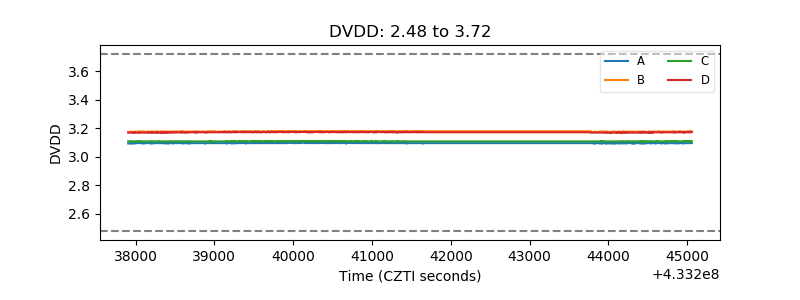 |
| Temperature 1 | 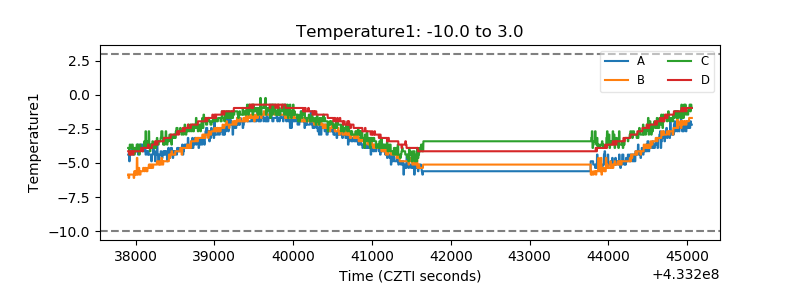 |
| Veto HV Monitor | 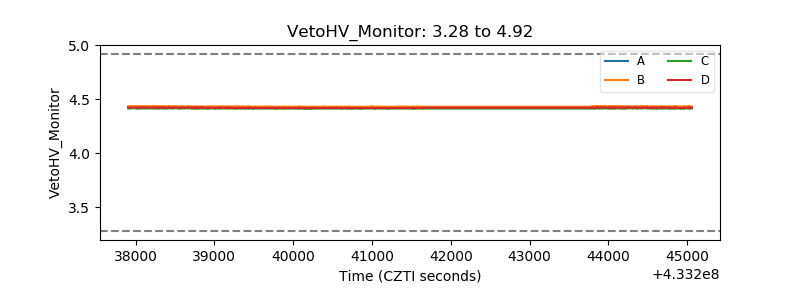 |
| Veto LLD | 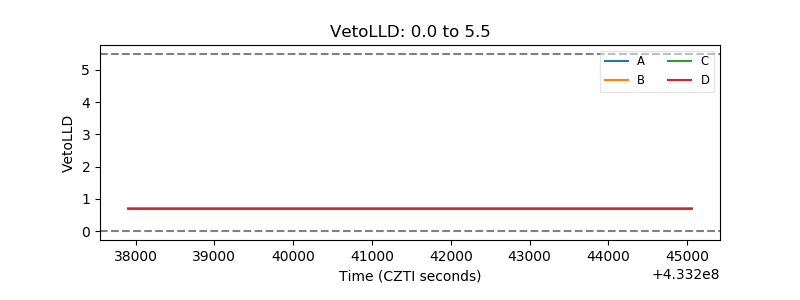 |
| Alpha Counter | 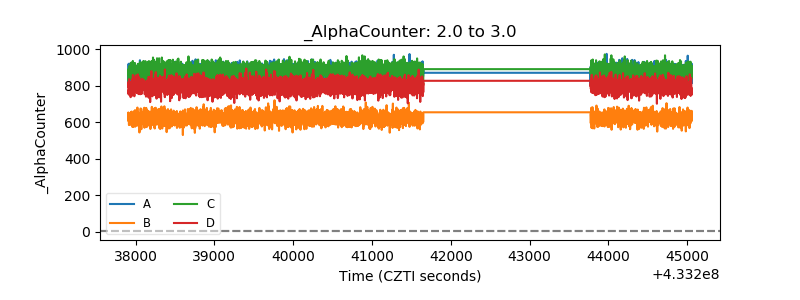 |
| _CPM_Rate |  |
| CZT Counter | 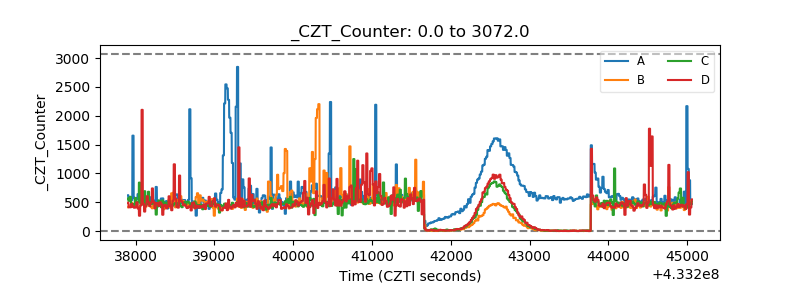 |
| +2.5 Volts monitor | 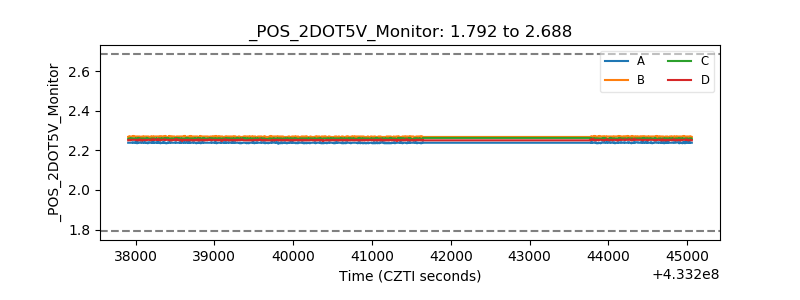 |
| +5 Volts monitor | 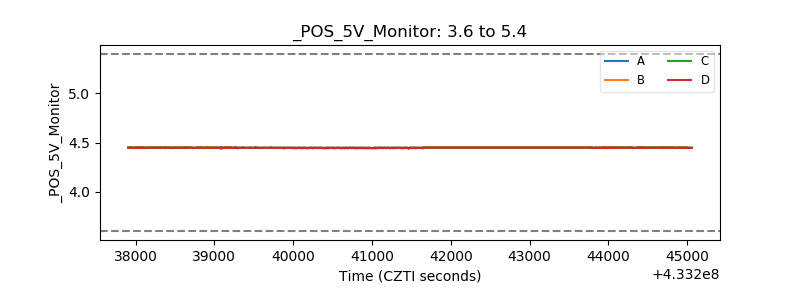 |
| _ROLL_ROT | 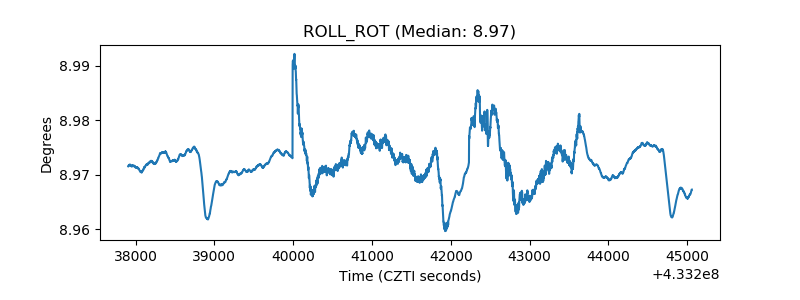 |
| _Roll_DEC | 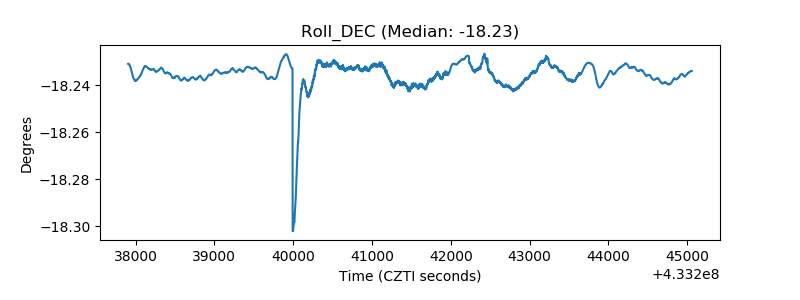 |
| _Roll_RA | 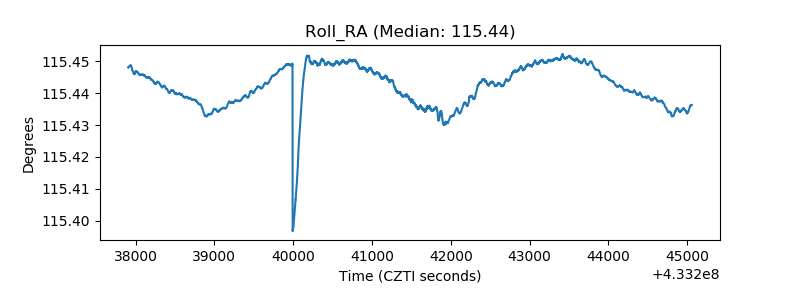 |
| Veto Counter | 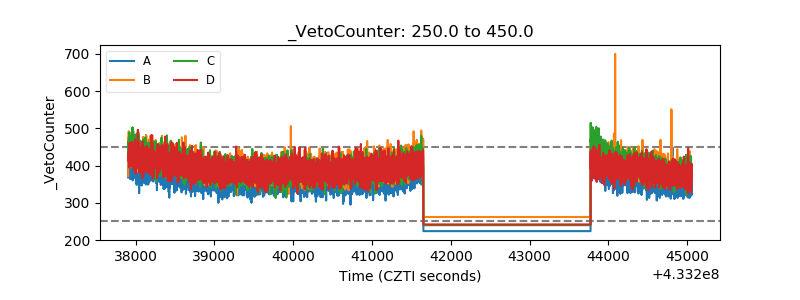 |