| Param | Original file | Final file |
|---|---|---|
| Filename | modeM0/AS1A09_036T17_9000005858_43202cztM0_level2.fits | modeM0/AS1A09_036T17_9000005858_43202cztM0_level2_quad_clean.evt |
| Size (bytes) | 366,552,000 | 89,867,520 |
| Size | 349.6 MB | 85.7 MB |
| Events in quadrant A | 3,942,779 | 588,681 |
| Events in quadrant B | 2,722,468 | 617,044 |
| Events in quadrant C | 2,615,976 | 595,270 |
| Events in quadrant D | 3,855,892 | 532,347 |
| Mode M0 | |||
|---|---|---|---|
| Quadrant | BADHDUFLAG | Total packets | Discarded packets |
| A | 0 | 15364 | 2 |
| B | 0 | 11797 | 2 |
| C | 0 | 11221 | 2 |
| D | 0 | 15211 | 2 |
| Mode SS | |||
|---|---|---|---|
| Quadrant | BADHDUFLAG | Total packets | Discarded packets |
| A | 0 | 112 | 0 |
| B | 0 | 112 | 0 |
| C | 0 | 112 | 0 |
| D | 0 | 112 | 0 |
| Mode M9 | |||
|---|---|---|---|
| Quadrant | BADHDUFLAG | Total packets | Discarded packets |
| A | 0 | 18 | 0 |
| B | 0 | 18 | 0 |
| C | 0 | 18 | 0 |
| D | 0 | 18 | 0 |
| Quadrant | Total seconds | Saturated seconds | Saturation percentage |
|---|---|---|---|
| A | 5544 | 156 | 2.813853% |
| B | 5545 | 22 | 0.396754% |
| C | 5545 | 6 | 0.108206% |
| D | 5545 | 196 | 3.534716% |
Noise dominated data is calculated using 1-second bins in cleaned event files. If a bin has >2000 counts, and if more than 50% of those come from <1% of pixels, then it is considered to be noise-dominated and hence unusable.
| Quadrant | # 1 sec bins | Bins with >0 counts | Bins with >2000 counts | High rate bins dominated by noise | Noise dominated (total time) | Noise dominated (detector-on time) | Marked lightcurve |
|---|---|---|---|---|---|---|---|
| A | 7305 | 5545 | 124 | 124 | 1.70% | 2.24% | 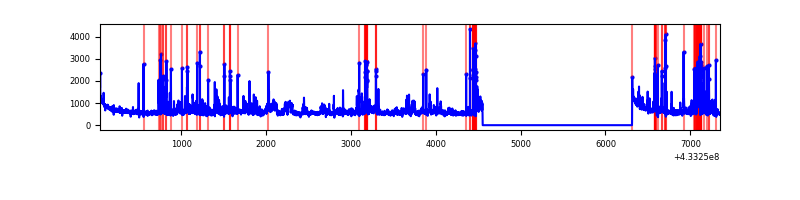 |
| B | 7306 | 5546 | 15 | 15 | 0.21% | 0.27% | 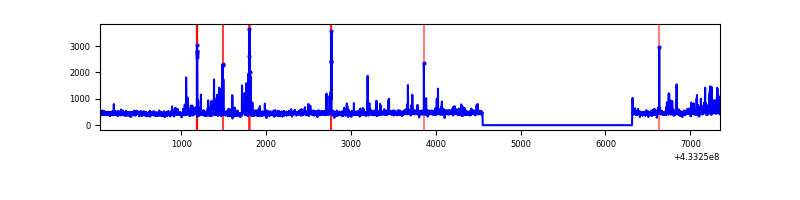 |
| C | 7306 | 5546 | 1 | 1 | 0.01% | 0.02% | 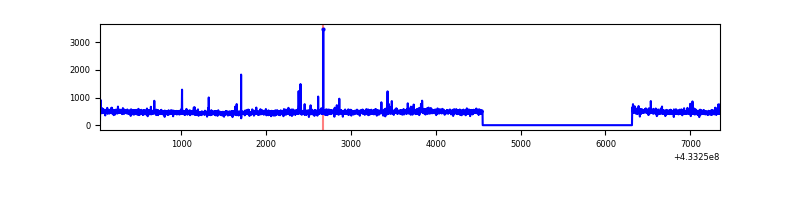 |
| D | 7306 | 5546 | 199 | 199 | 2.72% | 3.59% | 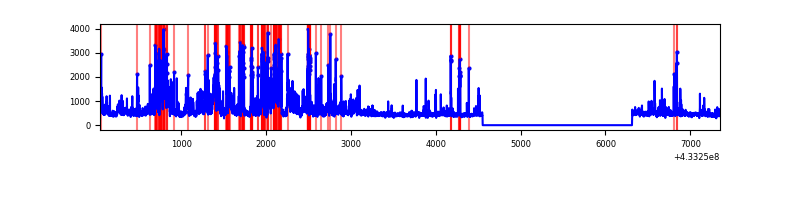 |
Top three noisy pixels from each quadrant. If the there are fewer than three noisy pixels in the level2.evt file, extra rows are filled as -1
| Pixel properties | Quadrant properties | ||||||
|---|---|---|---|---|---|---|---|
| Quadrant | DetID | PixID | Counts | Sigma | Mean | Median | Sigma |
| A | 10 | 83 | 631122 | 5034.45 | 607 | 594 | 125.2 |
| A | 15 | 237 | 386734 | 3083.13 | 607 | 594 | 125.2 |
| A | 12 | 189 | 342193 | 2727.49 | 607 | 594 | 125.2 |
| B | 0 | 229 | 117325 | 971.14 | 610 | 593 | 120.2 |
| B | 0 | 186 | 104421 | 863.79 | 610 | 593 | 120.2 |
| B | 3 | 112 | 34164 | 279.29 | 610 | 593 | 120.2 |
| C | 15 | 214 | 233096 | 1640.73 | 599 | 603 | 141.7 |
| C | 14 | 254 | 38013 | 264.01 | 599 | 603 | 141.7 |
| C | 4 | 254 | 10448 | 69.48 | 599 | 603 | 141.7 |
| D | 1 | 52 | 1032638 | 6922.46 | 594 | 576 | 149.1 |
| D | 12 | 16 | 425685 | 2851.38 | 594 | 576 | 149.1 |
| D | 13 | 249 | 41396 | 273.8 | 594 | 576 | 149.1 |
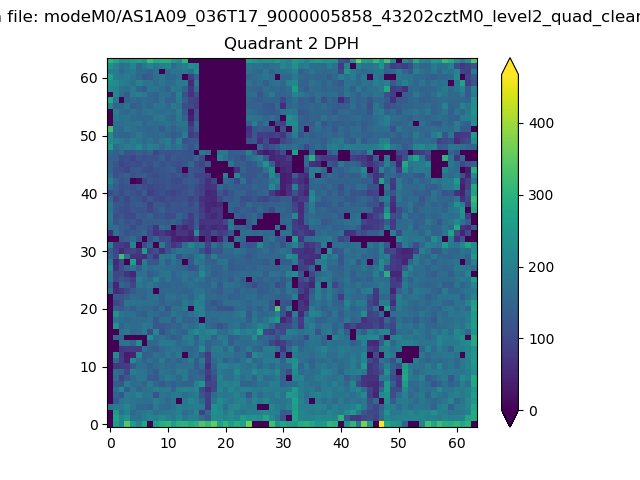
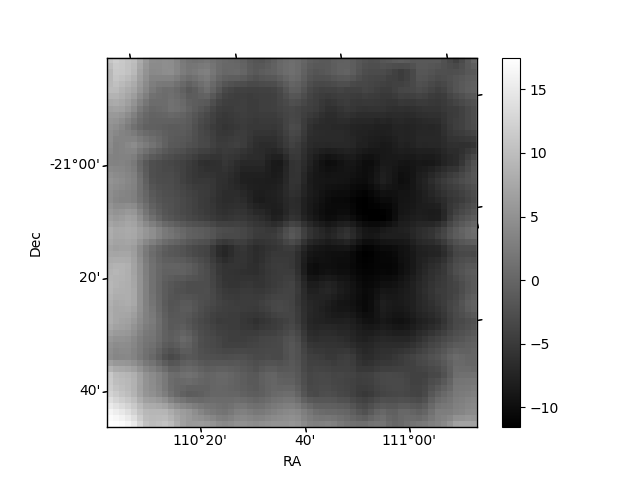
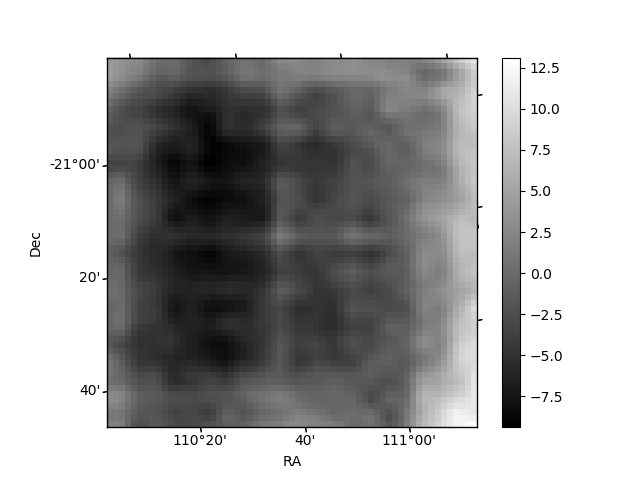
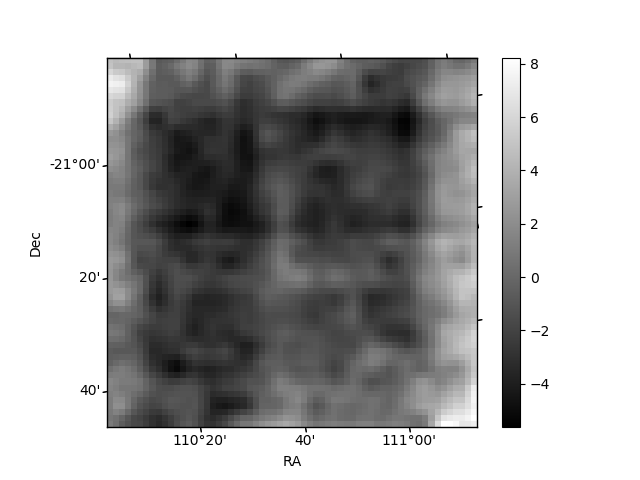
Histogram calculated using DETX and DETY for each event in the final _common_clean file
| Quadrant A | 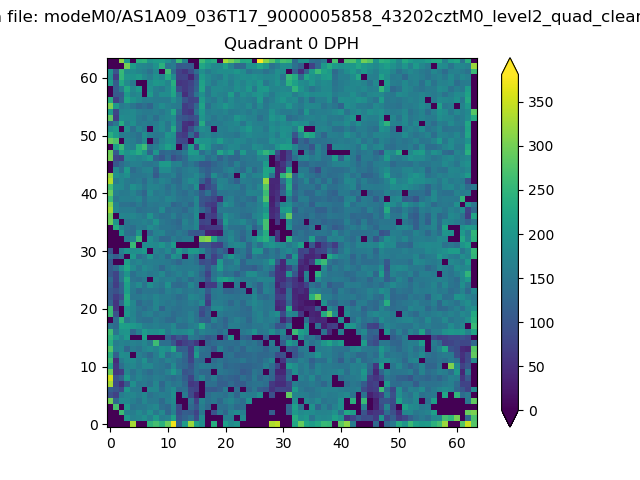 |
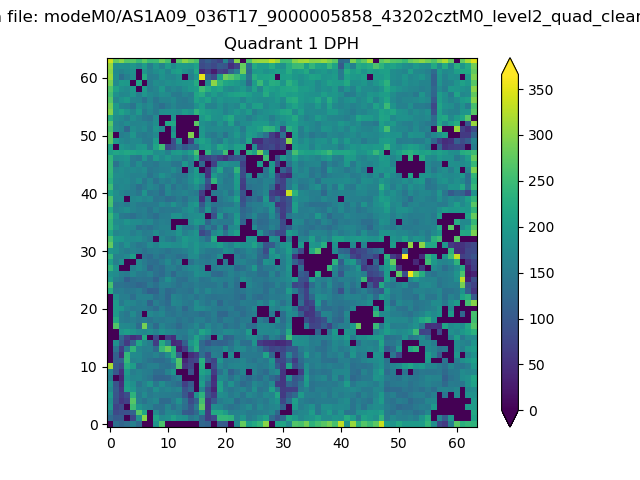 |
Quadrant B |
|---|---|---|---|
| Quadrant D | 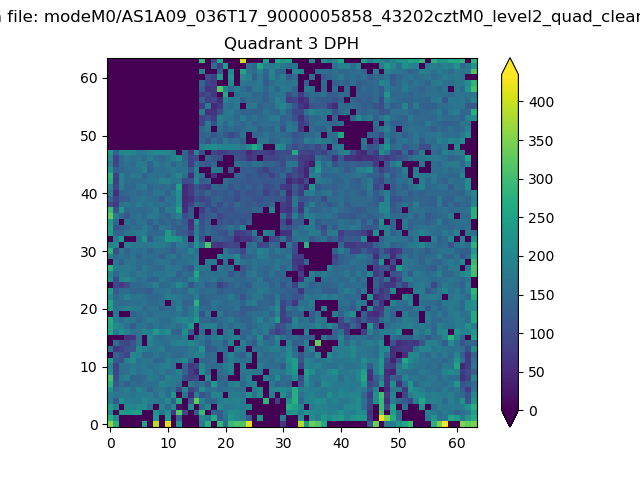 |
 |
Quadrant C |
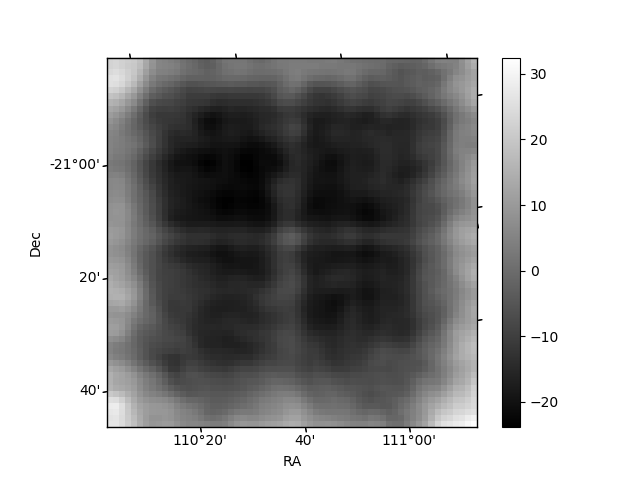
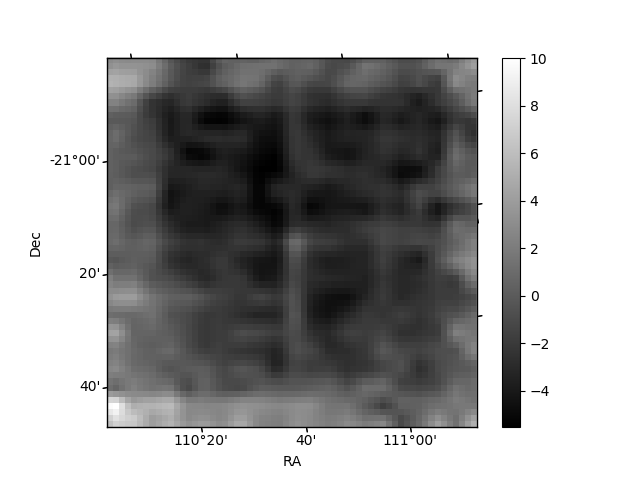
| Plot type | Count rate plots | Images |
|---|---|---|
| Comparison with Poisson distribution Blue bars denote a histogram of data divided into 1 sec bins. Red curve is a Poisson curve with rate = median count rate of data. |
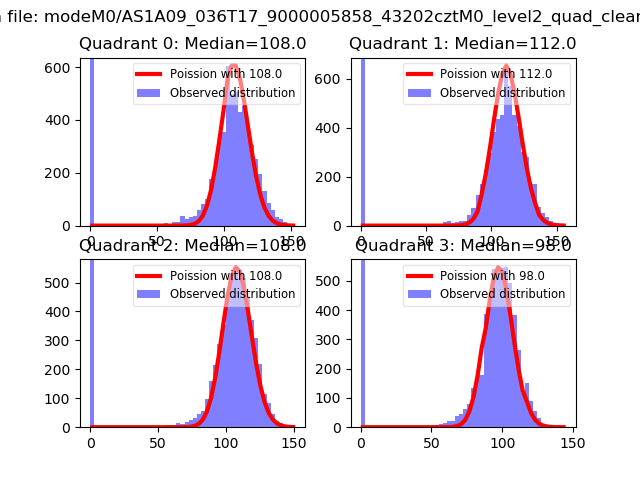 |
 |
| Quadrant-wise count rates Data is divided into 100 sec bins |
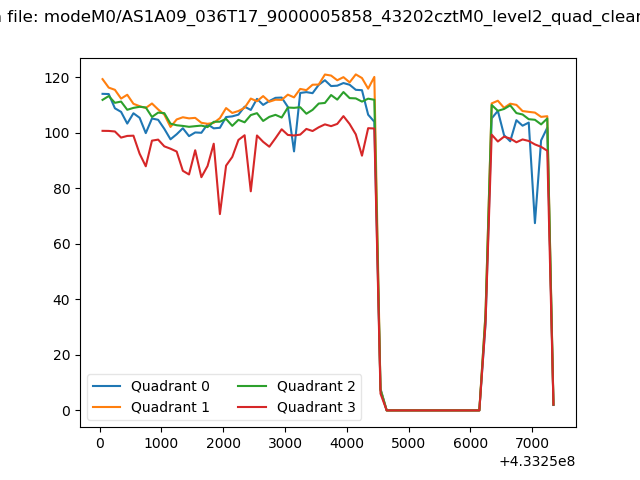 |
|
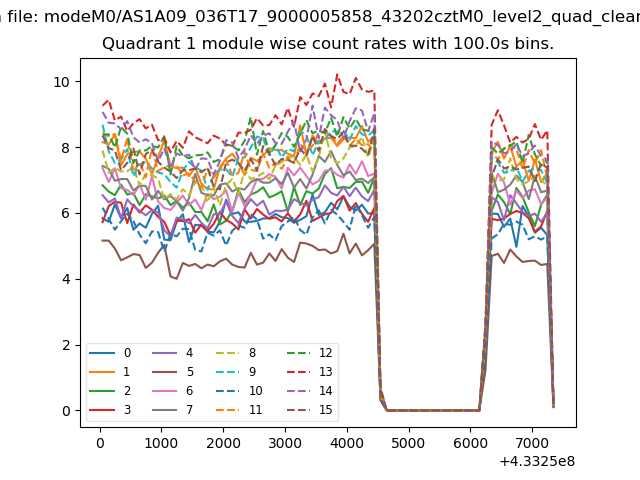
| Module-wise count rates for Quadrant A Data is divided into 100 sec bins |
 |
 |
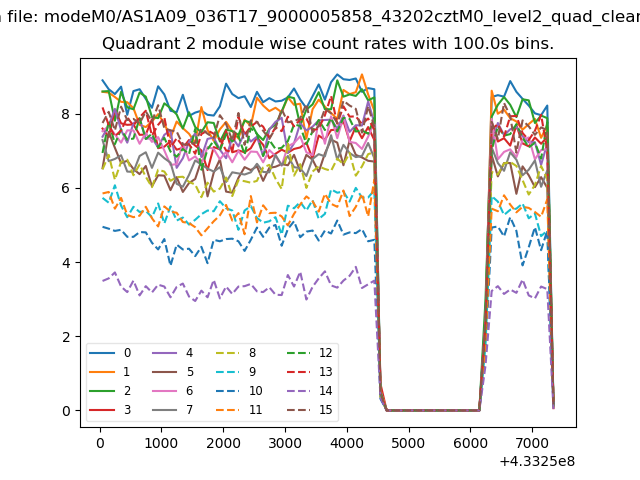
| Module-wise count rates for Quadrant B Data is divided into 100 sec bins |
 |
 |
| Module-wise count rates for Quadrant C Data is divided into 100 sec bins |
 |
 |
| Module-wise count rates for Quadrant D Data is divided into 100 sec bins |
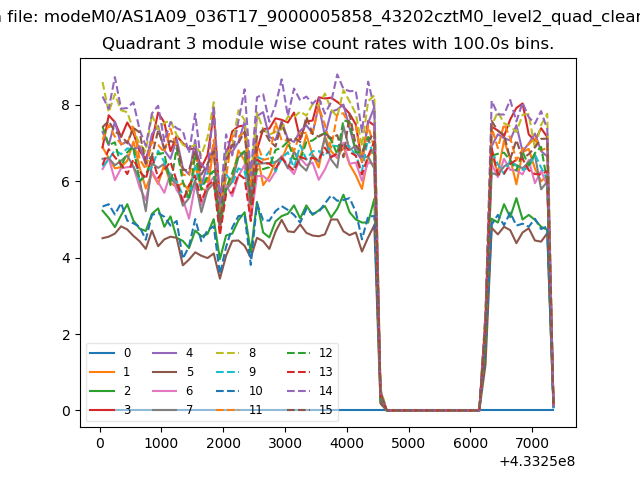 |
 |
| Parameter | Plot |
|---|---|
| CZT HV Monitor | 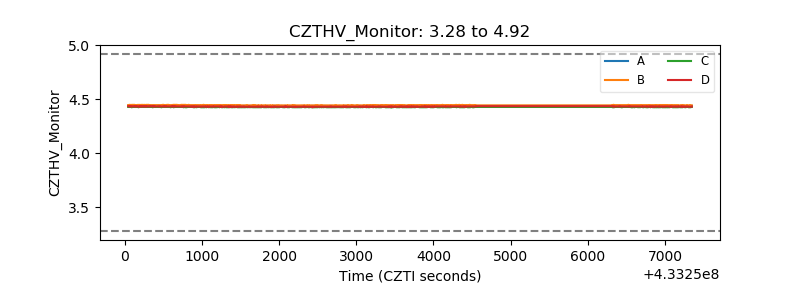 |
| D_VDD | 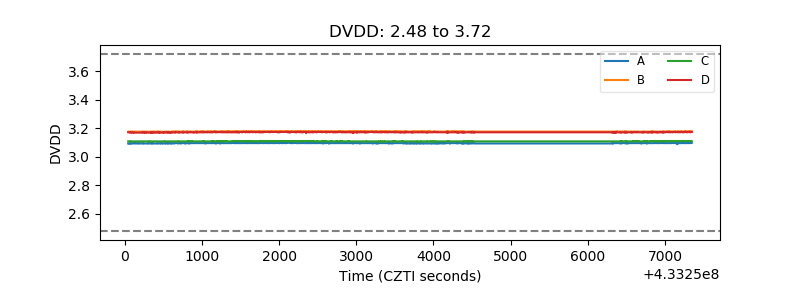 |
| Temperature 1 | 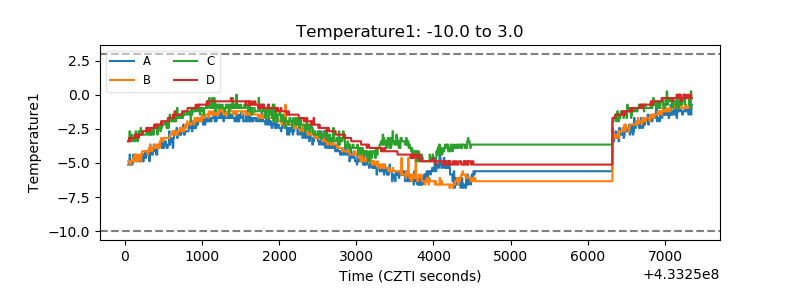 |
| Veto HV Monitor |  |
| Veto LLD | 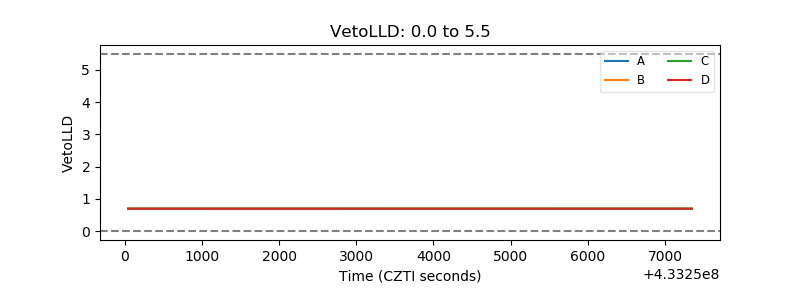 |
| Alpha Counter |  |
| _CPM_Rate | 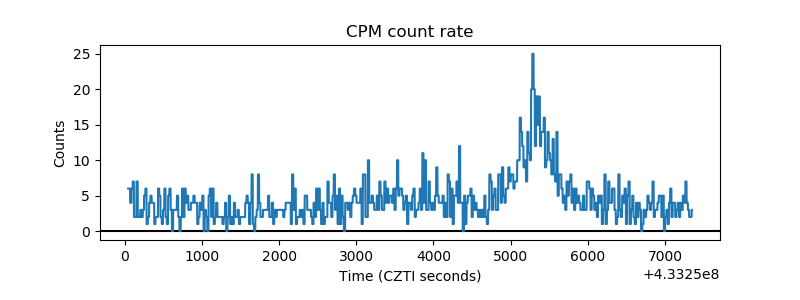 |
| CZT Counter | 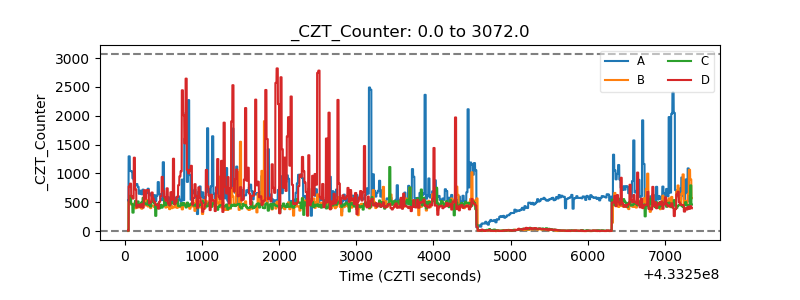 |
| +2.5 Volts monitor | 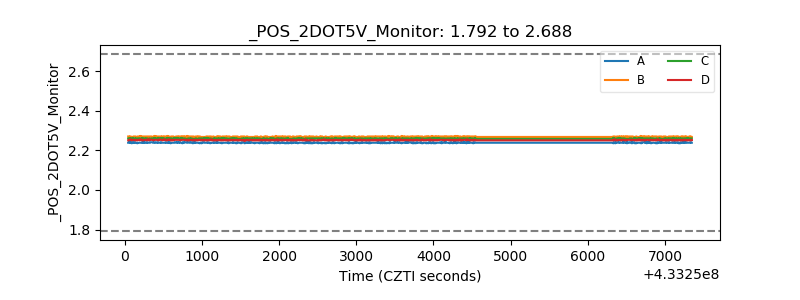 |
| +5 Volts monitor | 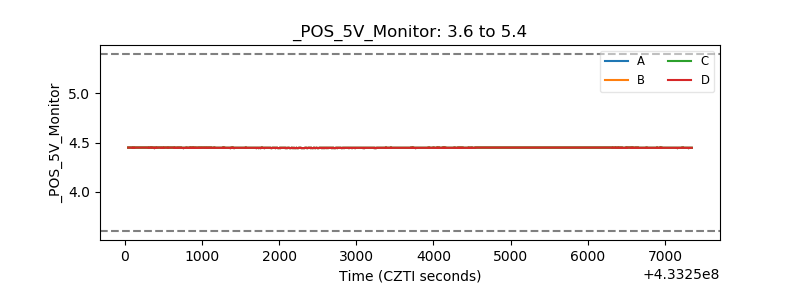 |
| _ROLL_ROT | 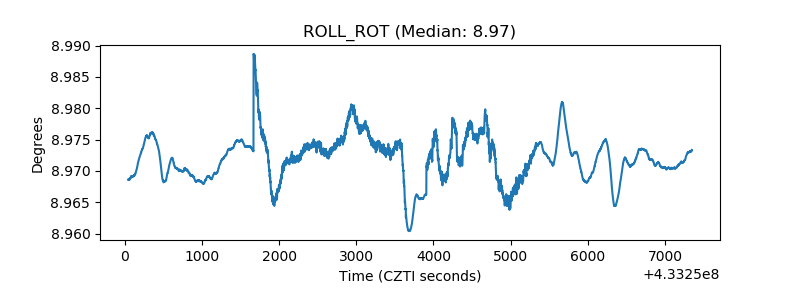 |
| _Roll_DEC | 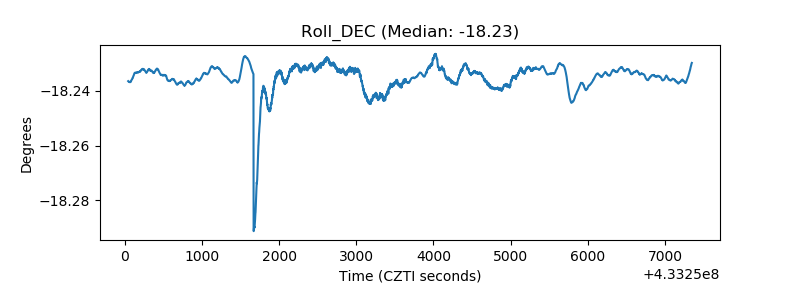 |
| _Roll_RA | 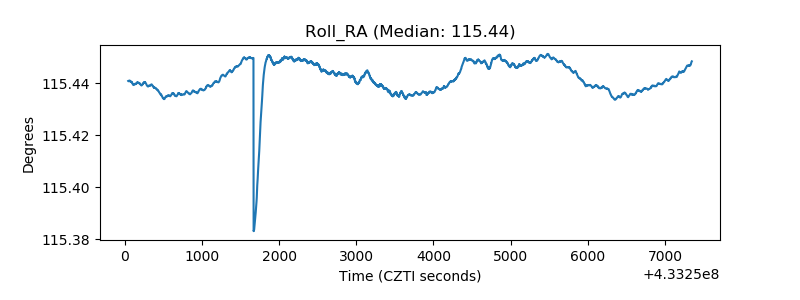 |
| Veto Counter | 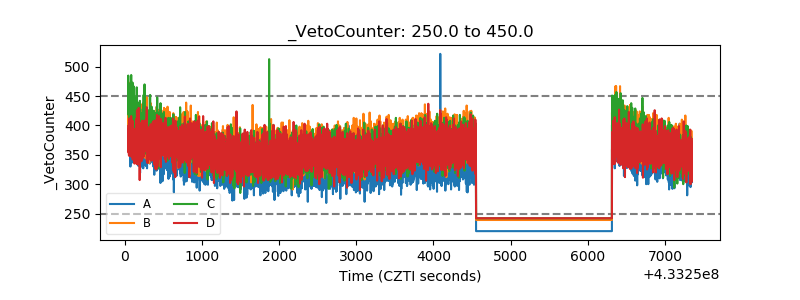 |