| Param | Original file | Final file |
|---|---|---|
| Filename | modeM0/AS1A09_036T17_9000005858_43210cztM0_level2.fits | modeM0/AS1A09_036T17_9000005858_43210cztM0_level2_quad_clean.evt |
| Size (bytes) | 328,616,640 | 90,221,760 |
| Size | 313.4 MB | 86.0 MB |
| Events in quadrant A | 3,780,562 | 587,663 |
| Events in quadrant B | 2,513,668 | 626,904 |
| Events in quadrant C | 2,569,681 | 592,500 |
| Events in quadrant D | 2,875,465 | 542,885 |
| Mode M0 | |||
|---|---|---|---|
| Quadrant | BADHDUFLAG | Total packets | Discarded packets |
| A | 0 | 14726 | 2 |
| B | 0 | 11189 | 2 |
| C | 0 | 11025 | 2 |
| D | 0 | 12451 | 2 |
| Mode SS | |||
|---|---|---|---|
| Quadrant | BADHDUFLAG | Total packets | Discarded packets |
| A | 0 | 112 | 0 |
| B | 0 | 112 | 0 |
| C | 0 | 112 | 0 |
| D | 0 | 112 | 0 |
| Mode M9 | |||
|---|---|---|---|
| Quadrant | BADHDUFLAG | Total packets | Discarded packets |
| A | 0 | 27 | 0 |
| B | 0 | 28 | 0 |
| C | 0 | 28 | 0 |
| D | 0 | 28 | 0 |
| Quadrant | Total seconds | Saturated seconds | Saturation percentage |
|---|---|---|---|
| A | 5453 | 251 | 4.602971% |
| B | 5453 | 11 | 0.201724% |
| C | 5453 | 8 | 0.146708% |
| D | 5452 | 66 | 1.210565% |
Noise dominated data is calculated using 1-second bins in cleaned event files. If a bin has >2000 counts, and if more than 50% of those come from <1% of pixels, then it is considered to be noise-dominated and hence unusable.
| Quadrant | # 1 sec bins | Bins with >0 counts | Bins with >2000 counts | High rate bins dominated by noise | Noise dominated (total time) | Noise dominated (detector-on time) | Marked lightcurve |
|---|---|---|---|---|---|---|---|
| A | 7186 | 5454 | 204 | 204 | 2.84% | 3.74% | 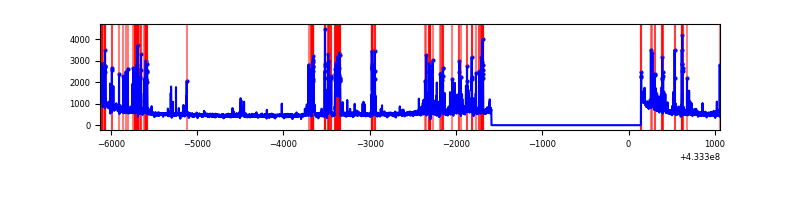 |
| B | 7186 | 5454 | 2 | 2 | 0.03% | 0.04% | 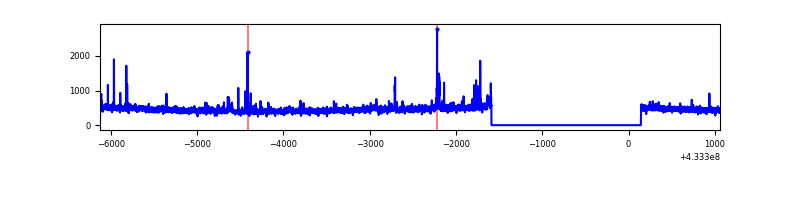 |
| C | 7186 | 5454 | 1 | 1 | 0.01% | 0.02% | 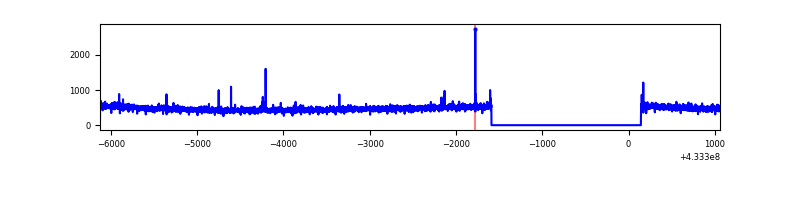 |
| D | 7185 | 5453 | 55 | 55 | 0.77% | 1.01% | 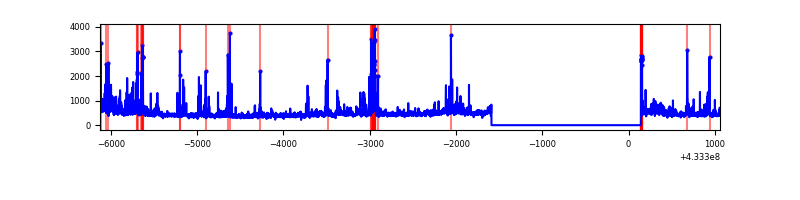 |
Top three noisy pixels from each quadrant. If the there are fewer than three noisy pixels in the level2.evt file, extra rows are filled as -1
| Pixel properties | Quadrant properties | ||||||
|---|---|---|---|---|---|---|---|
| Quadrant | DetID | PixID | Counts | Sigma | Mean | Median | Sigma |
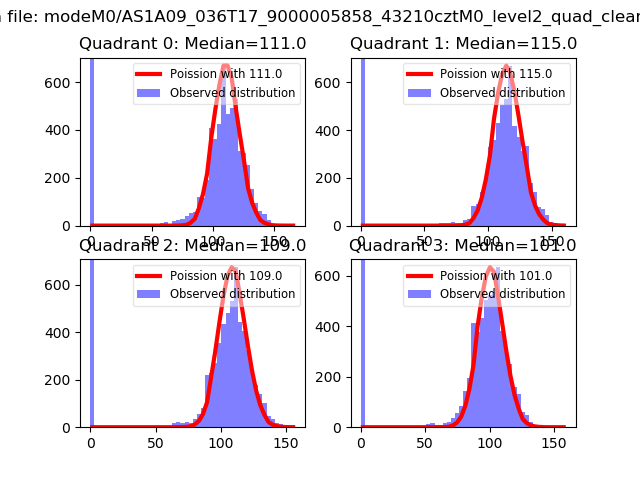
| A | 10 | 83 | 574795 | 4700.38 | 592 | 580 | 122.2 |
| A | 15 | 237 | 573138 | 4686.81 | 592 | 580 | 122.2 |
| A | 13 | 248 | 161823 | 1319.89 | 592 | 580 | 122.2 |
| B | 0 | 229 | 80032 | 676.99 | 603 | 585 | 117.4 |
| B | 0 | 186 | 28593 | 238.66 | 603 | 585 | 117.4 |
| B | 12 | 111 | 14875 | 121.77 | 603 | 585 | 117.4 |
| C | 15 | 214 | 227740 | 1627.31 | 593 | 597 | 139.6 |
| C | 14 | 254 | 15570 | 107.27 | 593 | 597 | 139.6 |
| C | 4 | 254 | 11689 | 79.47 | 593 | 597 | 139.6 |
| D | 12 | 16 | 174732 | 1206.11 | 588 | 572 | 144.4 |
| D | 1 | 52 | 173593 | 1198.22 | 588 | 572 | 144.4 |
| D | 12 | 6 | 91175 | 627.45 | 588 | 572 | 144.4 |
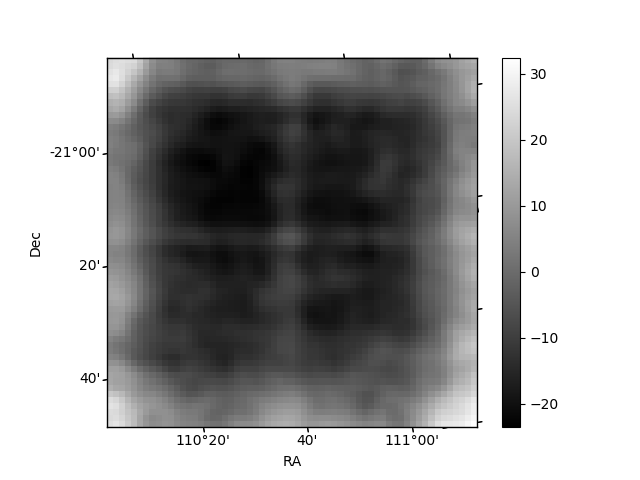
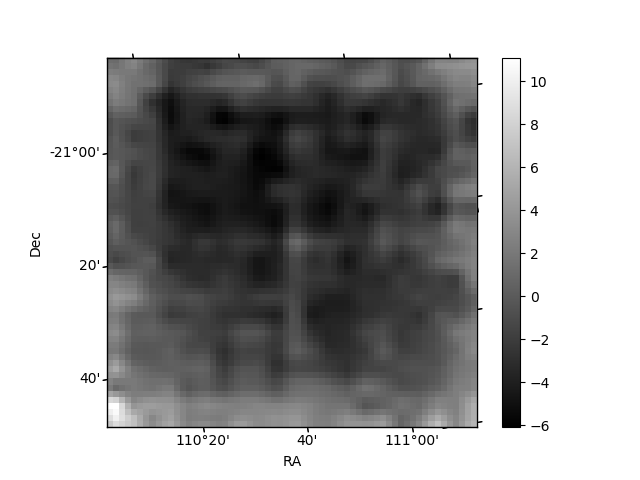
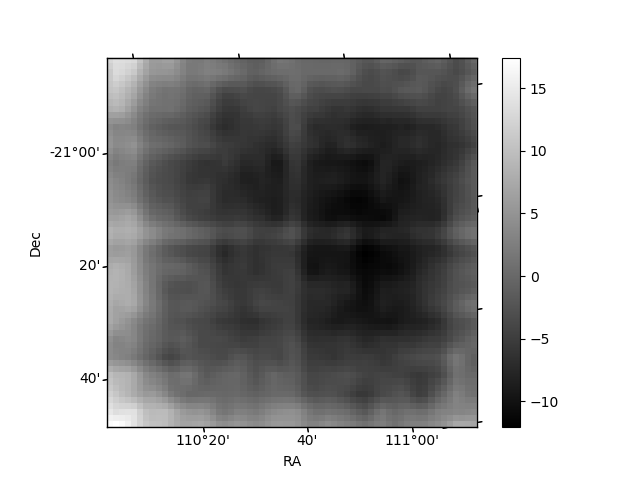
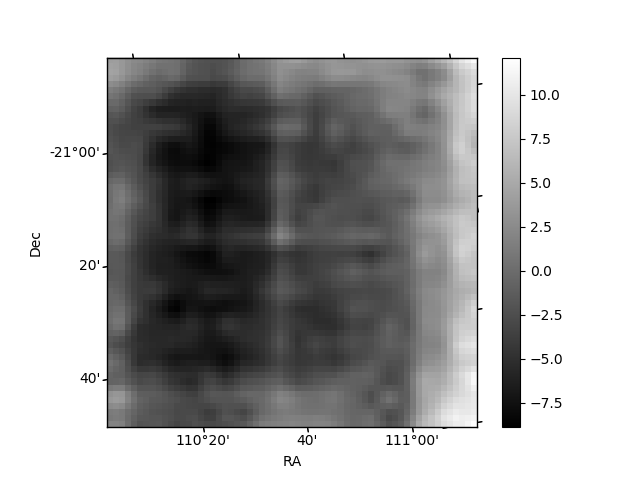
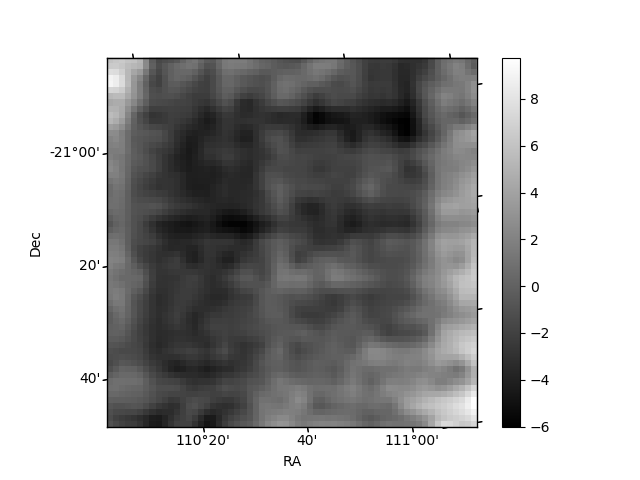
Histogram calculated using DETX and DETY for each event in the final _common_clean file
| Quadrant A | 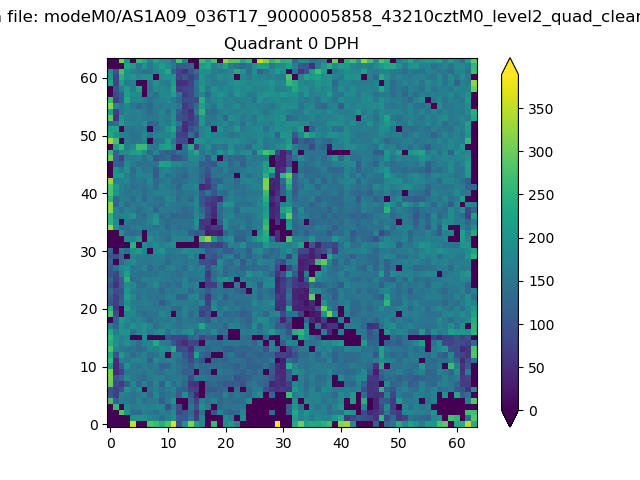 |
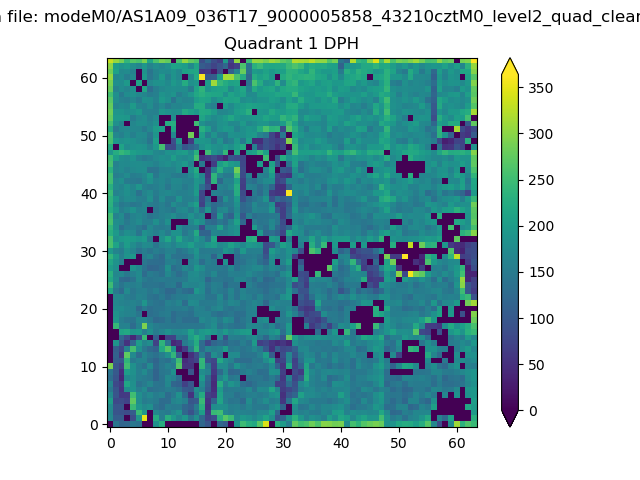 |
Quadrant B |
|---|---|---|---|
| Quadrant D | 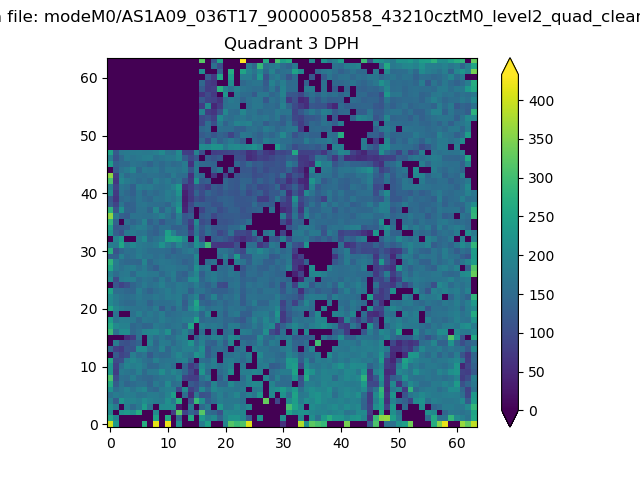 |
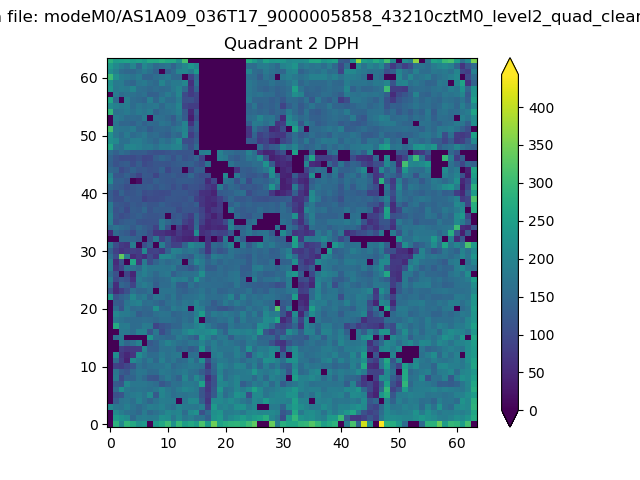 |
Quadrant C |
| Plot type | Count rate plots | Images |
|---|---|---|
| Comparison with Poisson distribution Blue bars denote a histogram of data divided into 1 sec bins. Red curve is a Poisson curve with rate = median count rate of data. |
 |
 |
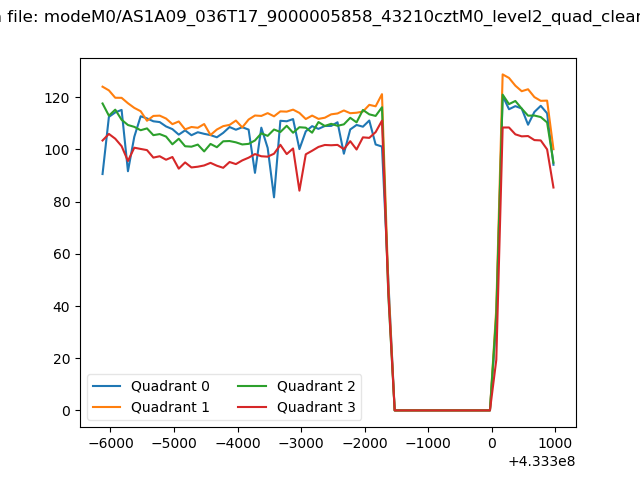
| Quadrant-wise count rates Data is divided into 100 sec bins |
 |
|
| Module-wise count rates for Quadrant A Data is divided into 100 sec bins |
 |
 |
| Module-wise count rates for Quadrant B Data is divided into 100 sec bins |
 |
 |
| Module-wise count rates for Quadrant C Data is divided into 100 sec bins |
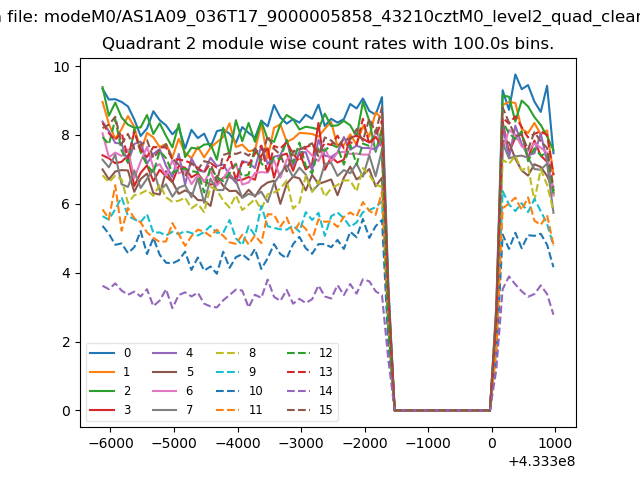 |
 |
| Module-wise count rates for Quadrant D Data is divided into 100 sec bins |
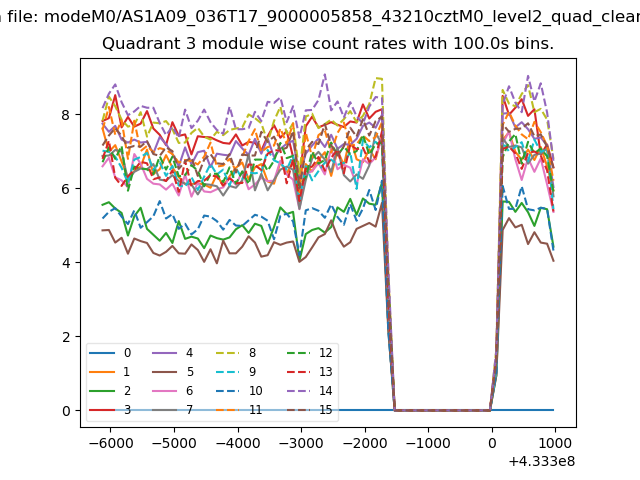 |
 |
| Parameter | Plot |
|---|---|
| CZT HV Monitor | 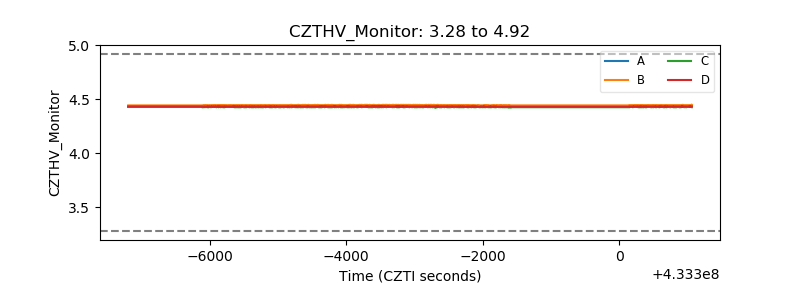 |
| D_VDD | 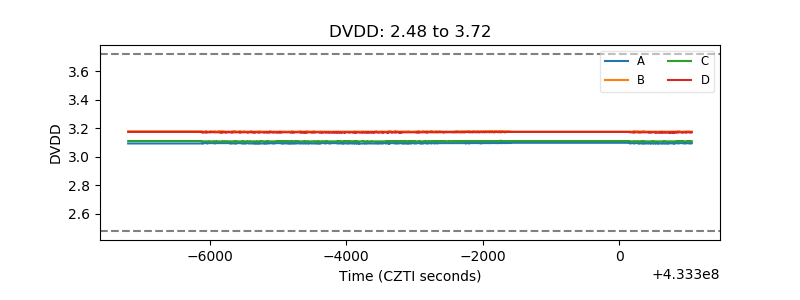 |
| Temperature 1 | 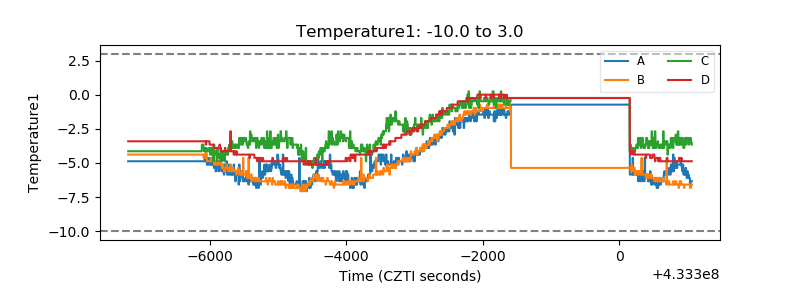 |
| Veto HV Monitor | 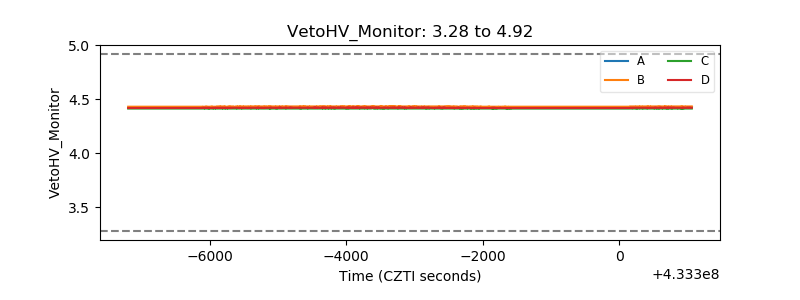 |
| Veto LLD | 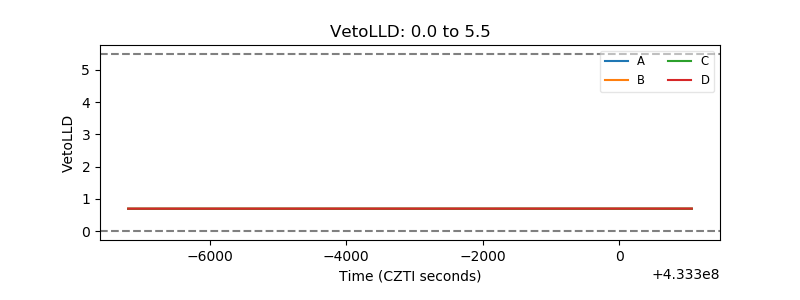 |
| Alpha Counter | 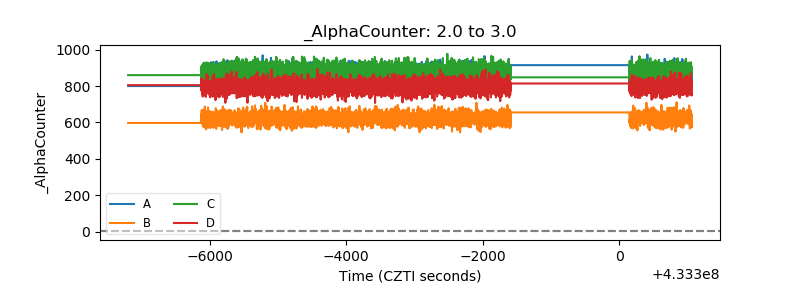 |
| _CPM_Rate | 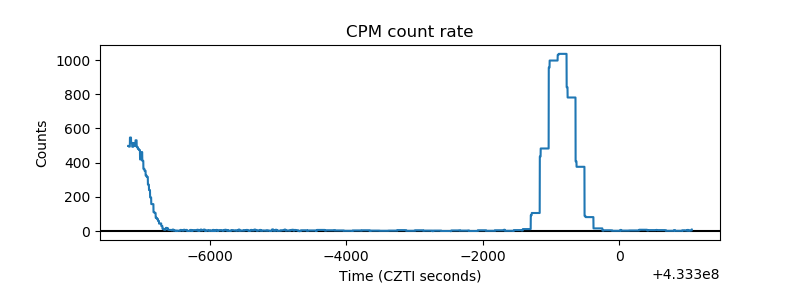 |
| CZT Counter | 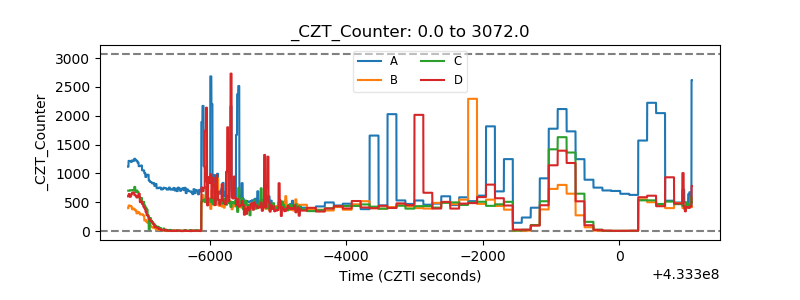 |
| +2.5 Volts monitor | 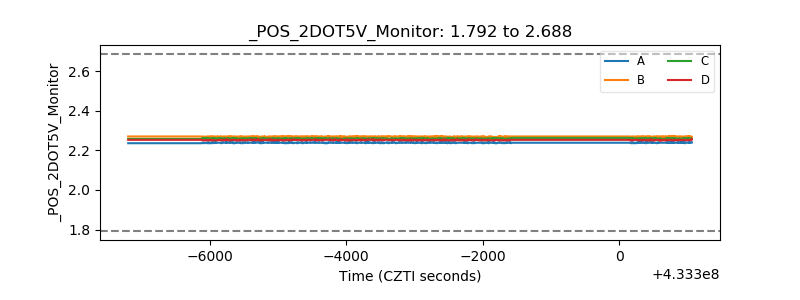 |
| +5 Volts monitor | 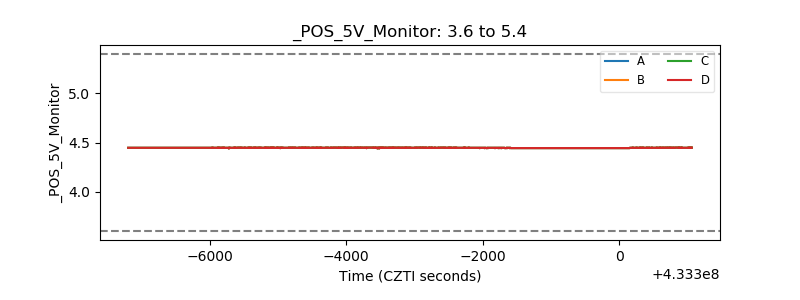 |
| _ROLL_ROT | 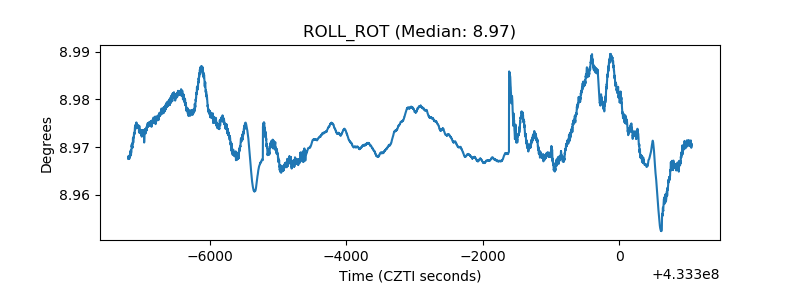 |
| _Roll_DEC | 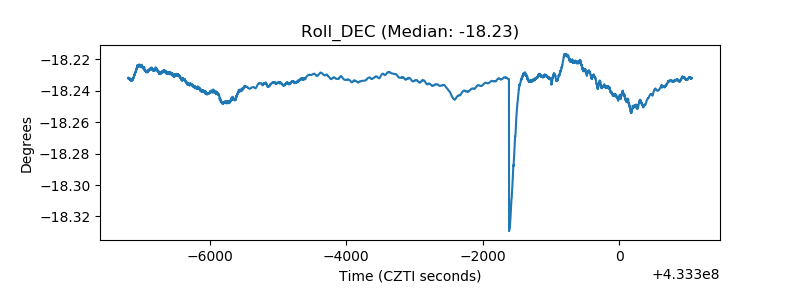 |
| _Roll_RA | 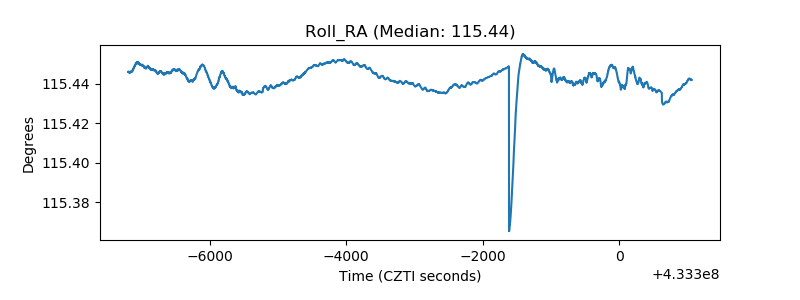 |
| Veto Counter | 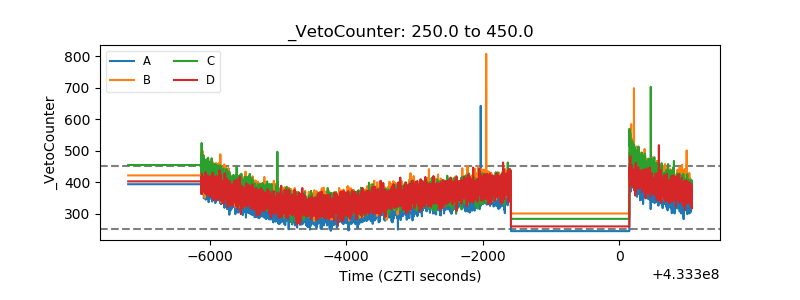 |