| Param | Original file | Final file |
|---|---|---|
| Filename | modeM0/AS1A09_036T17_9000005858_43211cztM0_level2.fits | modeM0/AS1A09_036T17_9000005858_43211cztM0_level2_quad_clean.evt |
| Size (bytes) | 316,877,760 | 87,831,360 |
| Size | 302.2 MB | 83.8 MB |
| Events in quadrant A | 3,218,733 | 581,546 |
| Events in quadrant B | 2,419,728 | 609,437 |
| Events in quadrant C | 2,509,140 | 580,698 |
| Events in quadrant D | 3,178,879 | 525,441 |
| Mode M0 | |||
|---|---|---|---|
| Quadrant | BADHDUFLAG | Total packets | Discarded packets |
| A | 0 | 12835 | 2 |
| B | 0 | 10739 | 2 |
| C | 0 | 10554 | 2 |
| D | 0 | 12958 | 2 |
| Mode SS | |||
|---|---|---|---|
| Quadrant | BADHDUFLAG | Total packets | Discarded packets |
| A | 0 | 104 | 0 |
| B | 0 | 104 | 0 |
| C | 0 | 104 | 0 |
| D | 0 | 104 | 0 |
| Mode M9 | |||
|---|---|---|---|
| Quadrant | BADHDUFLAG | Total packets | Discarded packets |
| A | 0 | 29 | 0 |
| B | 0 | 30 | 0 |
| C | 0 | 30 | 0 |
| D | 0 | 30 | 0 |
| Quadrant | Total seconds | Saturated seconds | Saturation percentage |
|---|---|---|---|
| A | 5177 | 102 | 1.970253% |
| B | 5177 | 31 | 0.598802% |
| C | 5177 | 6 | 0.115897% |
| D | 5177 | 125 | 2.414526% |
Noise dominated data is calculated using 1-second bins in cleaned event files. If a bin has >2000 counts, and if more than 50% of those come from <1% of pixels, then it is considered to be noise-dominated and hence unusable.
| Quadrant | # 1 sec bins | Bins with >0 counts | Bins with >2000 counts | High rate bins dominated by noise | Noise dominated (total time) | Noise dominated (detector-on time) | Marked lightcurve |
|---|---|---|---|---|---|---|---|
| A | 7061 | 5178 | 65 | 65 | 0.92% | 1.26% | 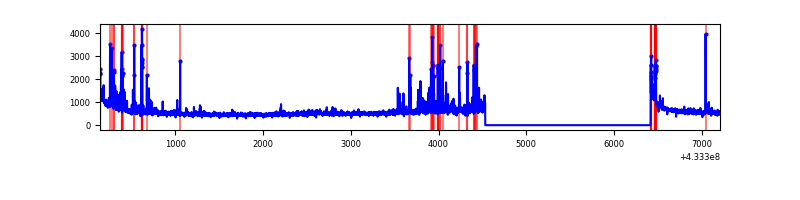 |
| B | 7061 | 5178 | 13 | 13 | 0.18% | 0.25% | 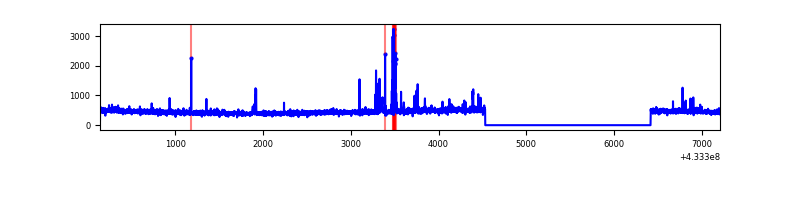 |
| C | 7061 | 5178 | 0 | 0 | 0.00% | 0.00% | 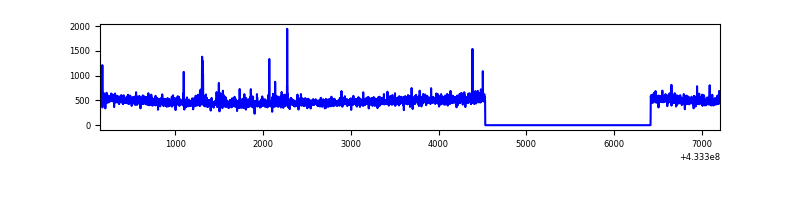 |
| D | 7061 | 5178 | 121 | 121 | 1.71% | 2.34% | 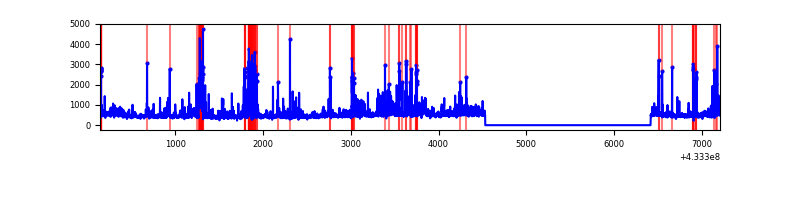 |
Top three noisy pixels from each quadrant. If the there are fewer than three noisy pixels in the level2.evt file, extra rows are filled as -1
| Pixel properties | Quadrant properties | ||||||
|---|---|---|---|---|---|---|---|
| Quadrant | DetID | PixID | Counts | Sigma | Mean | Median | Sigma |
| A | 10 | 83 | 562542 | 4778.27 | 571 | 560 | 117.6 |
| A | 15 | 237 | 286803 | 2433.79 | 571 | 560 | 117.6 |
| A | 12 | 189 | 90945 | 768.5 | 571 | 560 | 117.6 |
| B | 5 | 172 | 85516 | 753.83 | 579 | 563 | 112.7 |
| B | 0 | 229 | 25664 | 222.73 | 579 | 563 | 112.7 |
| B | 7 | 202 | 14782 | 126.17 | 579 | 563 | 112.7 |
| C | 15 | 214 | 217117 | 1613.93 | 572 | 576 | 134.2 |
| C | 14 | 254 | 30541 | 223.34 | 572 | 576 | 134.2 |
| C | 4 | 254 | 25058 | 182.47 | 572 | 576 | 134.2 |
| D | 1 | 52 | 642356 | 4614.0 | 563 | 548 | 139.1 |
| D | 5 | 222 | 146355 | 1048.22 | 563 | 548 | 139.1 |
| D | 12 | 6 | 86582 | 618.5 | 563 | 548 | 139.1 |
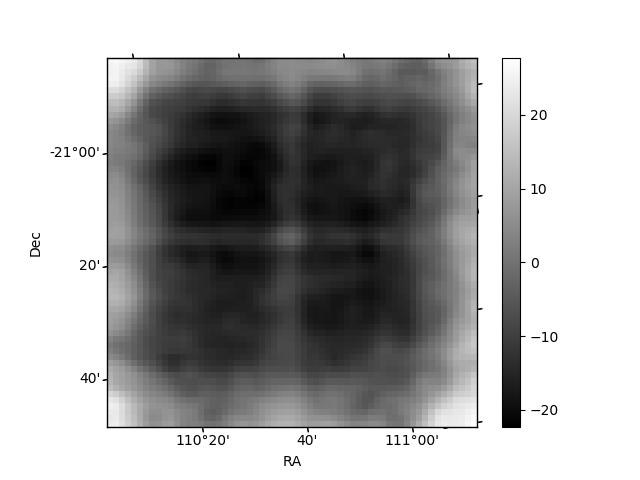
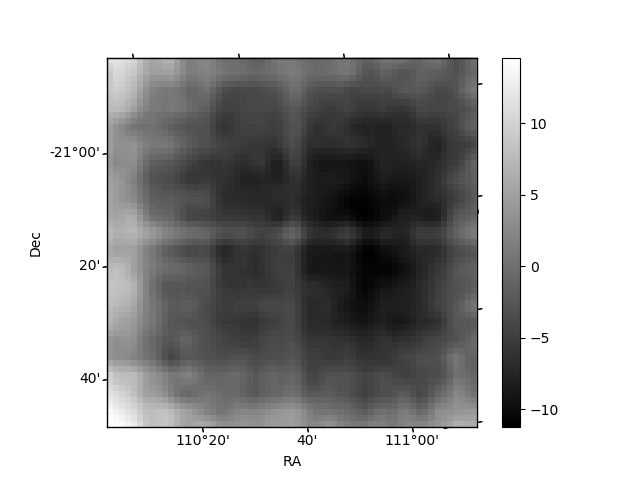
Histogram calculated using DETX and DETY for each event in the final _common_clean file
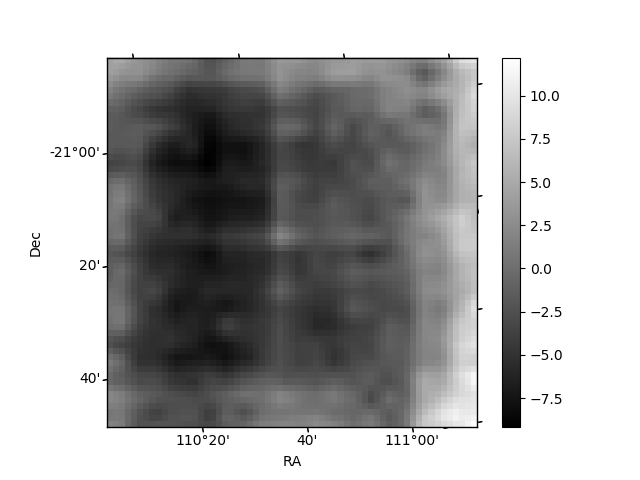
| Quadrant A | 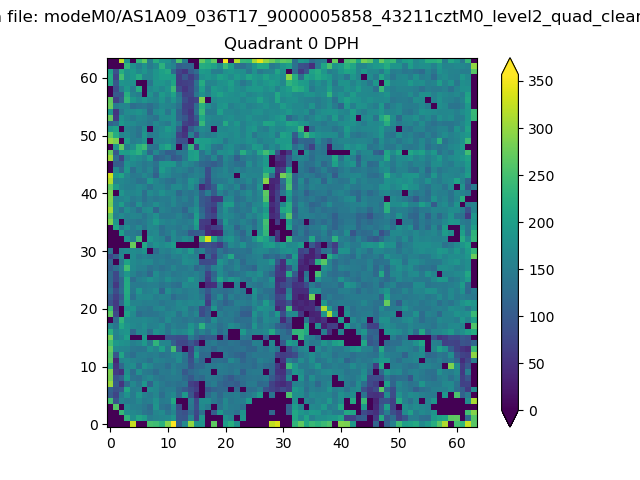 |
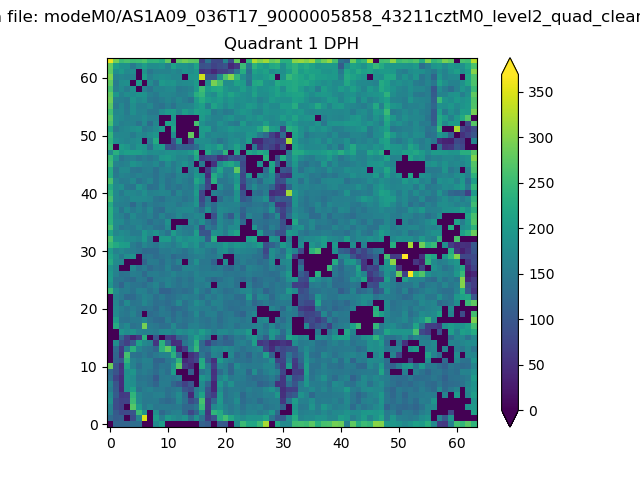 |
Quadrant B |
|---|---|---|---|
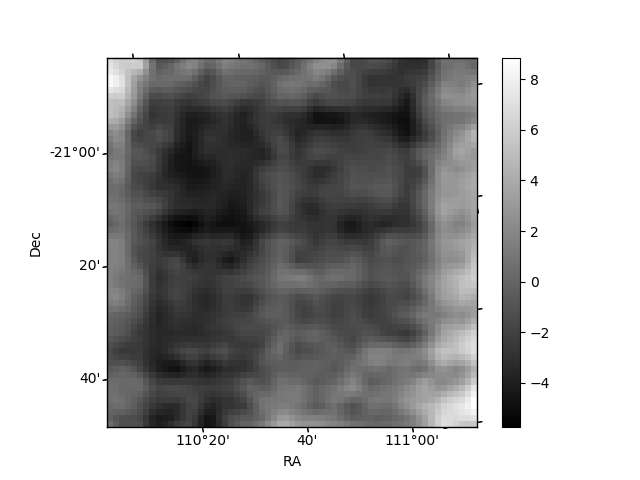
| Quadrant D | 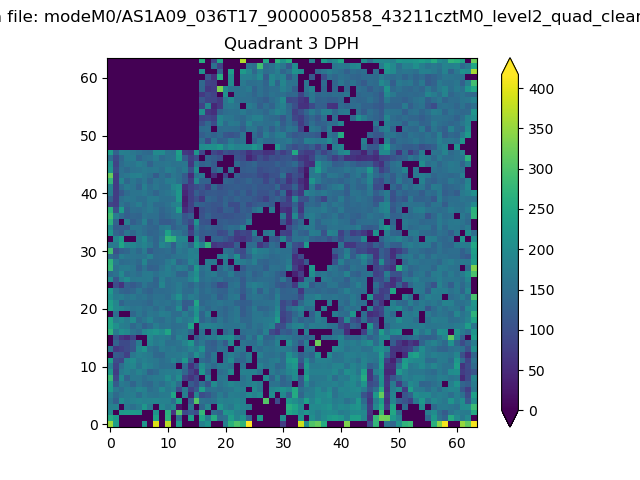 |
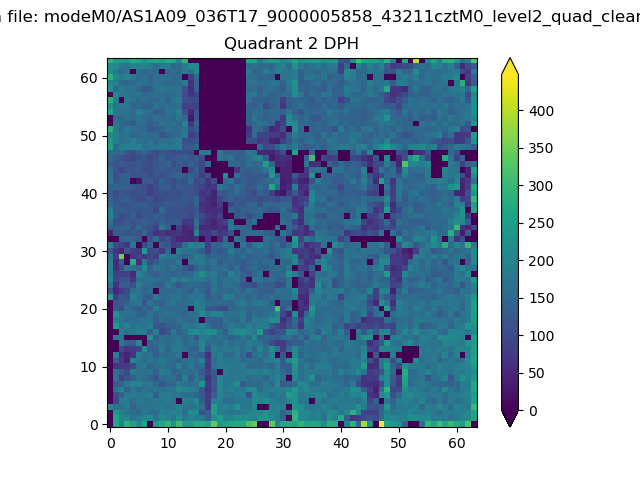 |
Quadrant C |
| Plot type | Count rate plots | Images |
|---|---|---|
| Comparison with Poisson distribution Blue bars denote a histogram of data divided into 1 sec bins. Red curve is a Poisson curve with rate = median count rate of data. |
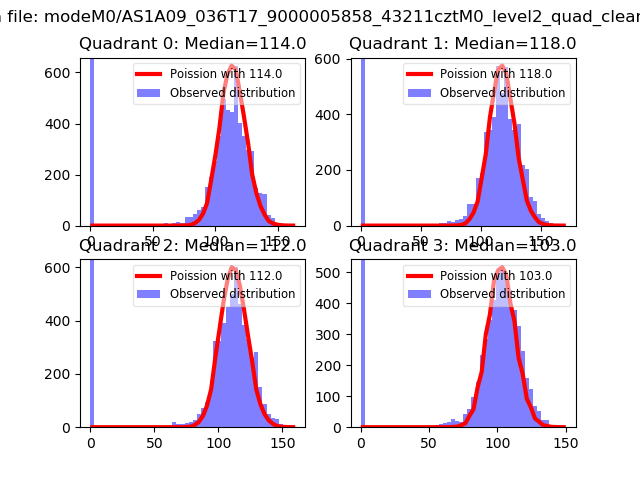 |
 |
| Quadrant-wise count rates Data is divided into 100 sec bins |
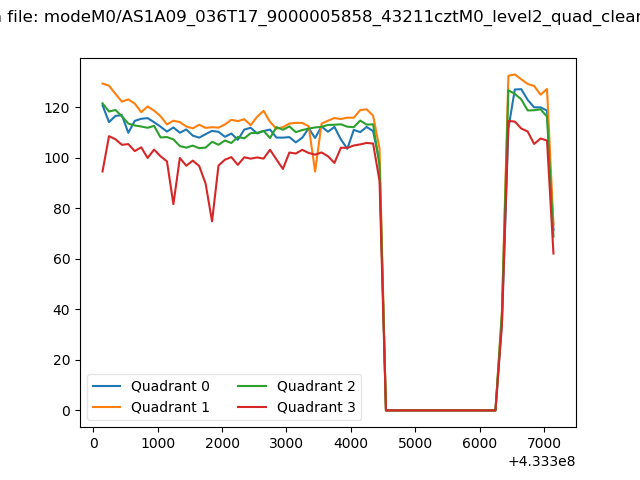 |
|
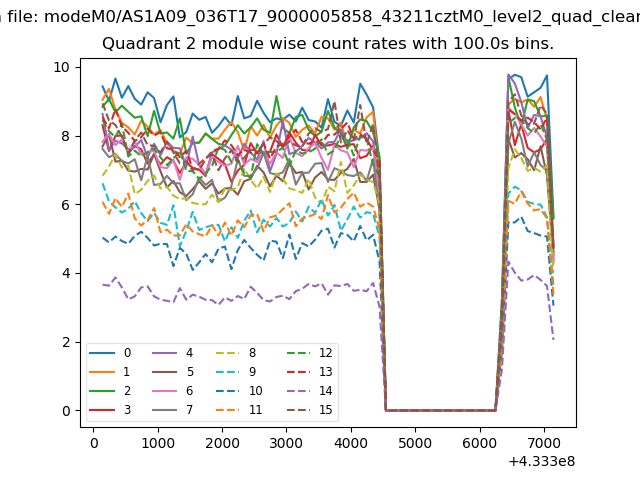
| Module-wise count rates for Quadrant A Data is divided into 100 sec bins |
 |
 |
| Module-wise count rates for Quadrant B Data is divided into 100 sec bins |
 |
 |
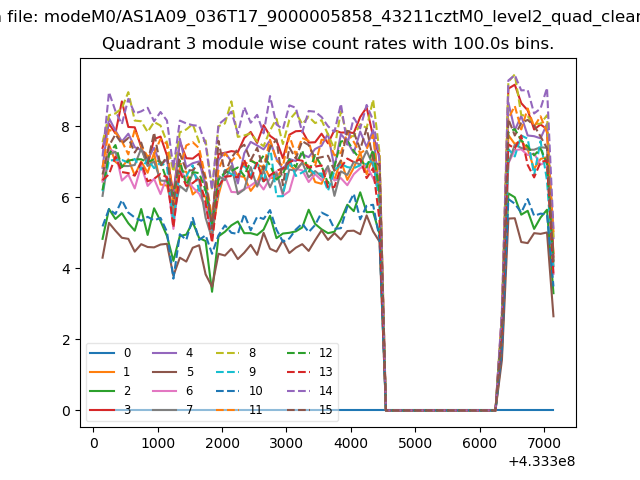
| Module-wise count rates for Quadrant C Data is divided into 100 sec bins |
 |
 |
| Module-wise count rates for Quadrant D Data is divided into 100 sec bins |
 |
 |
| Parameter | Plot |
|---|---|
| CZT HV Monitor | 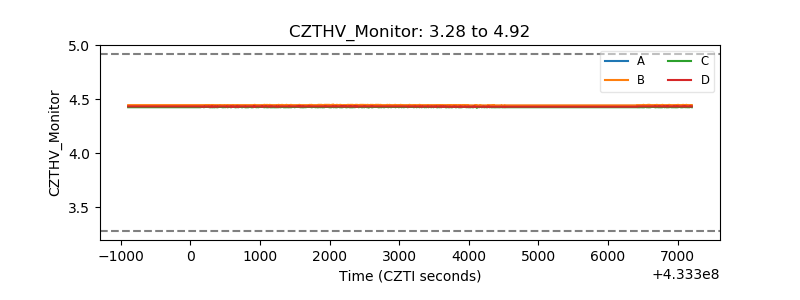 |
| D_VDD | 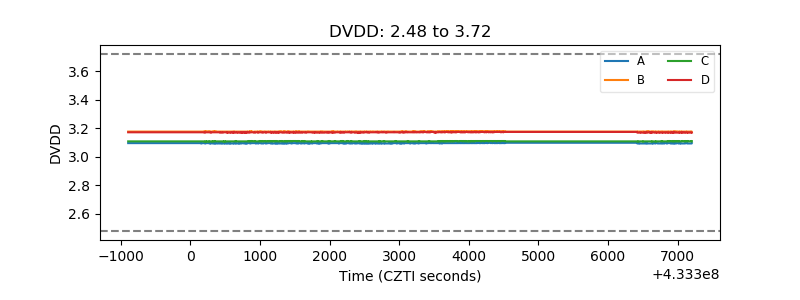 |
| Temperature 1 | 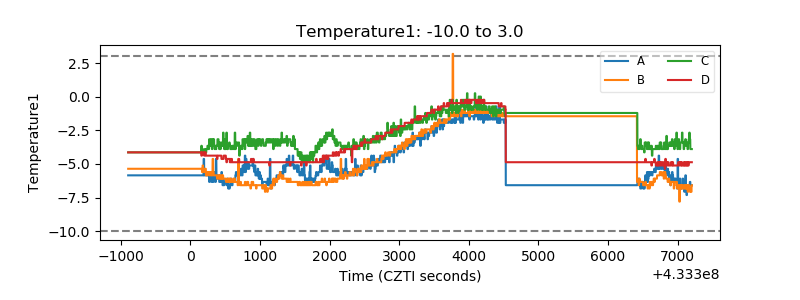 |
| Veto HV Monitor | 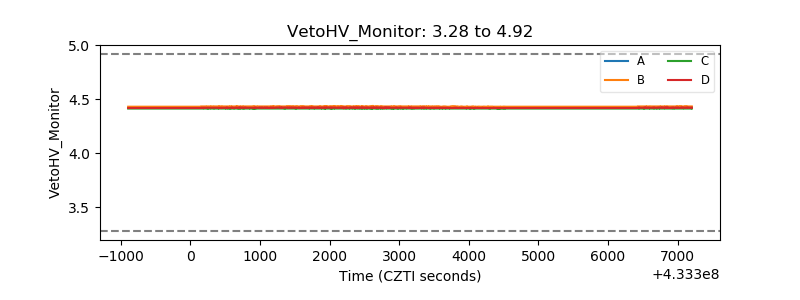 |
| Veto LLD | 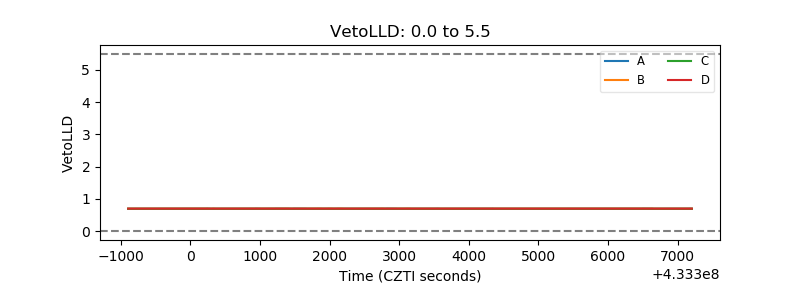 |
| Alpha Counter | 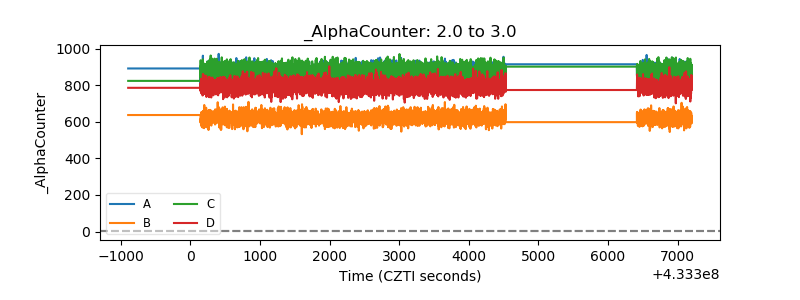 |
| _CPM_Rate | 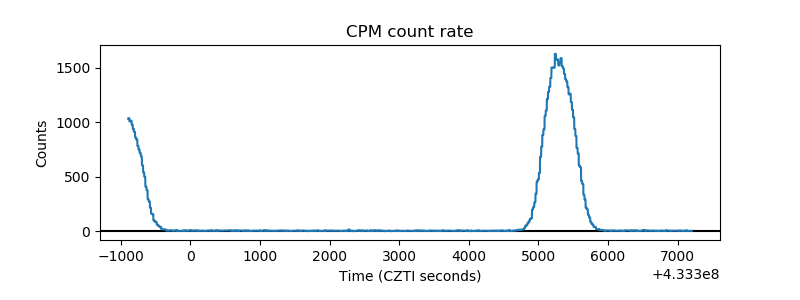 |
| CZT Counter | 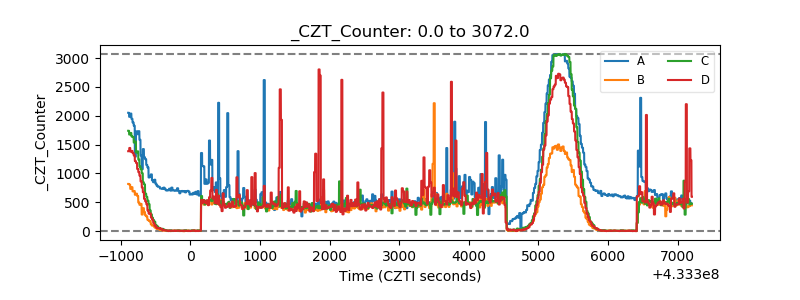 |
| +2.5 Volts monitor | 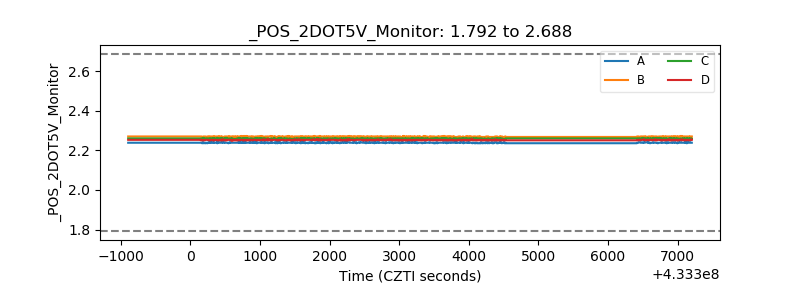 |
| +5 Volts monitor | 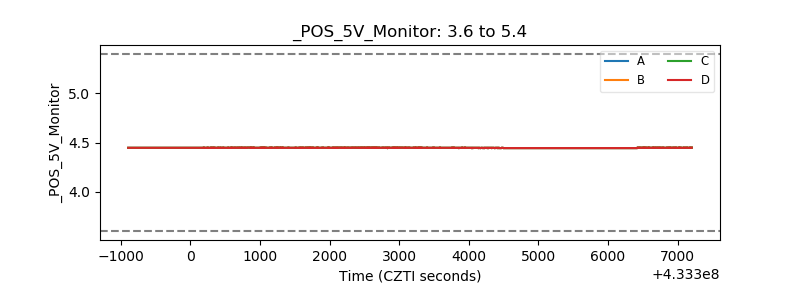 |
| _ROLL_ROT | 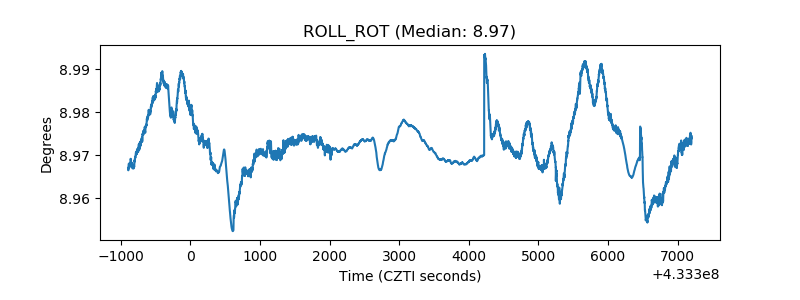 |
| _Roll_DEC | 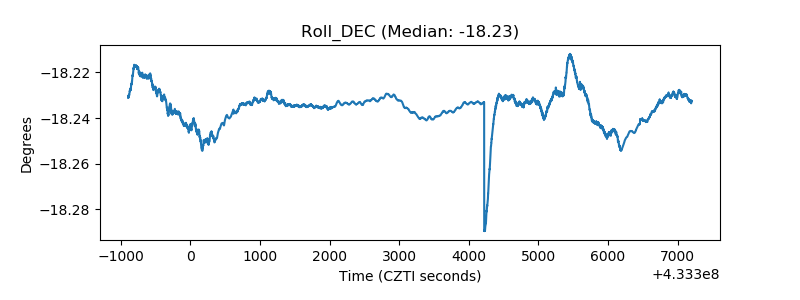 |
| _Roll_RA | 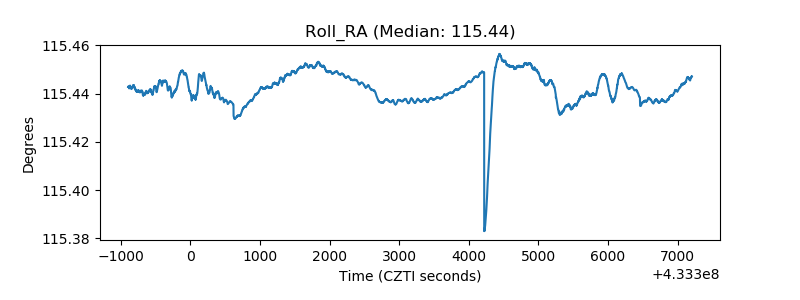 |
| Veto Counter | 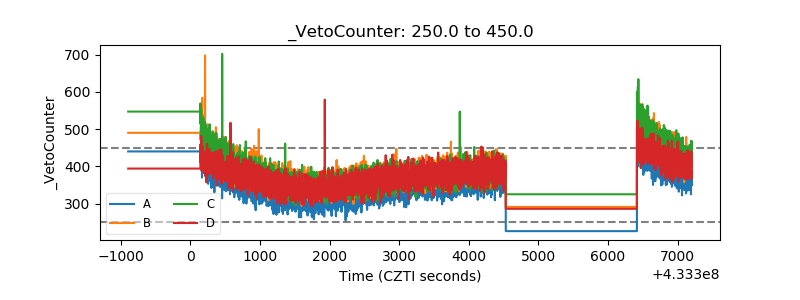 |