| Param | Original file | Final file |
|---|---|---|
| Filename | modeM0/AS1A09_036T17_9000005858_43212cztM0_level2.fits | modeM0/AS1A09_036T17_9000005858_43212cztM0_level2_quad_clean.evt |
| Size (bytes) | 350,133,120 | 88,015,680 |
| Size | 333.9 MB | 83.9 MB |
| Events in quadrant A | 3,942,708 | 570,971 |
| Events in quadrant B | 2,649,139 | 615,269 |
| Events in quadrant C | 2,500,567 | 593,516 |
| Events in quadrant D | 3,469,844 | 526,805 |
| Mode M0 | |||
|---|---|---|---|
| Quadrant | BADHDUFLAG | Total packets | Discarded packets |
| A | 0 | 15135 | 2 |
| B | 0 | 11439 | 2 |
| C | 0 | 10446 | 2 |
| D | 0 | 13751 | 2 |
| Mode SS | |||
|---|---|---|---|
| Quadrant | BADHDUFLAG | Total packets | Discarded packets |
| A | 0 | 104 | 0 |
| B | 0 | 104 | 0 |
| C | 0 | 104 | 0 |
| D | 0 | 104 | 0 |
| Mode M9 | |||
|---|---|---|---|
| Quadrant | BADHDUFLAG | Total packets | Discarded packets |
| A | 0 | 31 | 0 |
| B | 0 | 32 | 0 |
| C | 0 | 32 | 0 |
| D | 0 | 32 | 0 |
| Quadrant | Total seconds | Saturated seconds | Saturation percentage |
|---|---|---|---|
| A | 5120 | 294 | 5.742188% |
| B | 5120 | 90 | 1.757812% |
| C | 5120 | 9 | 0.175781% |
| D | 5120 | 217 | 4.238281% |
Noise dominated data is calculated using 1-second bins in cleaned event files. If a bin has >2000 counts, and if more than 50% of those come from <1% of pixels, then it is considered to be noise-dominated and hence unusable.
| Quadrant | # 1 sec bins | Bins with >0 counts | Bins with >2000 counts | High rate bins dominated by noise | Noise dominated (total time) | Noise dominated (detector-on time) | Marked lightcurve |
|---|---|---|---|---|---|---|---|
| A | 7092 | 5121 | 266 | 266 | 3.75% | 5.19% | 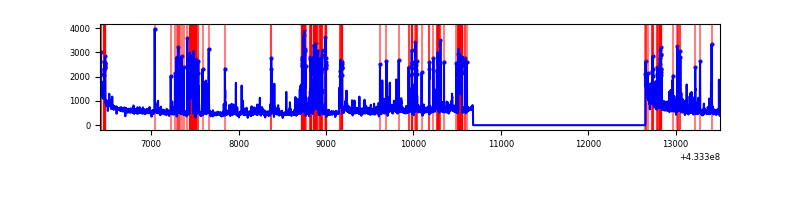 |
| B | 7092 | 5121 | 48 | 48 | 0.68% | 0.94% | 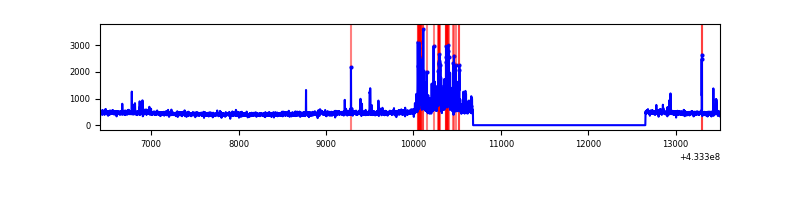 |
| C | 7092 | 5121 | 2 | 2 | 0.03% | 0.04% | 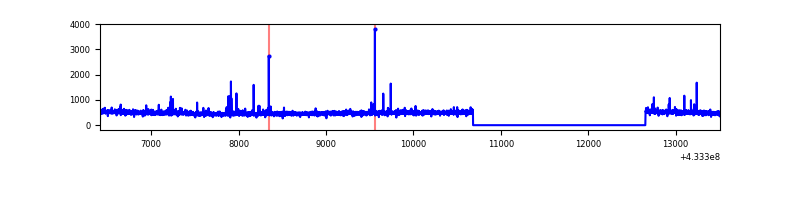 |
| D | 7092 | 5121 | 145 | 145 | 2.04% | 2.83% | 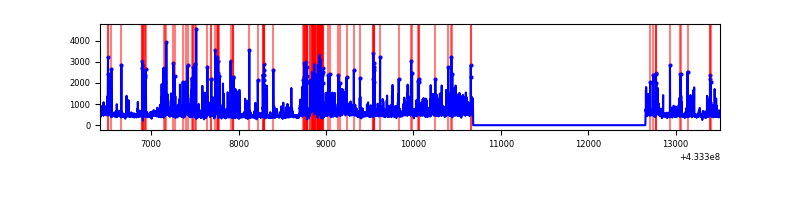 |
Top three noisy pixels from each quadrant. If the there are fewer than three noisy pixels in the level2.evt file, extra rows are filled as -1
| Pixel properties | Quadrant properties | ||||||
|---|---|---|---|---|---|---|---|
| Quadrant | DetID | PixID | Counts | Sigma | Mean | Median | Sigma |
| A | 15 | 237 | 568804 | 4924.97 | 561 | 549 | 115.4 |
| A | 10 | 83 | 544422 | 4713.66 | 561 | 549 | 115.4 |
| A | 13 | 248 | 534084 | 4624.06 | 561 | 549 | 115.4 |
| B | 0 | 186 | 316714 | 2858.73 | 572 | 557 | 110.6 |
| B | 5 | 255 | 32169 | 285.84 | 572 | 557 | 110.6 |
| B | 0 | 229 | 21883 | 192.83 | 572 | 557 | 110.6 |
| C | 15 | 214 | 213355 | 1576.34 | 572 | 576 | 135.0 |
| C | 14 | 254 | 50785 | 371.97 | 572 | 576 | 135.0 |
| C | 4 | 254 | 7547 | 51.64 | 572 | 576 | 135.0 |
| D | 1 | 52 | 1192169 | 8685.73 | 555 | 538 | 137.2 |
| D | 12 | 6 | 88922 | 644.22 | 555 | 538 | 137.2 |
| D | 5 | 157 | 22358 | 159.04 | 555 | 538 | 137.2 |
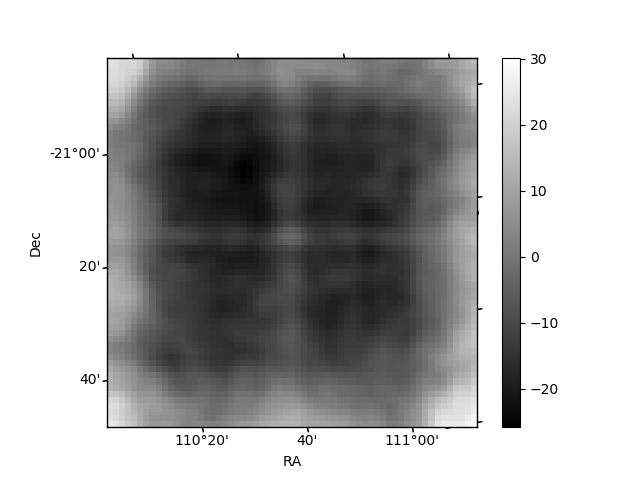
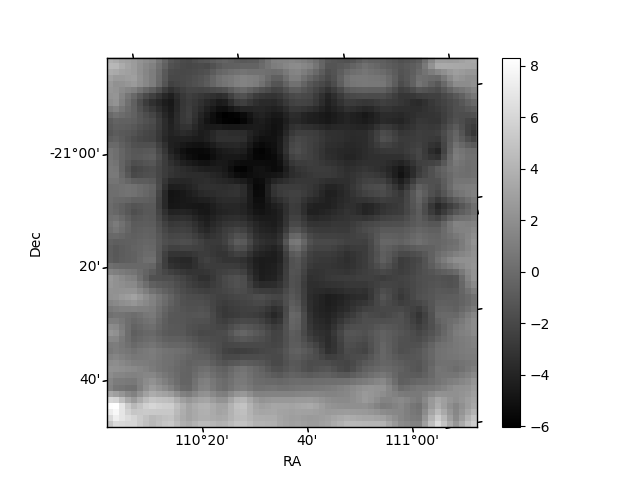
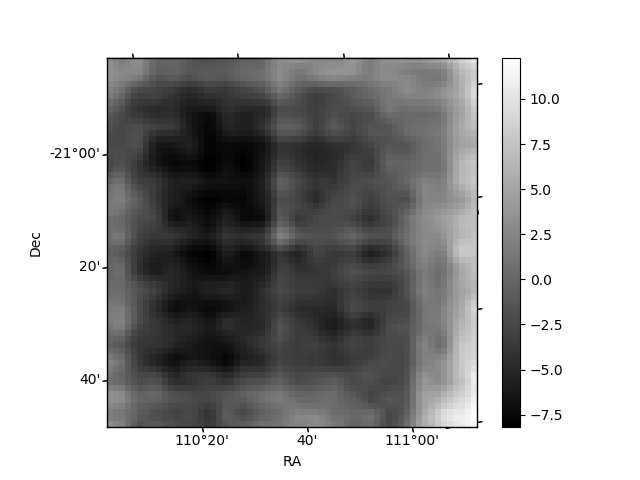
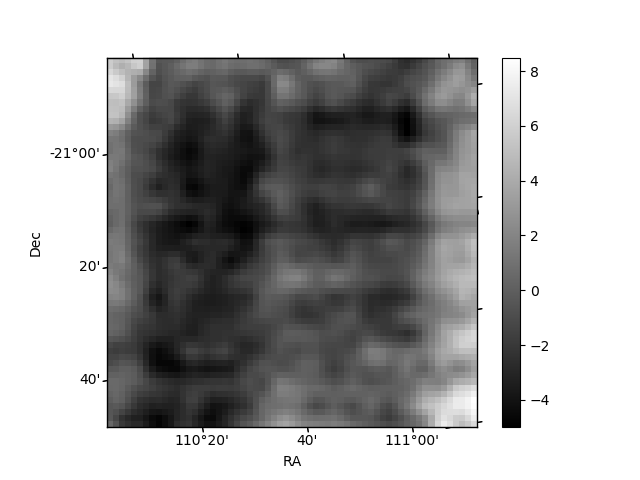
Histogram calculated using DETX and DETY for each event in the final _common_clean file
| Quadrant A | 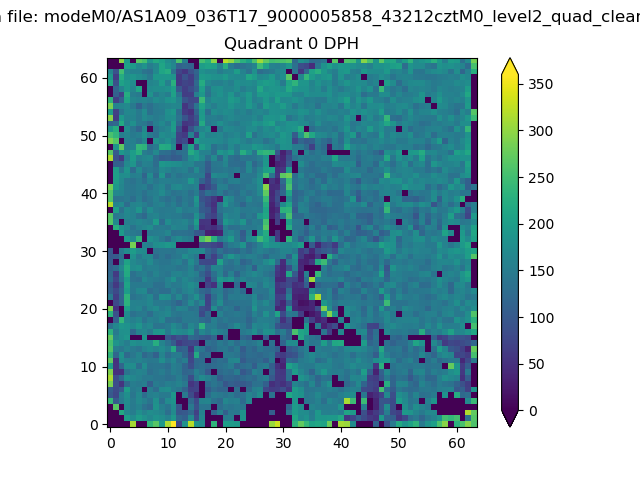 |
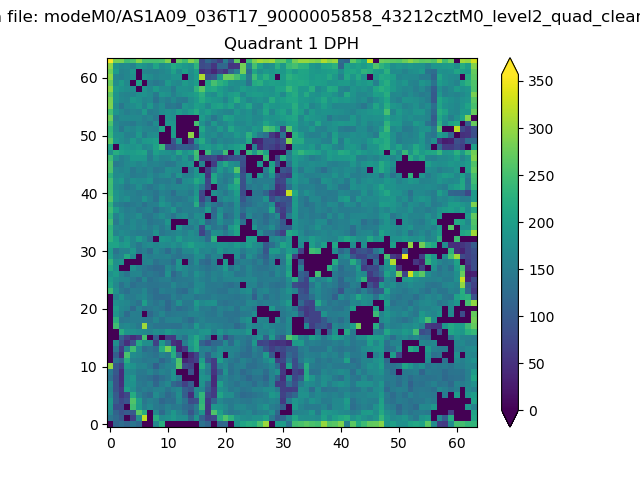 |
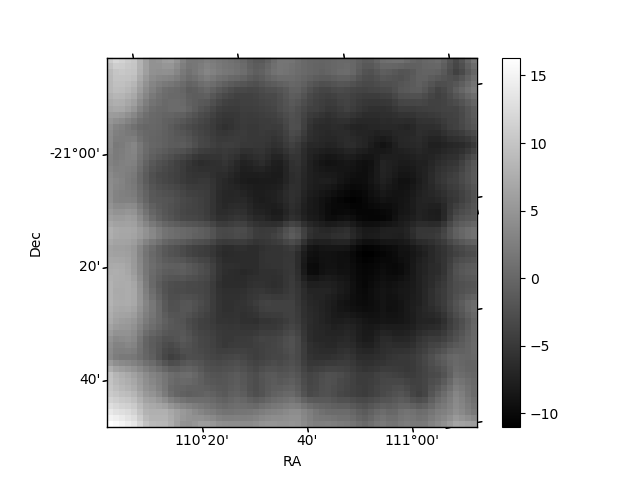
Quadrant B |
|---|---|---|---|
| Quadrant D | 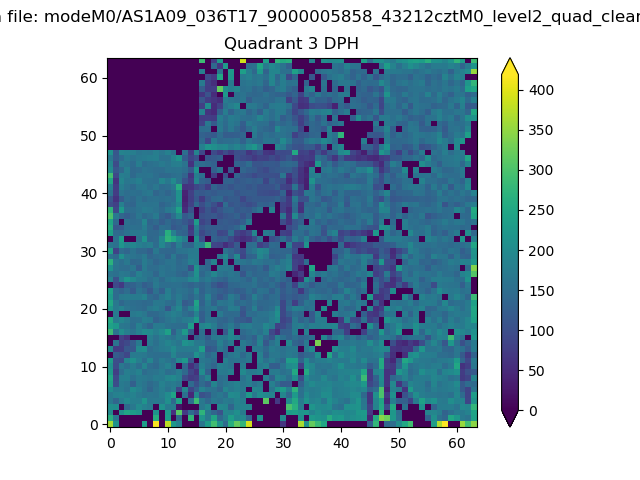 |
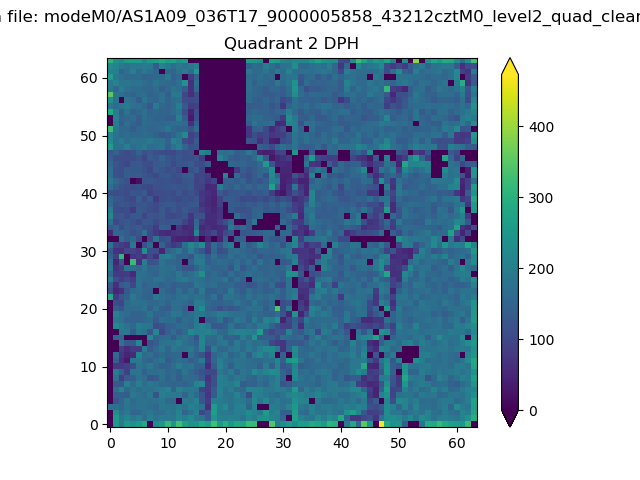 |
Quadrant C |
| Plot type | Count rate plots | Images |
|---|---|---|
| Comparison with Poisson distribution Blue bars denote a histogram of data divided into 1 sec bins. Red curve is a Poisson curve with rate = median count rate of data. |
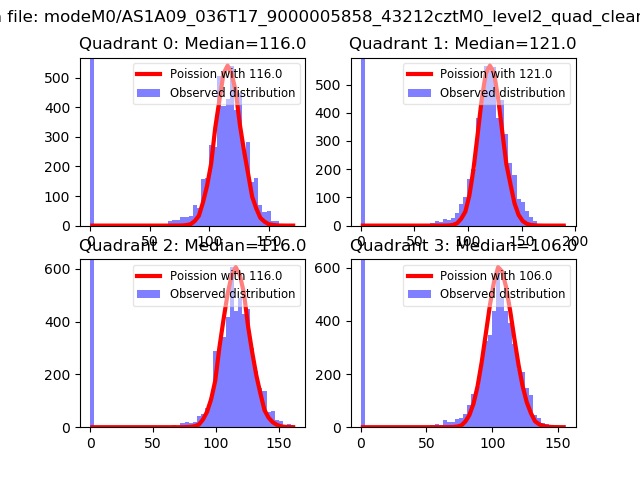 |
 |
| Quadrant-wise count rates Data is divided into 100 sec bins |
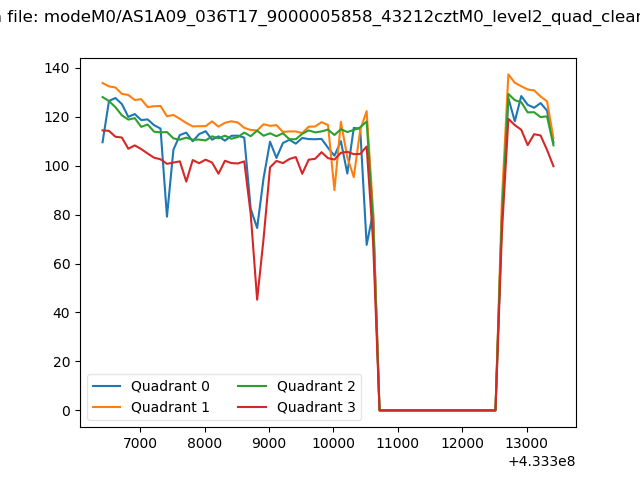 |
|
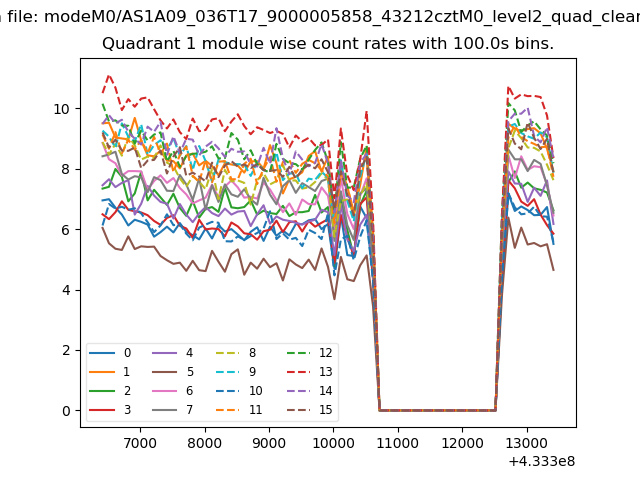
| Module-wise count rates for Quadrant A Data is divided into 100 sec bins |
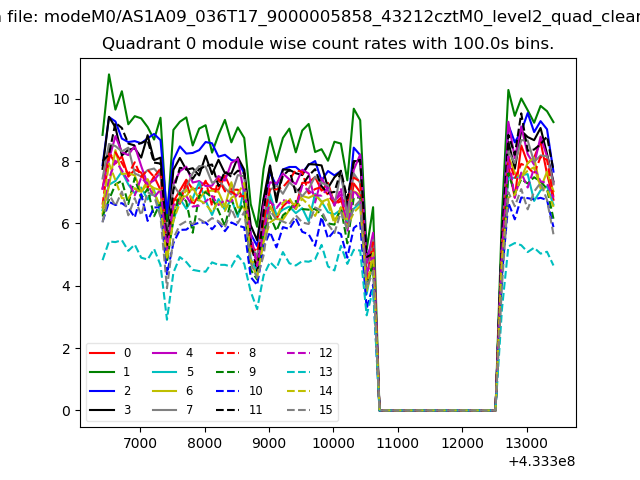 |
 |
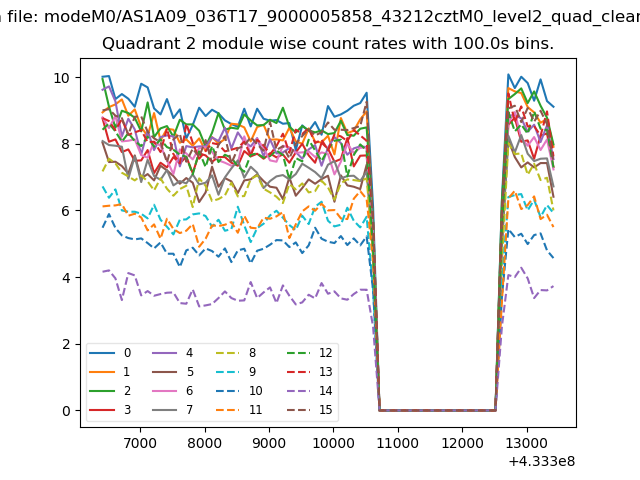
| Module-wise count rates for Quadrant B Data is divided into 100 sec bins |
 |
 |
| Module-wise count rates for Quadrant C Data is divided into 100 sec bins |
 |
 |
| Module-wise count rates for Quadrant D Data is divided into 100 sec bins |
 |
 |
| Parameter | Plot |
|---|---|
| CZT HV Monitor | 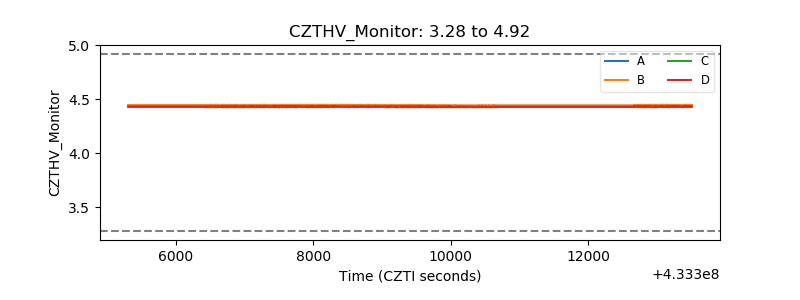 |
| D_VDD | 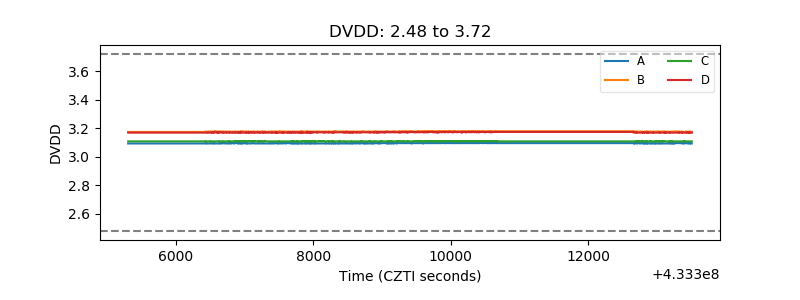 |
| Temperature 1 | 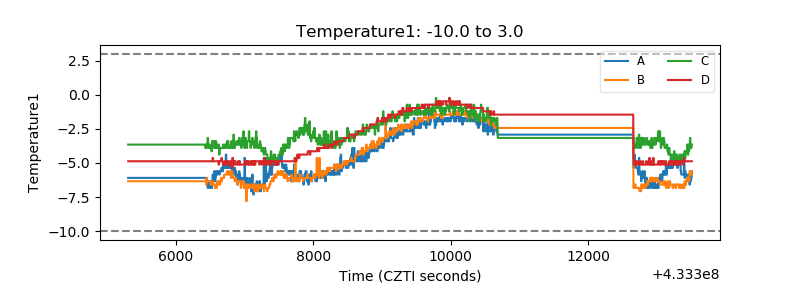 |
| Veto HV Monitor | 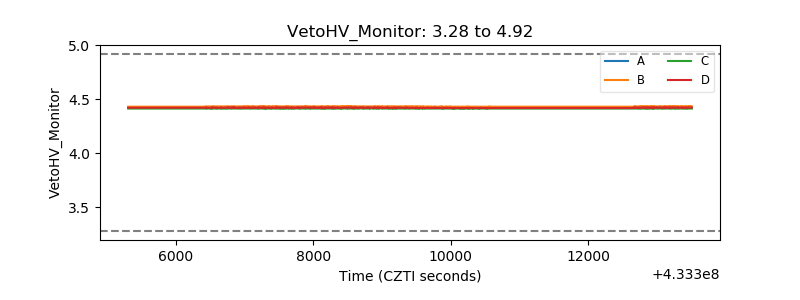 |
| Veto LLD | 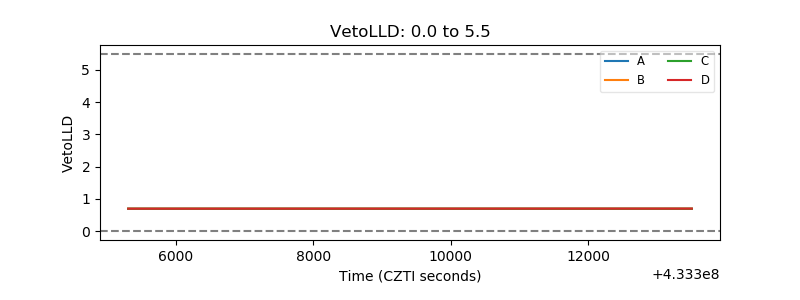 |
| Alpha Counter | 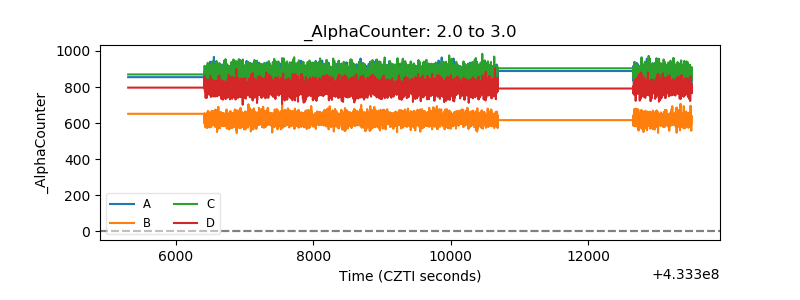 |
| _CPM_Rate | 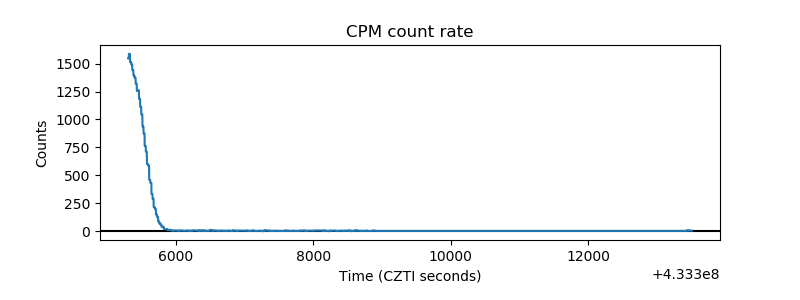 |
| CZT Counter | 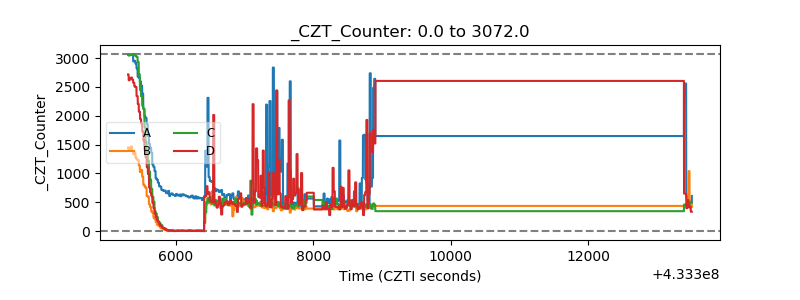 |
| +2.5 Volts monitor | 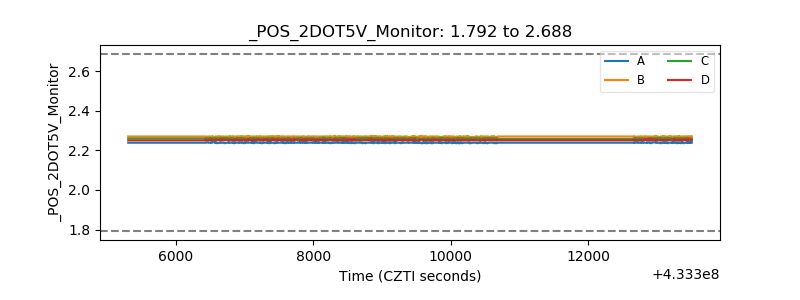 |
| +5 Volts monitor | 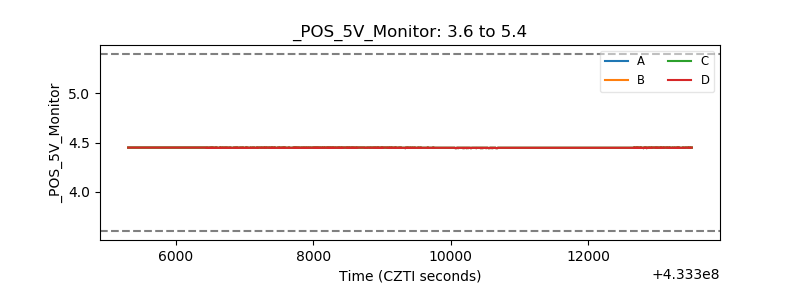 |
| _ROLL_ROT | 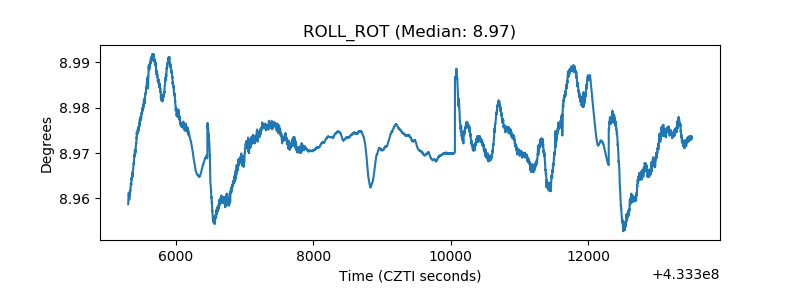 |
| _Roll_DEC | 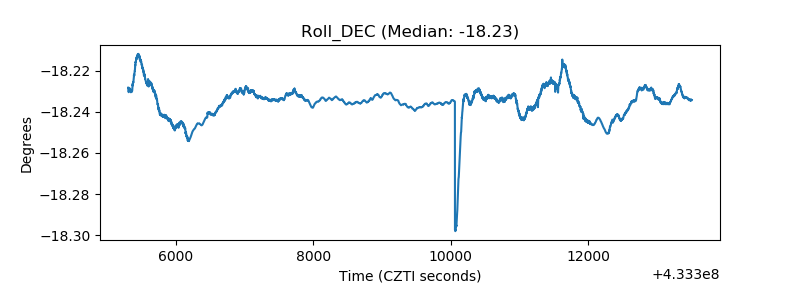 |
| _Roll_RA | 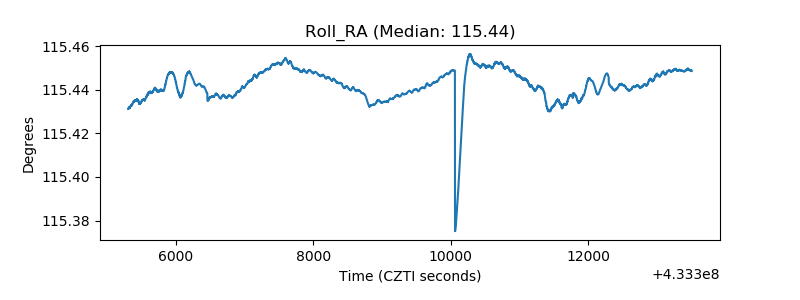 |
| Veto Counter | 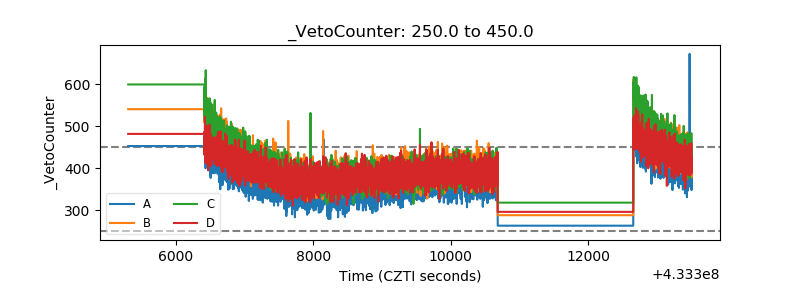 |