| Param | Original file | Final file |
|---|---|---|
| Filename | modeM0/AS1A09_036T17_9000005858_43213cztM0_level2.fits | modeM0/AS1A09_036T17_9000005858_43213cztM0_level2_quad_clean.evt |
| Size (bytes) | 344,093,760 | 94,305,600 |
| Size | 328.2 MB | 89.9 MB |
| Events in quadrant A | 3,912,081 | 616,524 |
| Events in quadrant B | 2,819,957 | 656,071 |
| Events in quadrant C | 2,611,185 | 631,151 |
| Events in quadrant D | 2,974,624 | 575,004 |
| Mode M0 | |||
|---|---|---|---|
| Quadrant | BADHDUFLAG | Total packets | Discarded packets |
| A | 0 | 15133 | 2 |
| B | 0 | 12095 | 2 |
| C | 0 | 10917 | 2 |
| D | 0 | 12428 | 2 |
| Mode SS | |||
|---|---|---|---|
| Quadrant | BADHDUFLAG | Total packets | Discarded packets |
| A | 0 | 110 | 0 |
| B | 0 | 110 | 0 |
| C | 0 | 110 | 0 |
| D | 0 | 110 | 0 |
| Mode M9 | |||
|---|---|---|---|
| Quadrant | BADHDUFLAG | Total packets | Discarded packets |
| A | 0 | 21 | 0 |
| B | 0 | 21 | 0 |
| C | 0 | 21 | 0 |
| D | 0 | 21 | 0 |
| Quadrant | Total seconds | Saturated seconds | Saturation percentage |
|---|---|---|---|
| A | 5384 | 224 | 4.160475% |
| B | 5385 | 63 | 1.169916% |
| C | 5385 | 4 | 0.074280% |
| D | 5385 | 59 | 1.095636% |
Noise dominated data is calculated using 1-second bins in cleaned event files. If a bin has >2000 counts, and if more than 50% of those come from <1% of pixels, then it is considered to be noise-dominated and hence unusable.
| Quadrant | # 1 sec bins | Bins with >0 counts | Bins with >2000 counts | High rate bins dominated by noise | Noise dominated (total time) | Noise dominated (detector-on time) | Marked lightcurve |
|---|---|---|---|---|---|---|---|
| A | 7447 | 5385 | 205 | 205 | 2.75% | 3.81% | 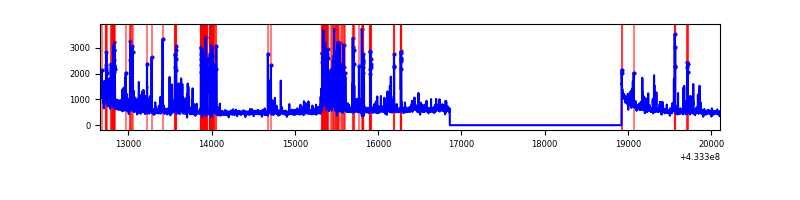 |
| B | 7448 | 5386 | 38 | 38 | 0.51% | 0.71% | 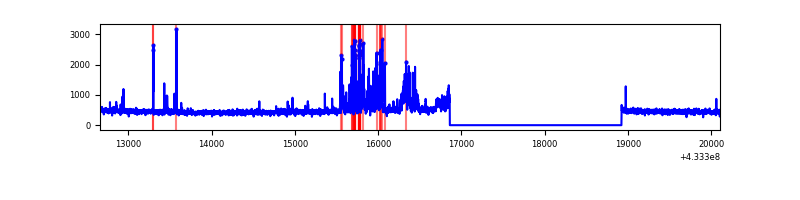 |
| C | 7448 | 5386 | 0 | 0 | 0.00% | 0.00% | 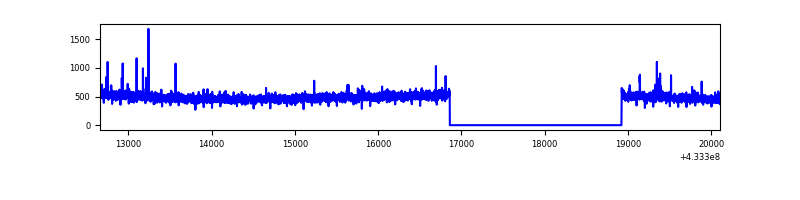 |
| D | 7448 | 5386 | 55 | 55 | 0.74% | 1.02% | 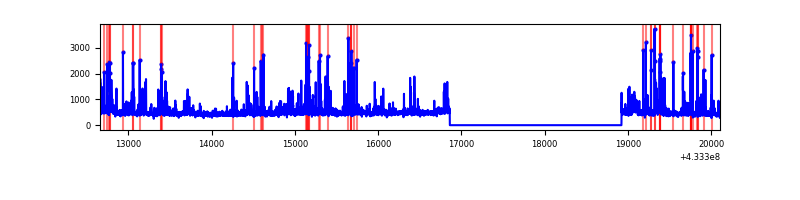 |
Top three noisy pixels from each quadrant. If the there are fewer than three noisy pixels in the level2.evt file, extra rows are filled as -1
| Pixel properties | Quadrant properties | ||||||
|---|---|---|---|---|---|---|---|
| Quadrant | DetID | PixID | Counts | Sigma | Mean | Median | Sigma |
| A | 10 | 83 | 575307 | 4646.58 | 600 | 589 | 123.7 |
| A | 13 | 248 | 480158 | 3877.31 | 600 | 589 | 123.7 |
| A | 15 | 237 | 474253 | 3829.57 | 600 | 589 | 123.7 |
| B | 5 | 255 | 236675 | 2034.56 | 606 | 592 | 116.0 |
| B | 4 | 36 | 115347 | 988.96 | 606 | 592 | 116.0 |
| B | 0 | 186 | 42529 | 361.41 | 606 | 592 | 116.0 |
| C | 15 | 214 | 225443 | 1597.6 | 602 | 607 | 140.7 |
| C | 14 | 254 | 26421 | 183.42 | 602 | 607 | 140.7 |
| C | 3 | 233 | 7688 | 50.31 | 602 | 607 | 140.7 |
| D | 1 | 52 | 457302 | 3114.59 | 600 | 584 | 146.6 |
| D | 2 | 249 | 97743 | 662.58 | 600 | 584 | 146.6 |
| D | 12 | 6 | 40885 | 274.83 | 600 | 584 | 146.6 |
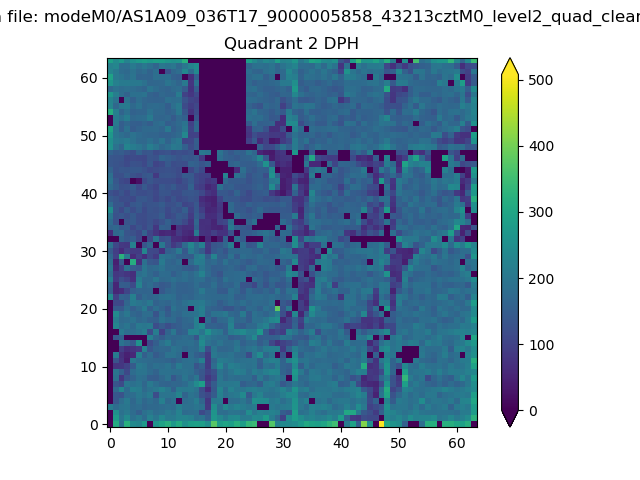
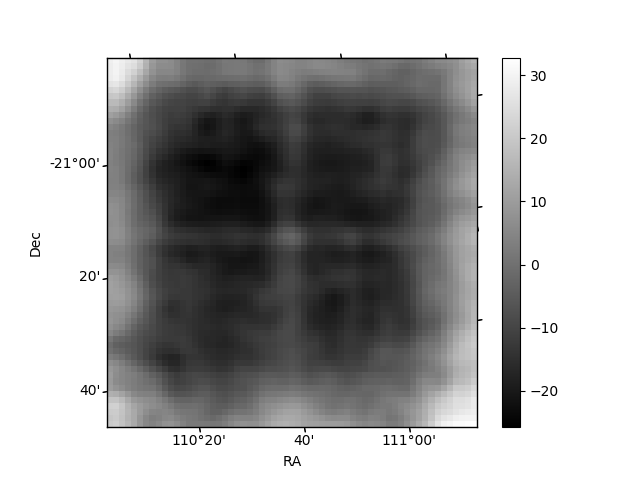
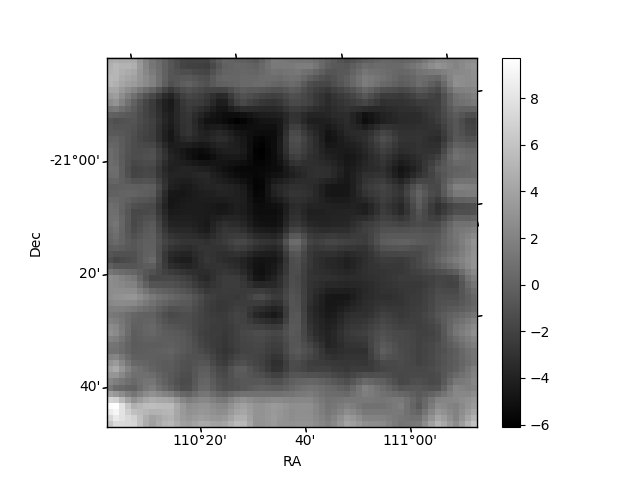
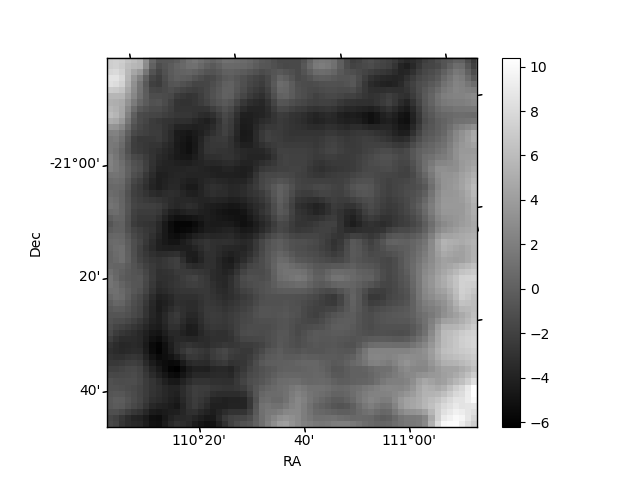
Histogram calculated using DETX and DETY for each event in the final _common_clean file
| Quadrant A | 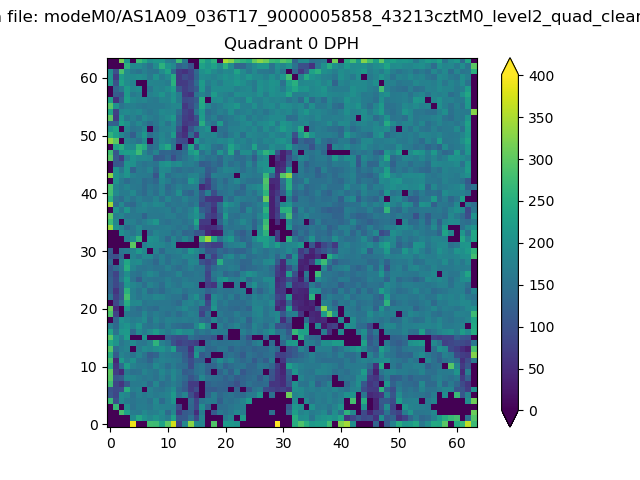 |
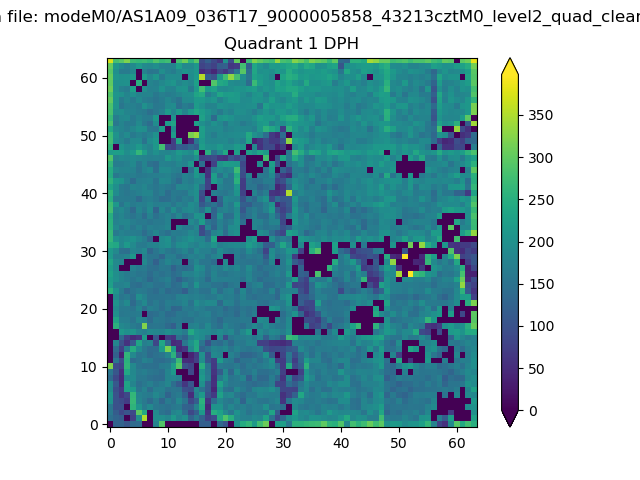 |
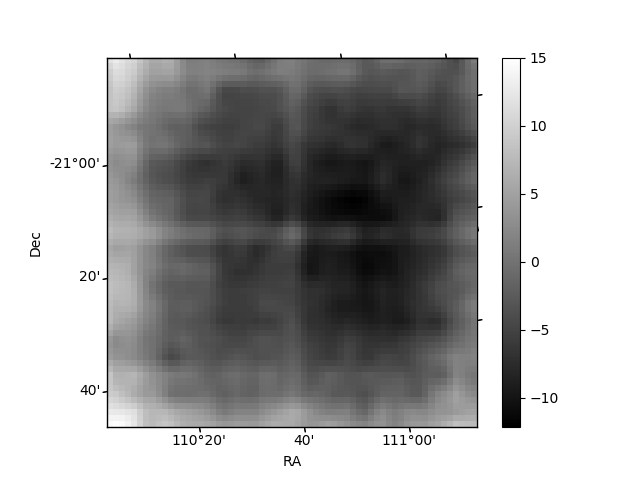
Quadrant B |
|---|---|---|---|
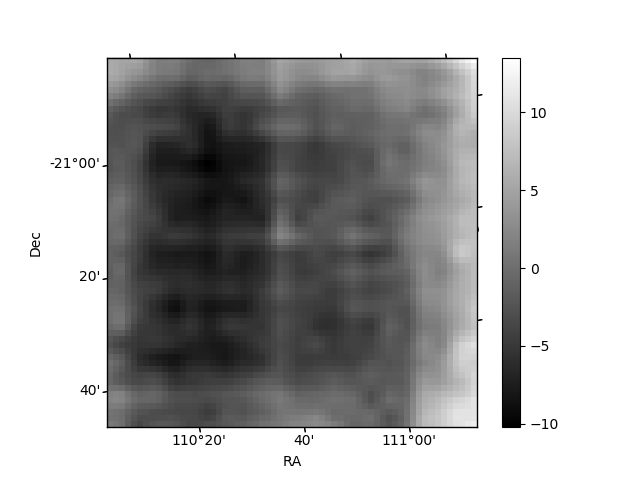
| Quadrant D | 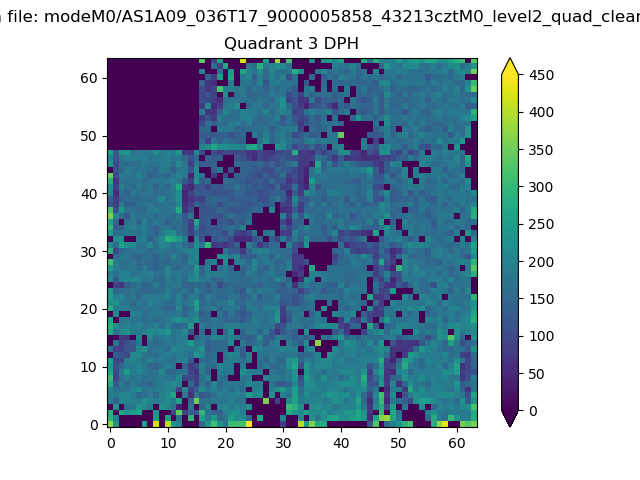 |
 |
Quadrant C |
| Plot type | Count rate plots | Images |
|---|---|---|
| Comparison with Poisson distribution Blue bars denote a histogram of data divided into 1 sec bins. Red curve is a Poisson curve with rate = median count rate of data. |
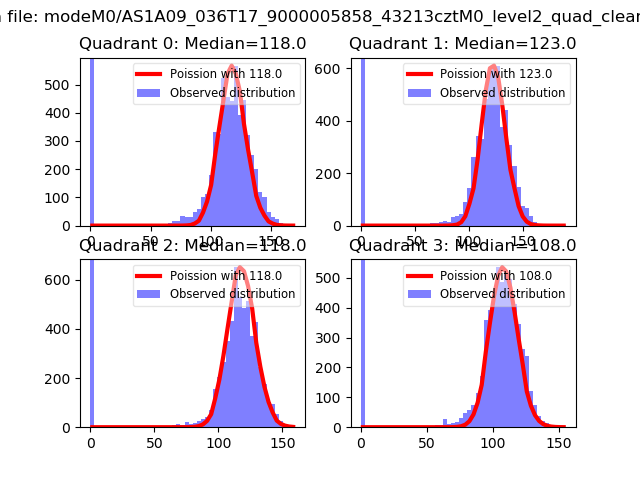 |
 |
| Quadrant-wise count rates Data is divided into 100 sec bins |
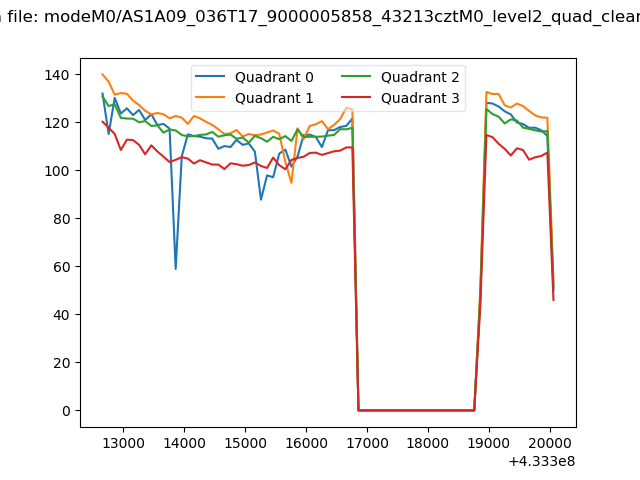 |
|
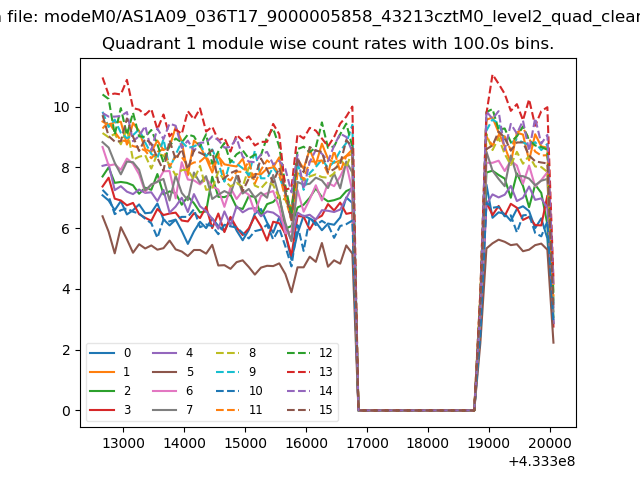
| Module-wise count rates for Quadrant A Data is divided into 100 sec bins |
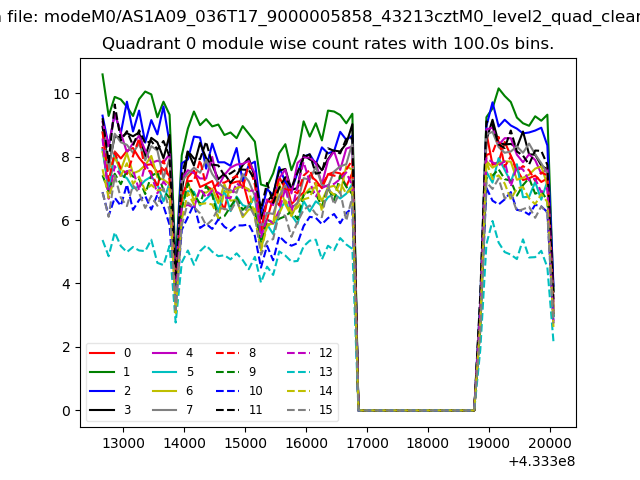 |
 |
| Module-wise count rates for Quadrant B Data is divided into 100 sec bins |
 |
 |
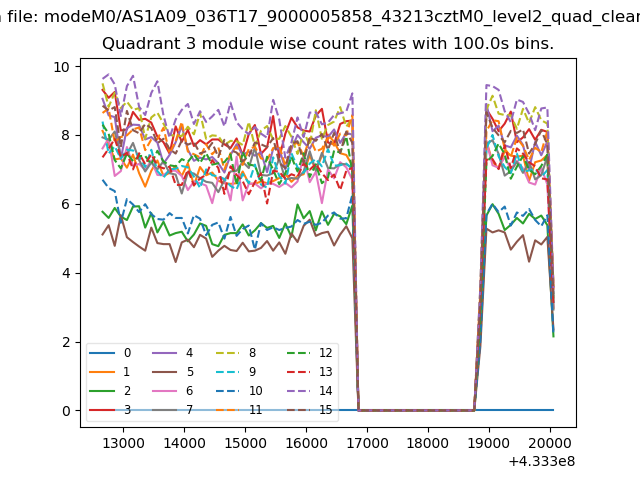
| Module-wise count rates for Quadrant C Data is divided into 100 sec bins |
 |
 |
| Module-wise count rates for Quadrant D Data is divided into 100 sec bins |
 |
 |
| Parameter | Plot |
|---|---|
| CZT HV Monitor | 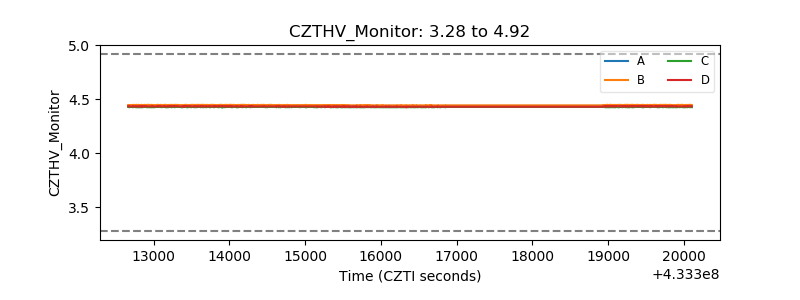 |
| D_VDD | 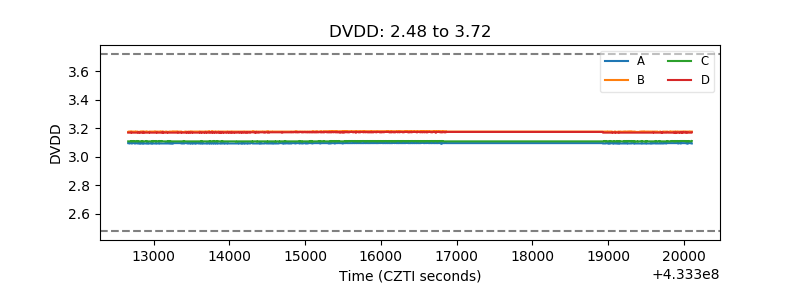 |
| Temperature 1 | 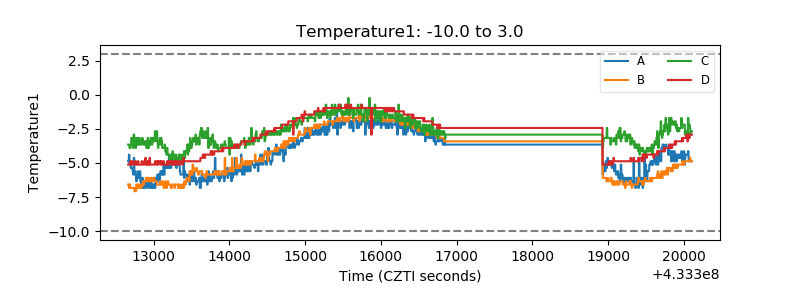 |
| Veto HV Monitor |  |
| Veto LLD | 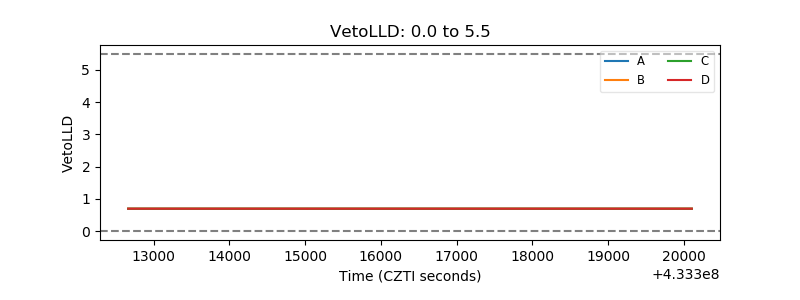 |
| Alpha Counter | 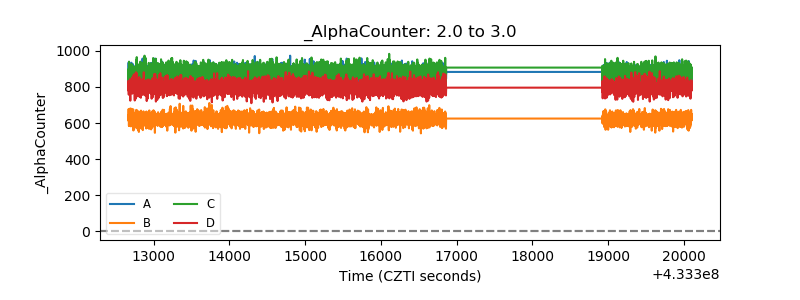 |
| _CPM_Rate | 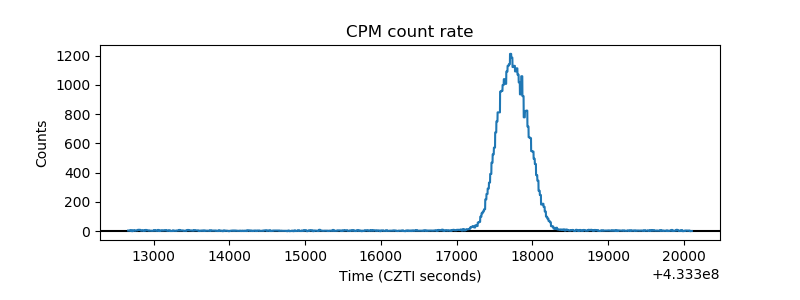 |
| CZT Counter | 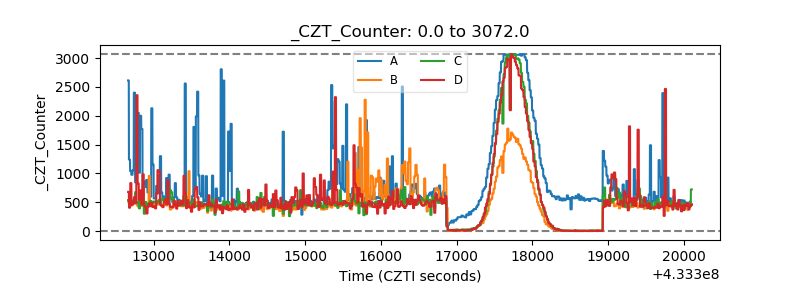 |
| +2.5 Volts monitor | 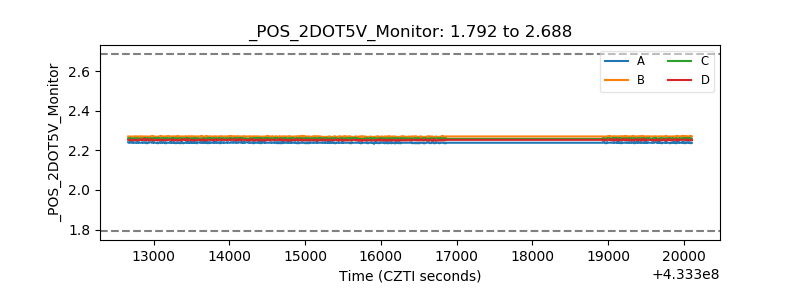 |
| +5 Volts monitor | 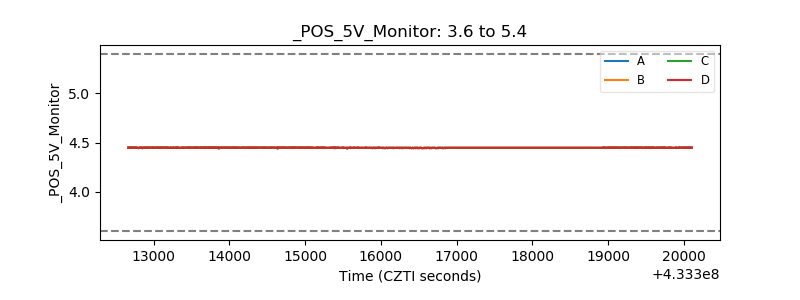 |
| _ROLL_ROT | 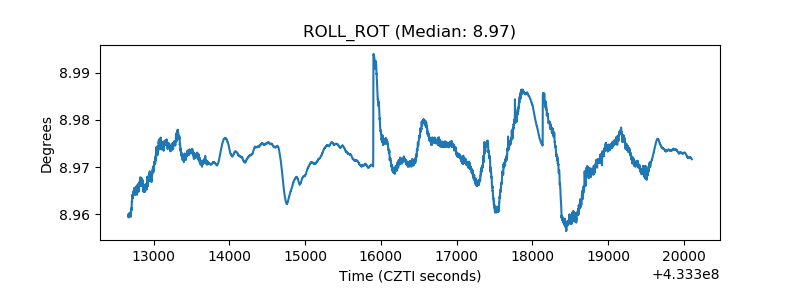 |
| _Roll_DEC | 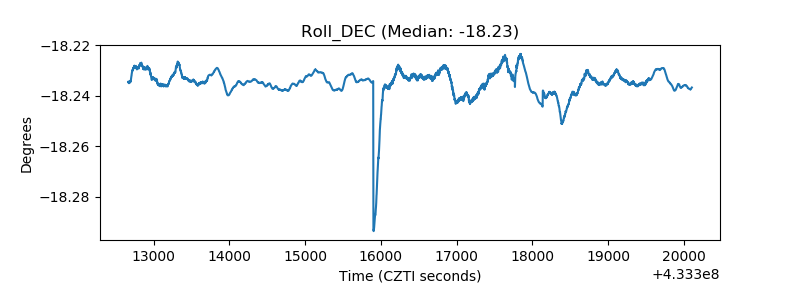 |
| _Roll_RA | 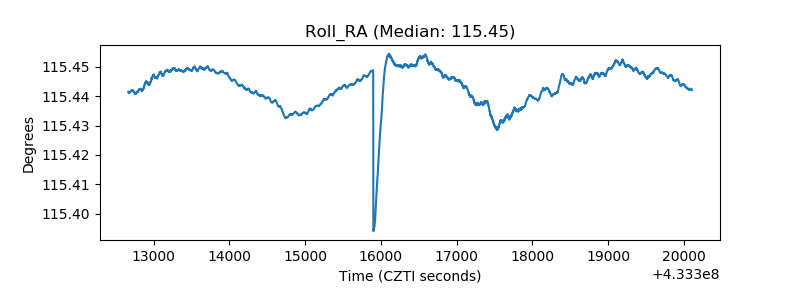 |
| Veto Counter | 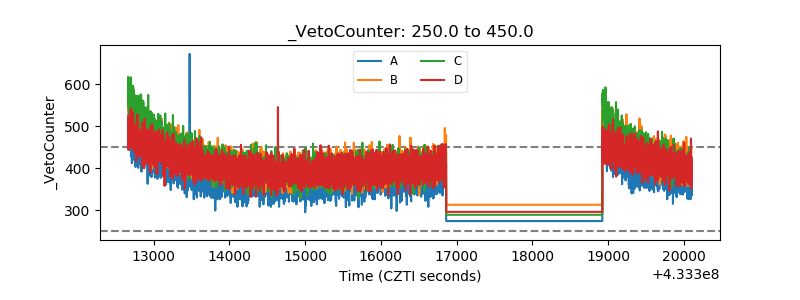 |