| Param | Original file | Final file |
|---|---|---|
| Filename | modeM0/AS1A09_036T17_9000005858_43214cztM0_level2.fits | modeM0/AS1A09_036T17_9000005858_43214cztM0_level2_quad_clean.evt |
| Size (bytes) | 349,724,160 | 92,134,080 |
| Size | 333.5 MB | 87.9 MB |
| Events in quadrant A | 3,719,525 | 606,646 |
| Events in quadrant B | 2,701,966 | 639,260 |
| Events in quadrant C | 2,592,290 | 613,482 |
| Events in quadrant D | 3,513,596 | 554,054 |
| Mode M0 | |||
|---|---|---|---|
| Quadrant | BADHDUFLAG | Total packets | Discarded packets |
| A | 0 | 14502 | 2 |
| B | 0 | 11500 | 2 |
| C | 0 | 10961 | 2 |
| D | 0 | 14065 | 2 |
| Mode SS | |||
|---|---|---|---|
| Quadrant | BADHDUFLAG | Total packets | Discarded packets |
| A | 0 | 110 | 0 |
| B | 0 | 110 | 0 |
| C | 0 | 110 | 0 |
| D | 0 | 110 | 0 |
| Mode M9 | |||
|---|---|---|---|
| Quadrant | BADHDUFLAG | Total packets | Discarded packets |
| A | 0 | 22 | 0 |
| B | 0 | 23 | 0 |
| C | 0 | 23 | 0 |
| D | 0 | 23 | 0 |
| Quadrant | Total seconds | Saturated seconds | Saturation percentage |
|---|---|---|---|
| A | 5373 | 159 | 2.959241% |
| B | 5373 | 48 | 0.893356% |
| C | 5373 | 7 | 0.130281% |
| D | 5373 | 177 | 3.294249% |
Noise dominated data is calculated using 1-second bins in cleaned event files. If a bin has >2000 counts, and if more than 50% of those come from <1% of pixels, then it is considered to be noise-dominated and hence unusable.
| Quadrant | # 1 sec bins | Bins with >0 counts | Bins with >2000 counts | High rate bins dominated by noise | Noise dominated (total time) | Noise dominated (detector-on time) | Marked lightcurve |
|---|---|---|---|---|---|---|---|
| A | 7495 | 5374 | 119 | 119 | 1.59% | 2.21% | 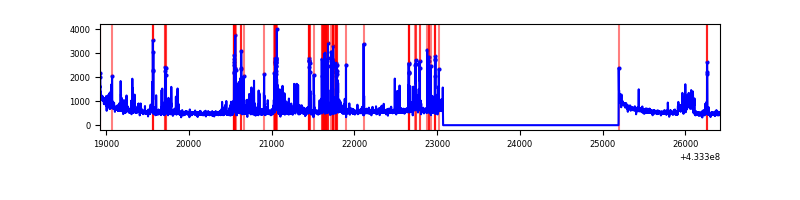 |
| B | 7495 | 5374 | 18 | 18 | 0.24% | 0.33% | 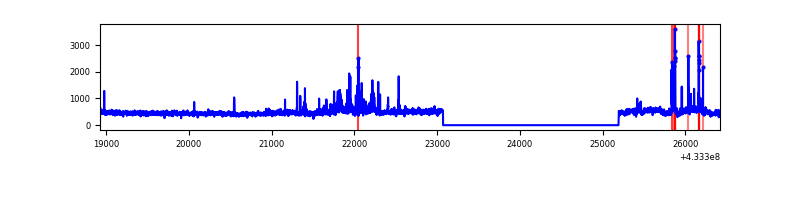 |
| C | 7495 | 5374 | 3 | 3 | 0.04% | 0.06% | 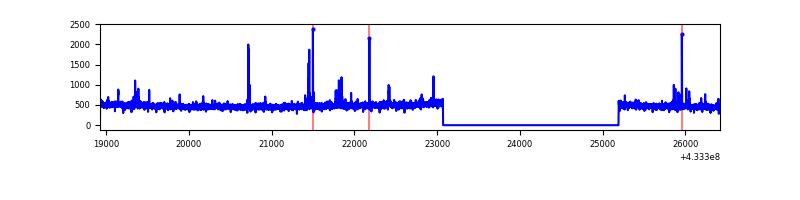 |
| D | 7495 | 5374 | 151 | 151 | 2.01% | 2.81% | 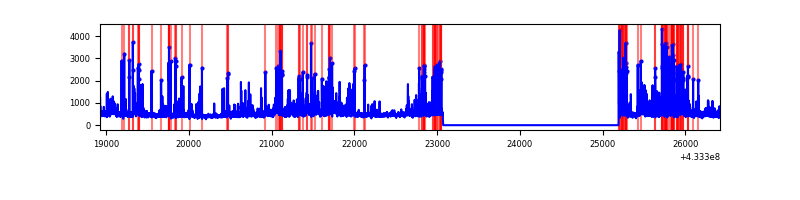 |
Top three noisy pixels from each quadrant. If the there are fewer than three noisy pixels in the level2.evt file, extra rows are filled as -1
| Pixel properties | Quadrant properties | ||||||
|---|---|---|---|---|---|---|---|
| Quadrant | DetID | PixID | Counts | Sigma | Mean | Median | Sigma |
| A | 10 | 83 | 611909 | 5019.88 | 594 | 582 | 121.8 |
| A | 15 | 237 | 490229 | 4020.71 | 594 | 582 | 121.8 |
| A | 13 | 248 | 152449 | 1247.05 | 594 | 582 | 121.8 |
| B | 0 | 186 | 130165 | 1119.68 | 595 | 579 | 115.7 |
| B | 0 | 230 | 97845 | 840.42 | 595 | 579 | 115.7 |
| B | 5 | 172 | 94311 | 809.89 | 595 | 579 | 115.7 |
| C | 15 | 214 | 226203 | 1634.34 | 589 | 592 | 138.0 |
| C | 14 | 254 | 52999 | 379.64 | 589 | 592 | 138.0 |
| C | 12 | 249 | 9343 | 63.39 | 589 | 592 | 138.0 |
| D | 1 | 52 | 927217 | 6477.89 | 584 | 568 | 143.0 |
| D | 2 | 249 | 220185 | 1535.27 | 584 | 568 | 143.0 |
| D | 12 | 6 | 33684 | 231.5 | 584 | 568 | 143.0 |
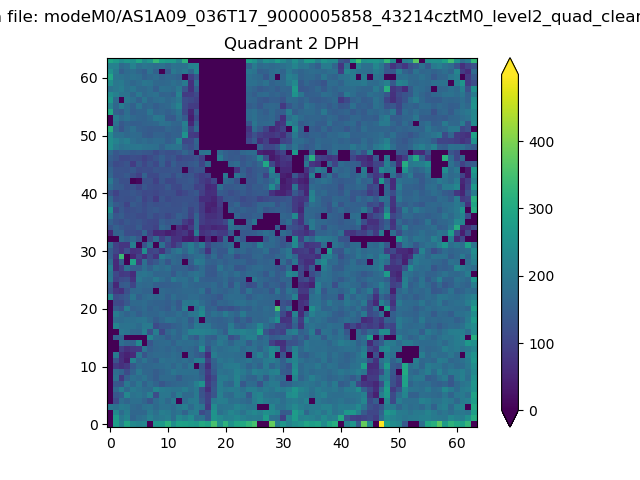
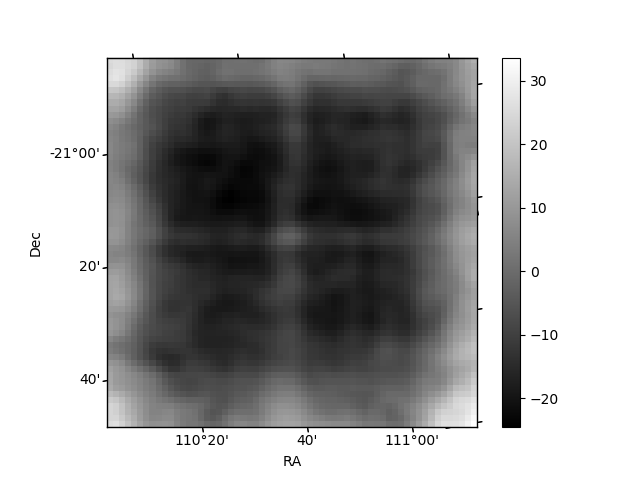
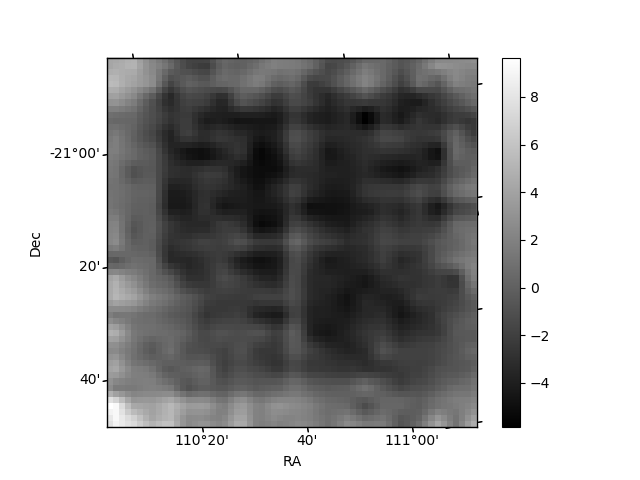
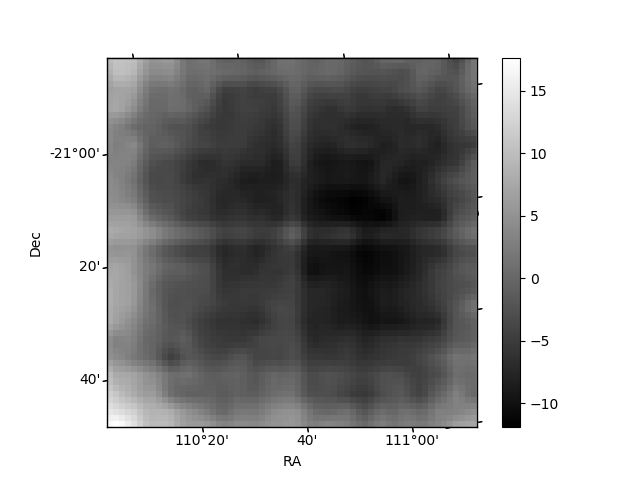
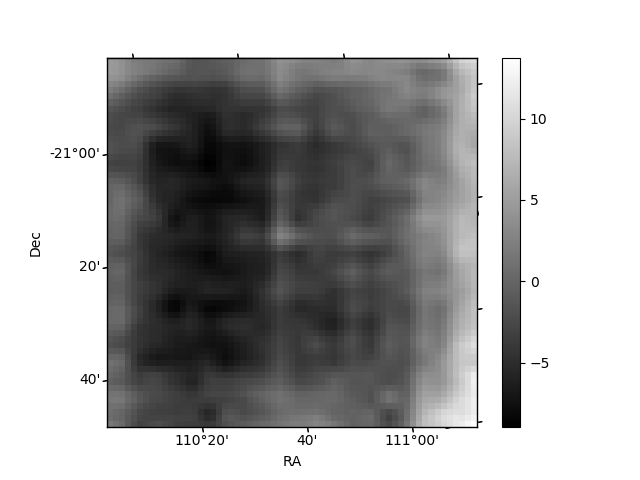
Histogram calculated using DETX and DETY for each event in the final _common_clean file
| Quadrant A | 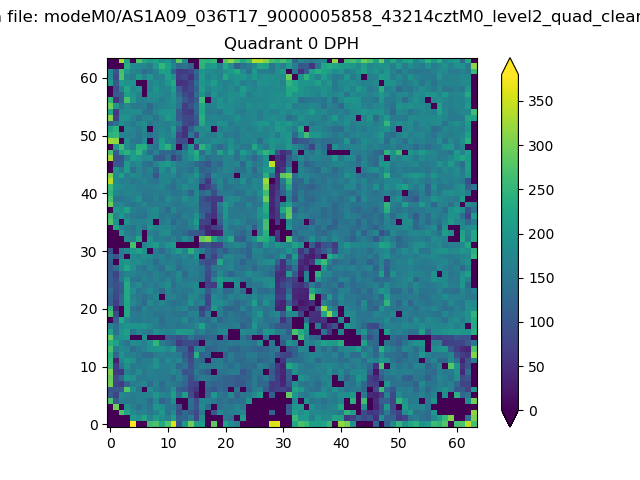 |
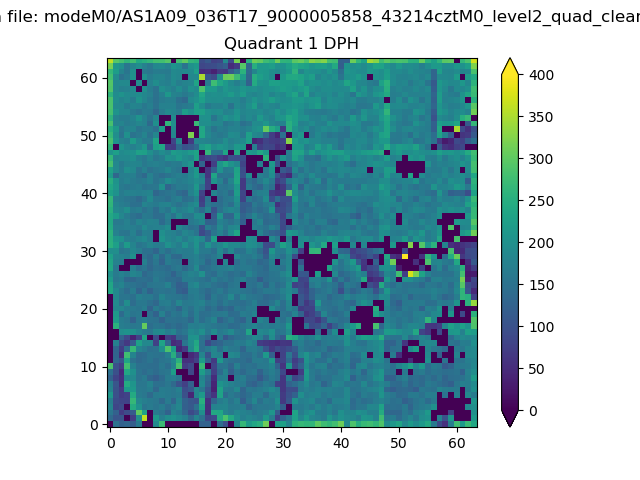 |
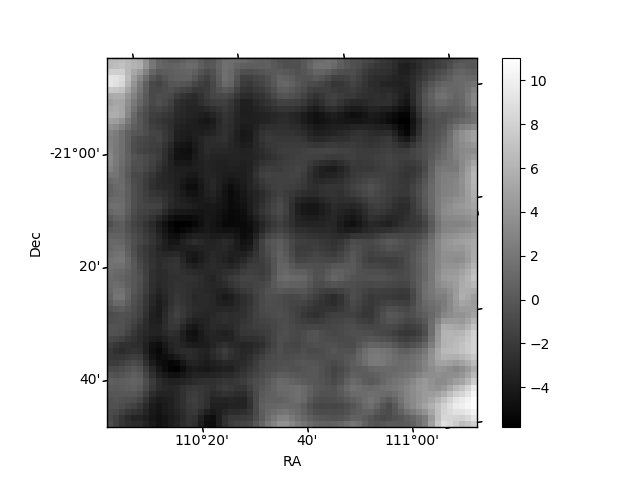
Quadrant B |
|---|---|---|---|
| Quadrant D | 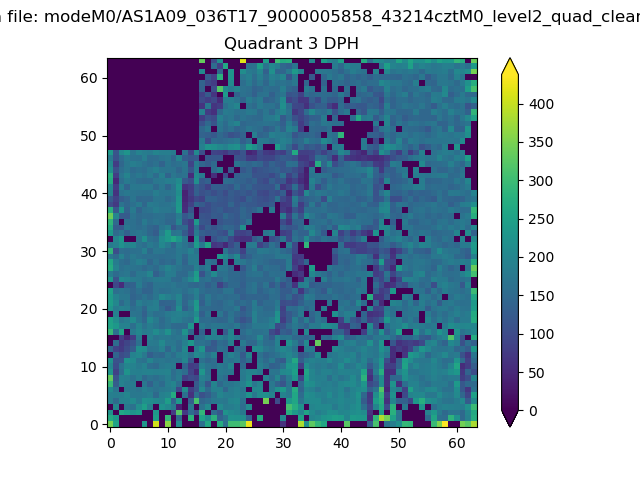 |
 |
Quadrant C |
| Plot type | Count rate plots | Images |
|---|---|---|
| Comparison with Poisson distribution Blue bars denote a histogram of data divided into 1 sec bins. Red curve is a Poisson curve with rate = median count rate of data. |
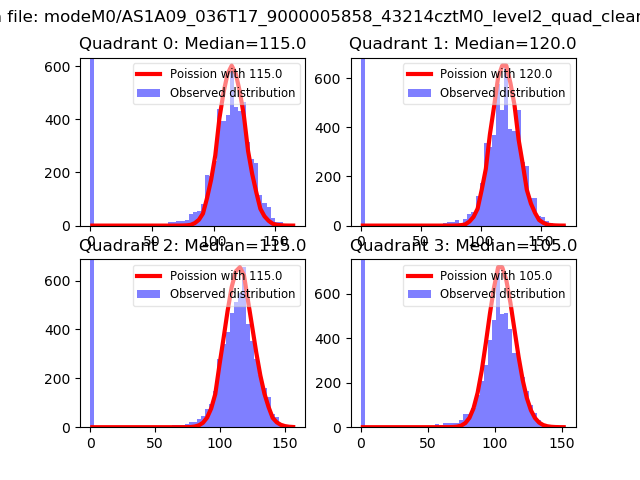 |
 |
| Quadrant-wise count rates Data is divided into 100 sec bins |
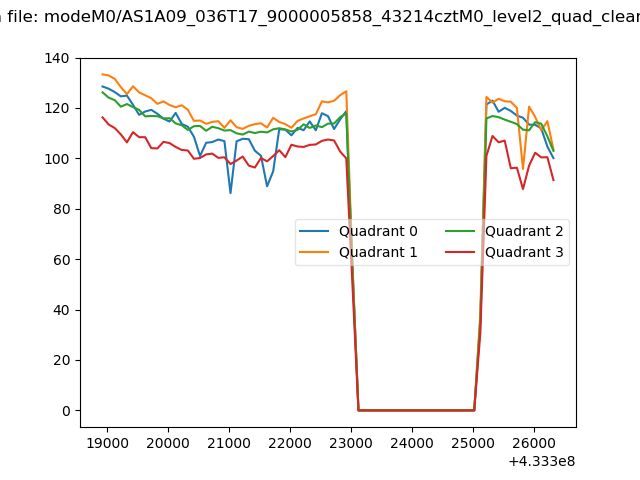 |
|
| Module-wise count rates for Quadrant A Data is divided into 100 sec bins |
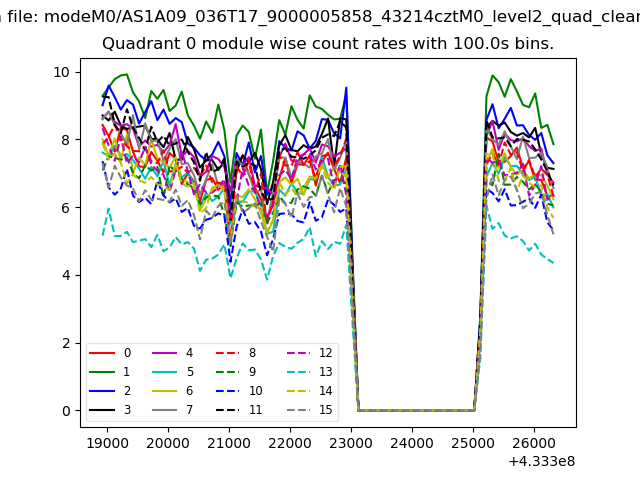 |
 |
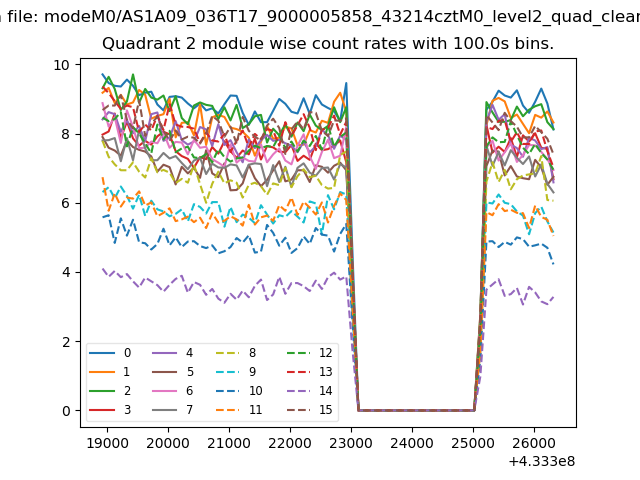
| Module-wise count rates for Quadrant B Data is divided into 100 sec bins |
 |
 |
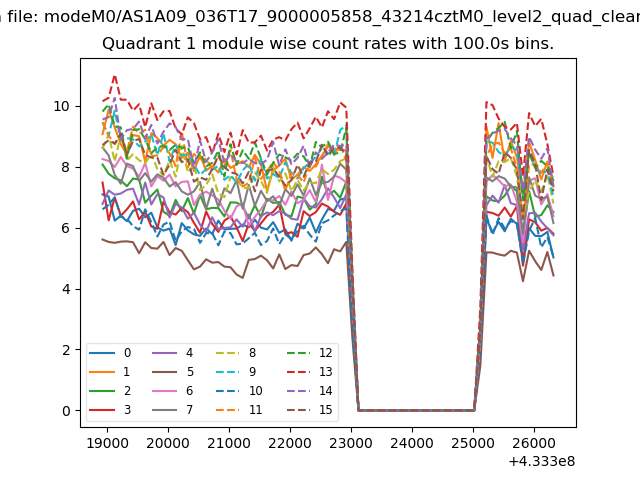
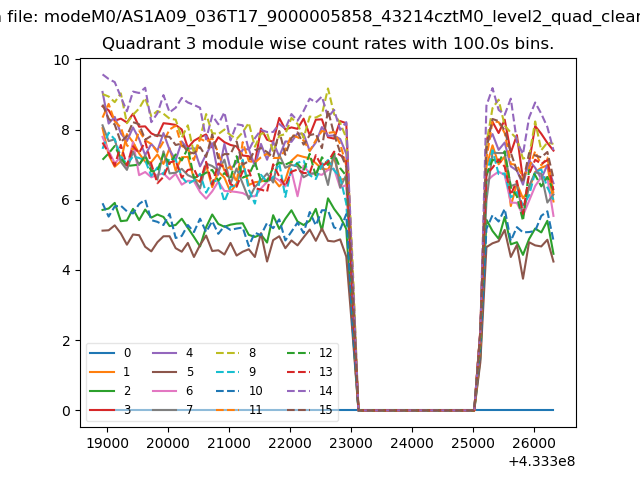
| Module-wise count rates for Quadrant C Data is divided into 100 sec bins |
 |
 |
| Module-wise count rates for Quadrant D Data is divided into 100 sec bins |
 |
 |
| Parameter | Plot |
|---|---|
| CZT HV Monitor | 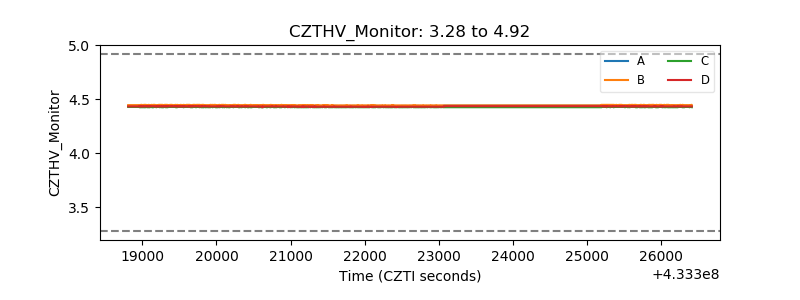 |
| D_VDD | 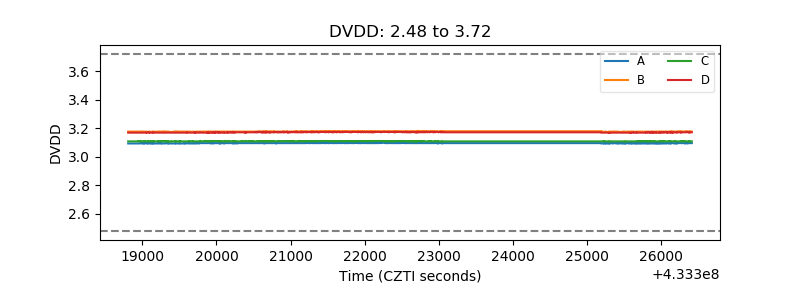 |
| Temperature 1 | 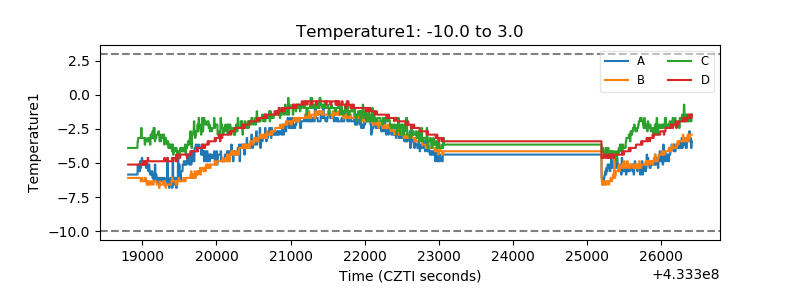 |
| Veto HV Monitor |  |
| Veto LLD | 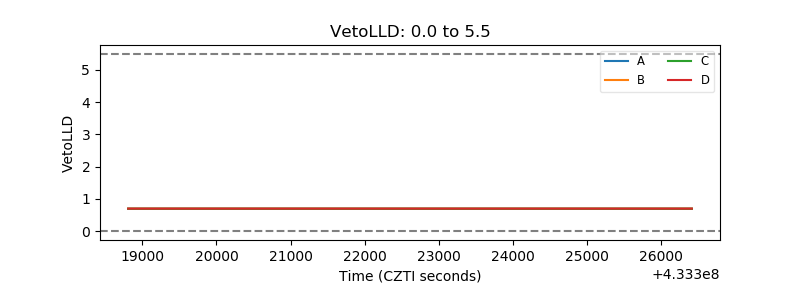 |
| Alpha Counter | 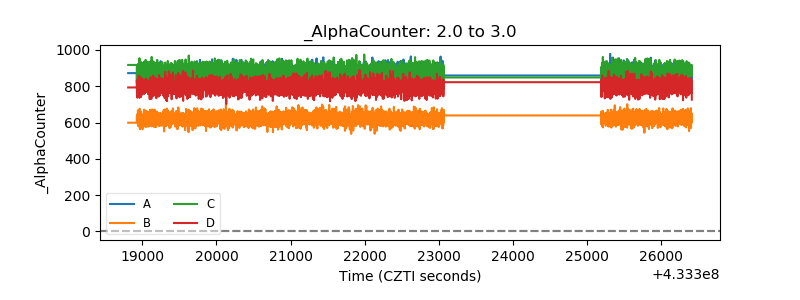 |
| _CPM_Rate | 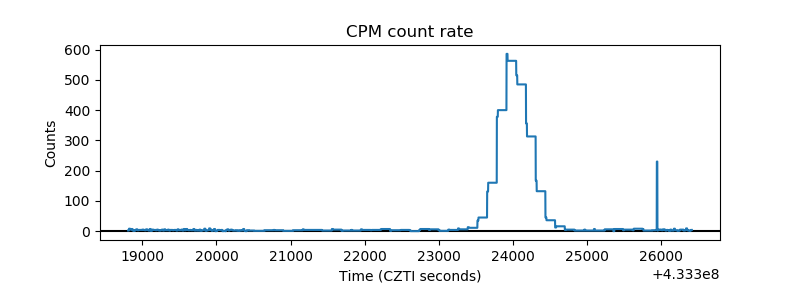 |
| CZT Counter | 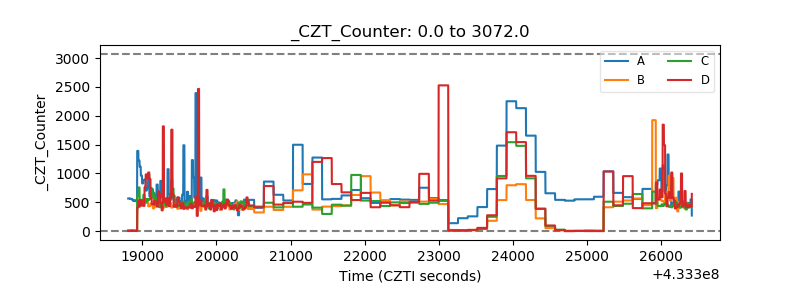 |
| +2.5 Volts monitor | 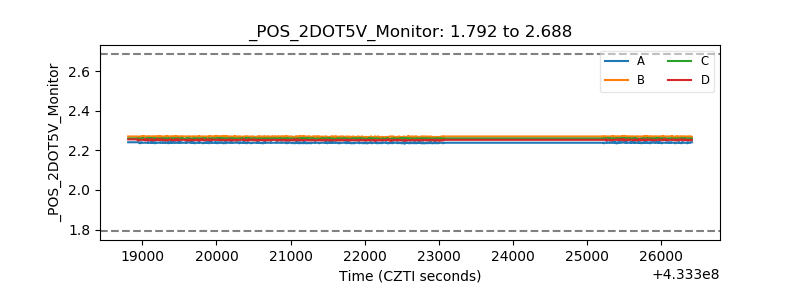 |
| +5 Volts monitor |  |
| _ROLL_ROT | 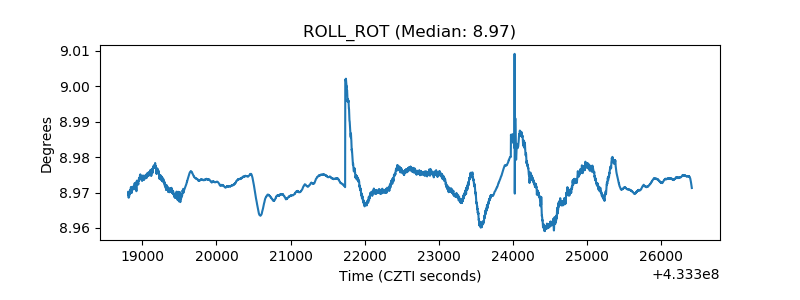 |
| _Roll_DEC | 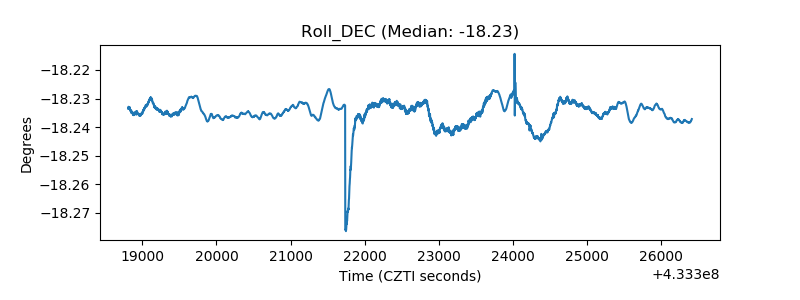 |
| _Roll_RA | 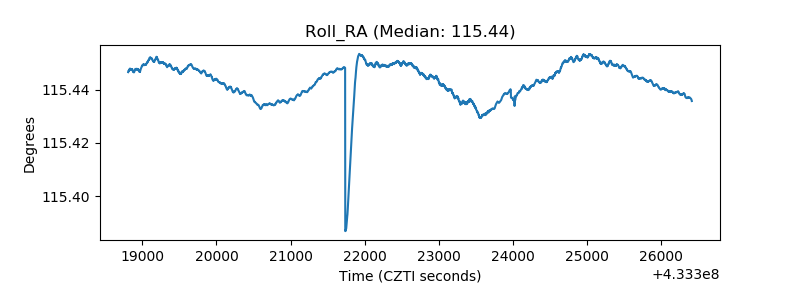 |
| Veto Counter | 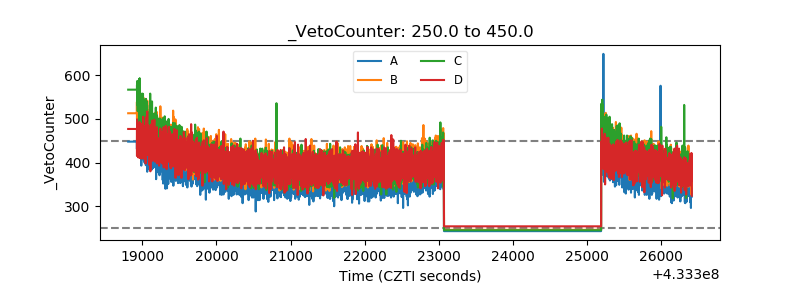 |