| Param | Original file | Final file |
|---|---|---|
| Filename | modeM0/AS1A09_036T17_9000005858_43217cztM0_level2.fits | modeM0/AS1A09_036T17_9000005858_43217cztM0_level2_quad_clean.evt |
| Size (bytes) | 358,761,600 | 92,206,080 |
| Size | 342.1 MB | 87.9 MB |
| Events in quadrant A | 3,890,493 | 597,820 |
| Events in quadrant B | 2,754,148 | 633,477 |
| Events in quadrant C | 2,668,806 | 608,861 |
| Events in quadrant D | 3,518,694 | 549,328 |
| Mode M0 | |||
|---|---|---|---|
| Quadrant | BADHDUFLAG | Total packets | Discarded packets |
| A | 0 | 15016 | 2 |
| B | 0 | 12135 | 2 |
| C | 0 | 11667 | 2 |
| D | 0 | 14483 | 2 |
| Mode SS | |||
|---|---|---|---|
| Quadrant | BADHDUFLAG | Total packets | Discarded packets |
| A | 0 | 118 | 0 |
| B | 0 | 118 | 0 |
| C | 0 | 118 | 0 |
| D | 0 | 118 | 0 |
| Mode M9 | |||
|---|---|---|---|
| Quadrant | BADHDUFLAG | Total packets | Discarded packets |
| A | 0 | 16 | 0 |
| B | 0 | 17 | 0 |
| C | 0 | 17 | 0 |
| D | 0 | 17 | 0 |
| Quadrant | Total seconds | Saturated seconds | Saturation percentage |
|---|---|---|---|
| A | 5753 | 222 | 3.858856% |
| B | 5753 | 24 | 0.417174% |
| C | 5753 | 3 | 0.052147% |
| D | 5753 | 211 | 3.667652% |
Noise dominated data is calculated using 1-second bins in cleaned event files. If a bin has >2000 counts, and if more than 50% of those come from <1% of pixels, then it is considered to be noise-dominated and hence unusable.
| Quadrant | # 1 sec bins | Bins with >0 counts | Bins with >2000 counts | High rate bins dominated by noise | Noise dominated (total time) | Noise dominated (detector-on time) | Marked lightcurve |
|---|---|---|---|---|---|---|---|
| A | 7306 | 5754 | 175 | 175 | 2.40% | 3.04% | 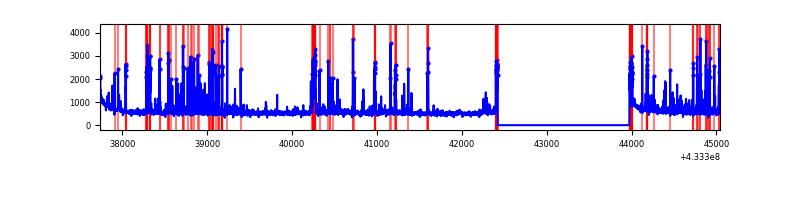 |
| B | 7306 | 5754 | 17 | 17 | 0.23% | 0.30% | 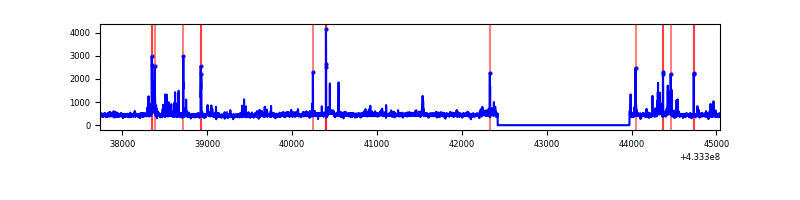 |
| C | 7306 | 5754 | 0 | 0 | 0.00% | 0.00% | 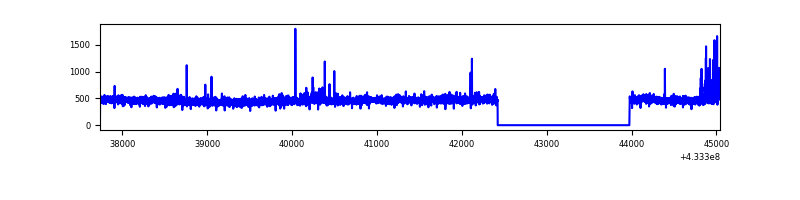 |
| D | 7306 | 5754 | 156 | 156 | 2.14% | 2.71% | 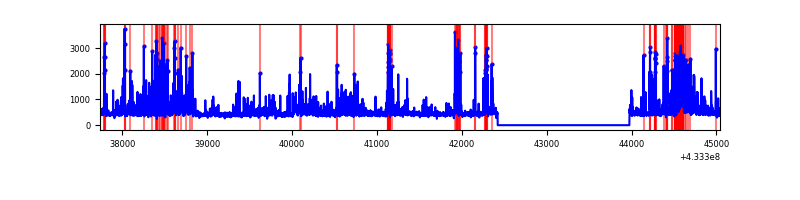 |
Top three noisy pixels from each quadrant. If the there are fewer than three noisy pixels in the level2.evt file, extra rows are filled as -1
| Pixel properties | Quadrant properties | ||||||
|---|---|---|---|---|---|---|---|
| Quadrant | DetID | PixID | Counts | Sigma | Mean | Median | Sigma |
| A | 10 | 83 | 659530 | 5240.84 | 609 | 596 | 125.7 |
| A | 15 | 237 | 564428 | 4484.45 | 609 | 596 | 125.7 |
| A | 13 | 248 | 192394 | 1525.47 | 609 | 596 | 125.7 |
| B | 0 | 189 | 92384 | 768.54 | 615 | 598 | 119.4 |
| B | 0 | 186 | 75613 | 628.12 | 615 | 598 | 119.4 |
| B | 5 | 172 | 70384 | 584.33 | 615 | 598 | 119.4 |
| C | 15 | 214 | 243559 | 1704.33 | 606 | 607 | 142.5 |
| C | 14 | 254 | 55858 | 387.59 | 606 | 607 | 142.5 |
| C | 8 | 79 | 4150 | 24.85 | 606 | 607 | 142.5 |
| D | 1 | 52 | 522395 | 3496.6 | 602 | 584 | 149.2 |
| D | 13 | 249 | 360554 | 2412.12 | 602 | 584 | 149.2 |
| D | 12 | 218 | 102981 | 686.15 | 602 | 584 | 149.2 |
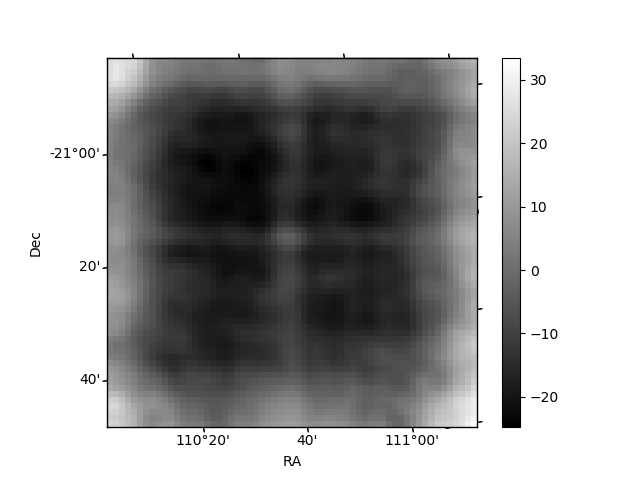
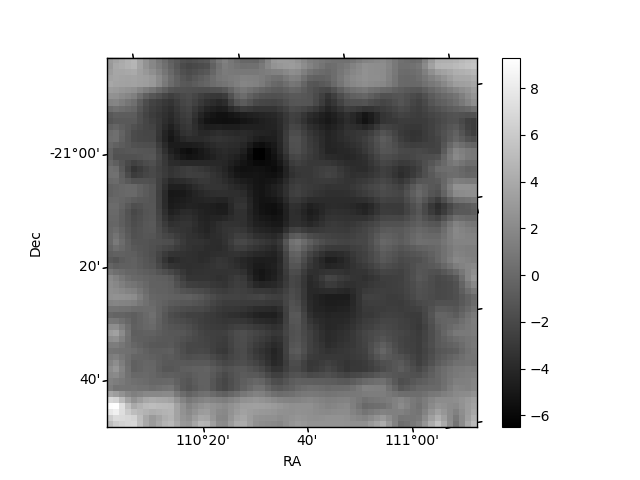
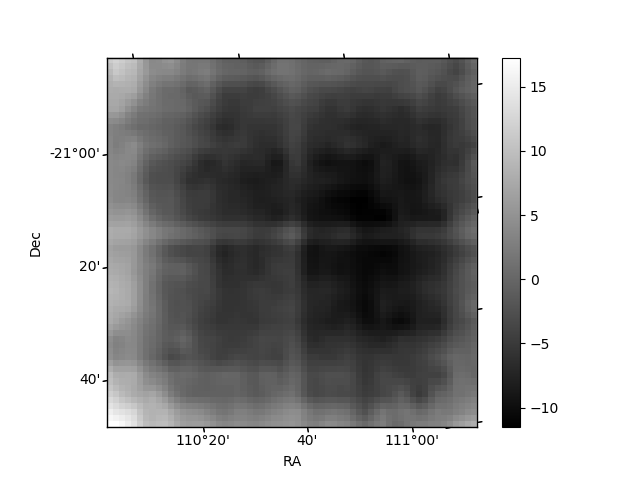
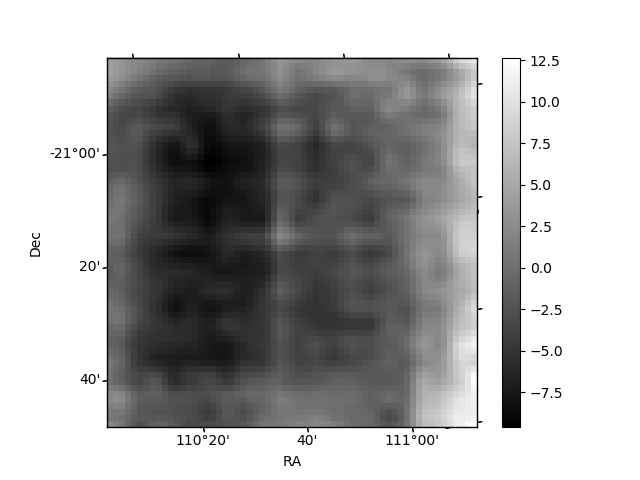
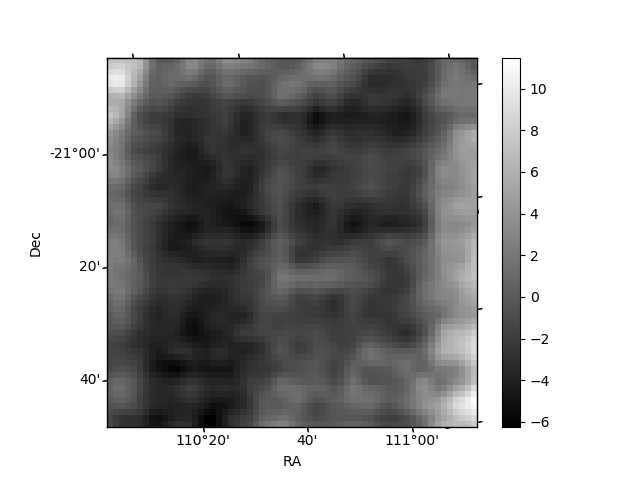
Histogram calculated using DETX and DETY for each event in the final _common_clean file
| Quadrant A | 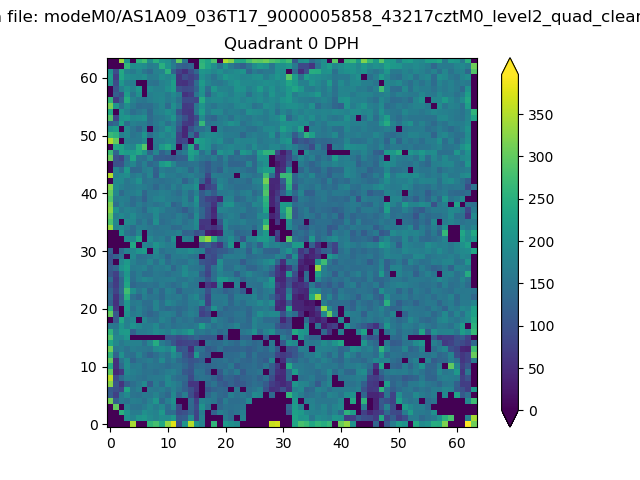 |
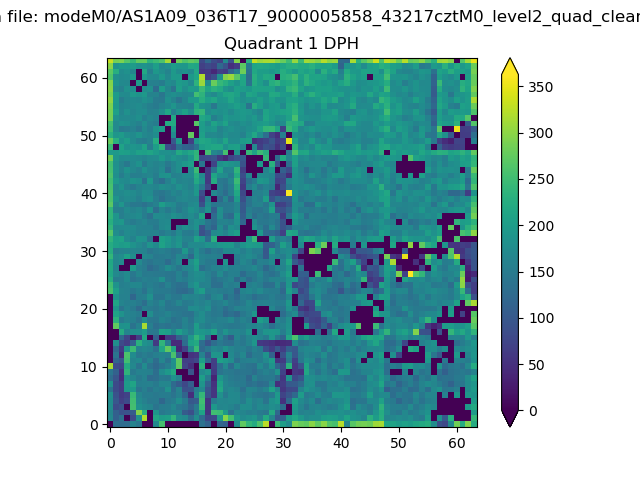 |
Quadrant B |
|---|---|---|---|
| Quadrant D | 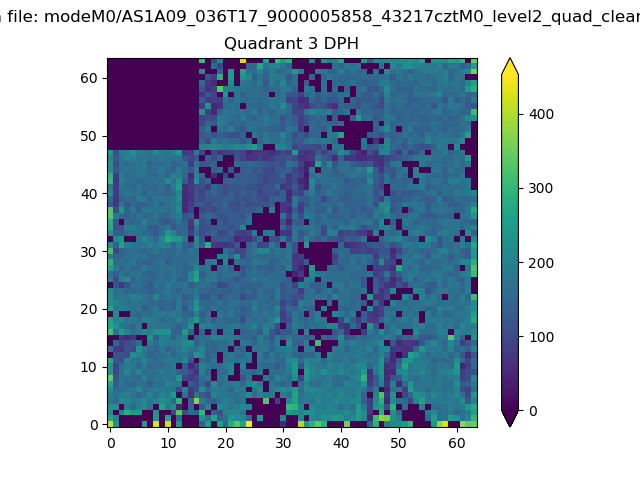 |
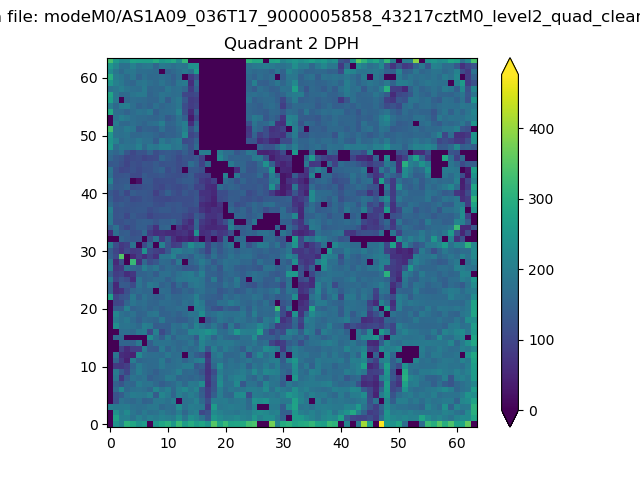 |
Quadrant C |
| Plot type | Count rate plots | Images |
|---|---|---|
| Comparison with Poisson distribution Blue bars denote a histogram of data divided into 1 sec bins. Red curve is a Poisson curve with rate = median count rate of data. |
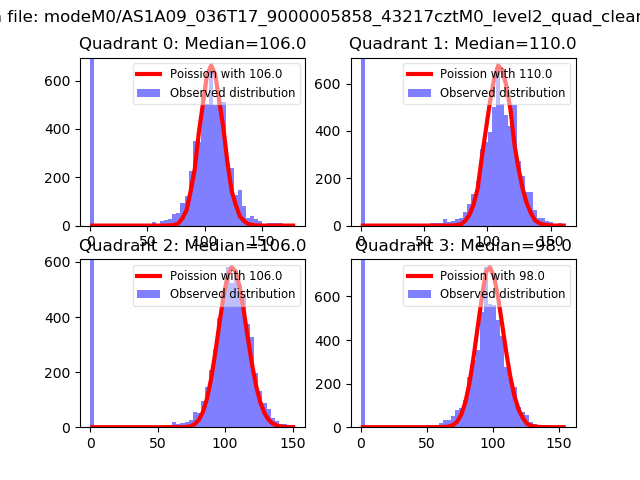 |
 |
| Quadrant-wise count rates Data is divided into 100 sec bins |
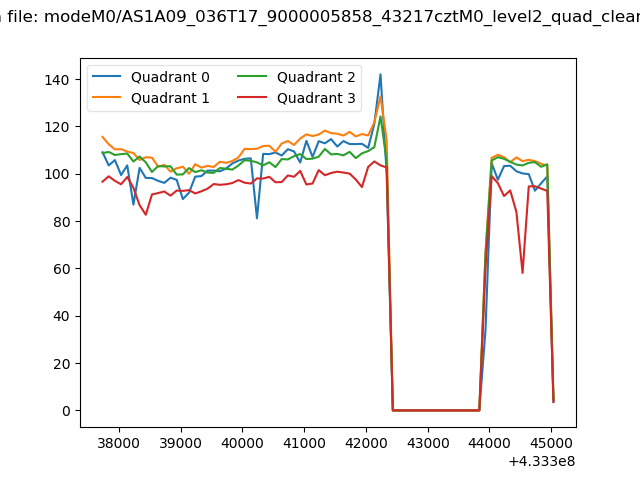 |
|
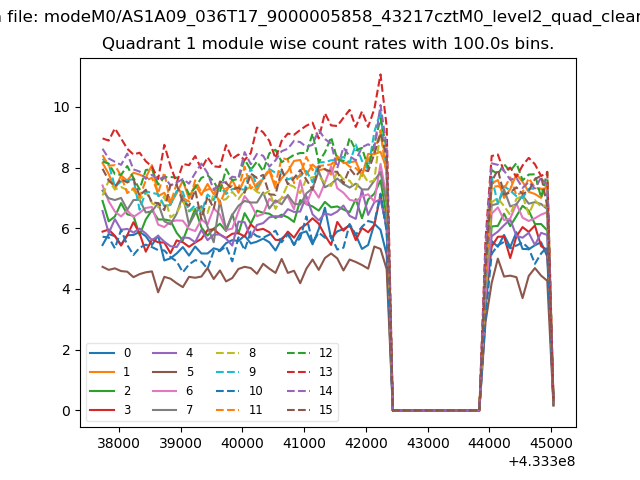
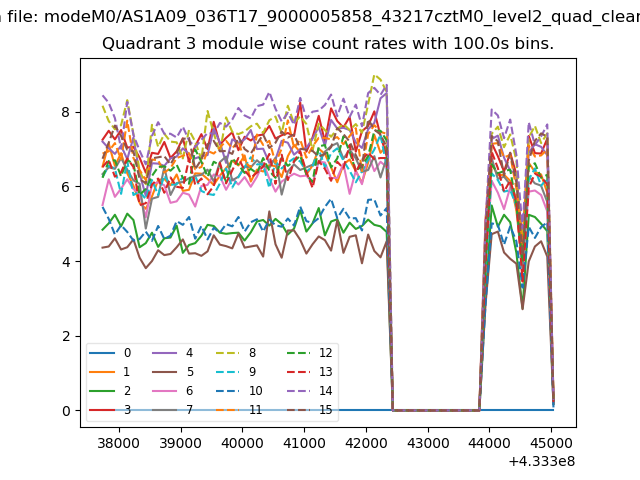
| Module-wise count rates for Quadrant A Data is divided into 100 sec bins |
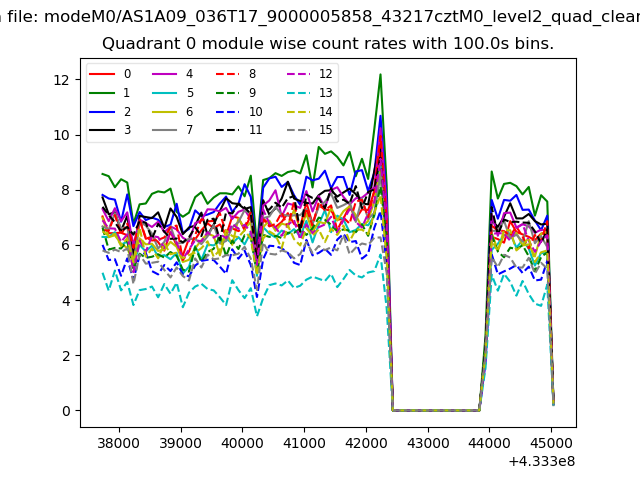 |
 |
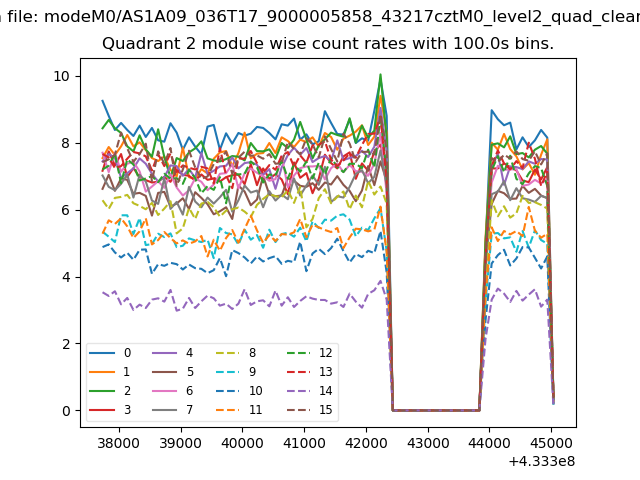
| Module-wise count rates for Quadrant B Data is divided into 100 sec bins |
 |
 |
| Module-wise count rates for Quadrant C Data is divided into 100 sec bins |
 |
 |
| Module-wise count rates for Quadrant D Data is divided into 100 sec bins |
 |
 |
| Parameter | Plot |
|---|---|
| CZT HV Monitor | 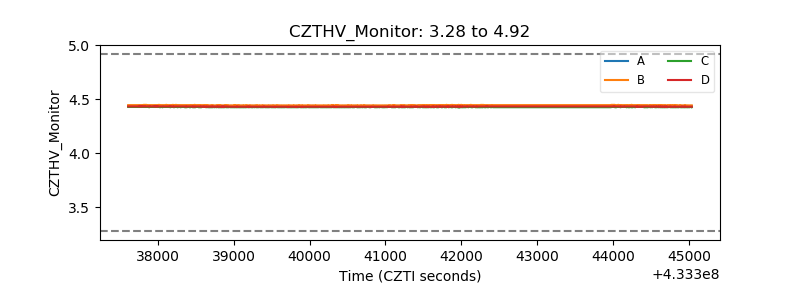 |
| D_VDD | 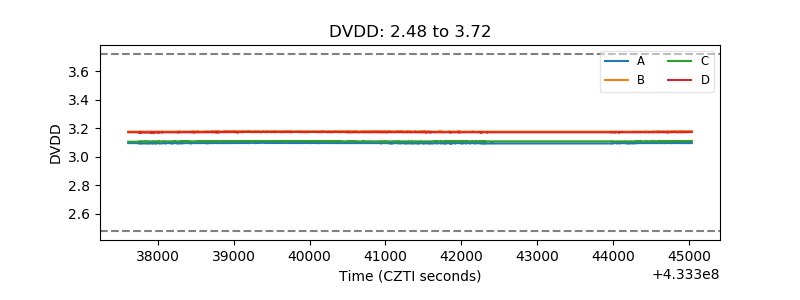 |
| Temperature 1 | 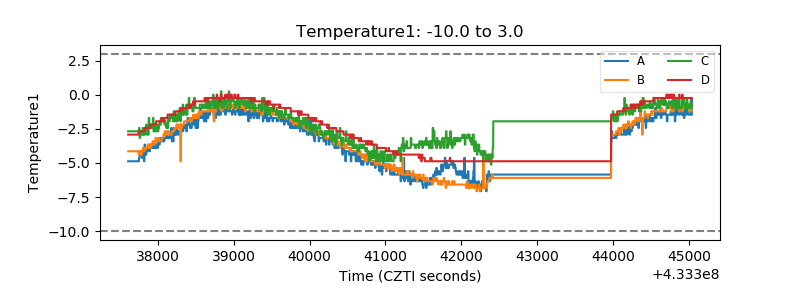 |
| Veto HV Monitor | 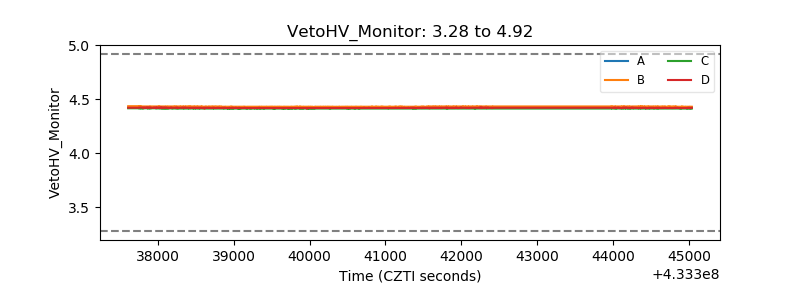 |
| Veto LLD | 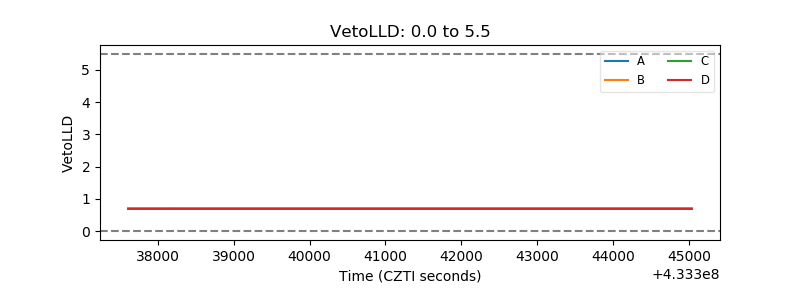 |
| Alpha Counter | 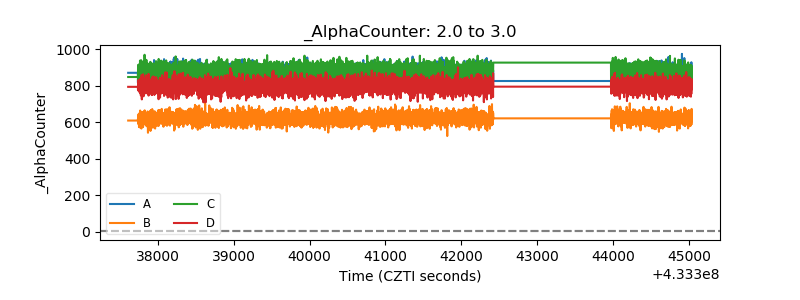 |
| _CPM_Rate | 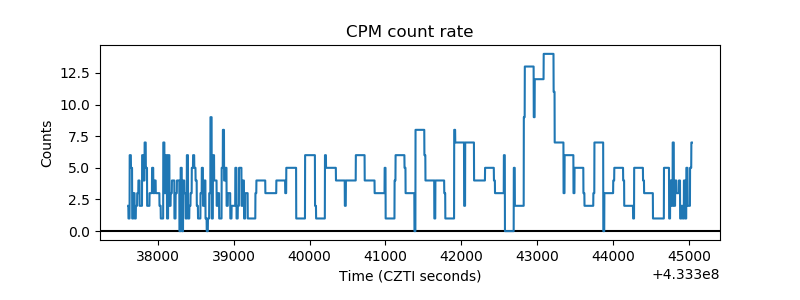 |
| CZT Counter | 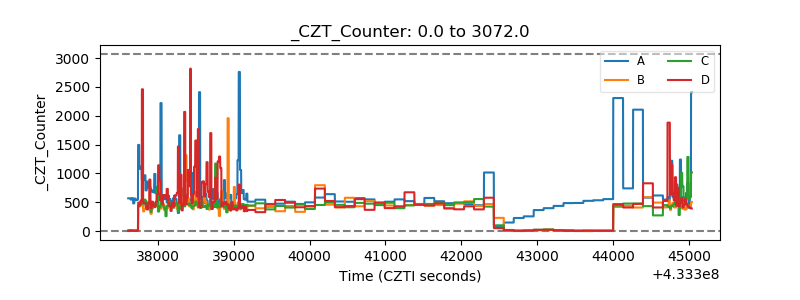 |
| +2.5 Volts monitor | 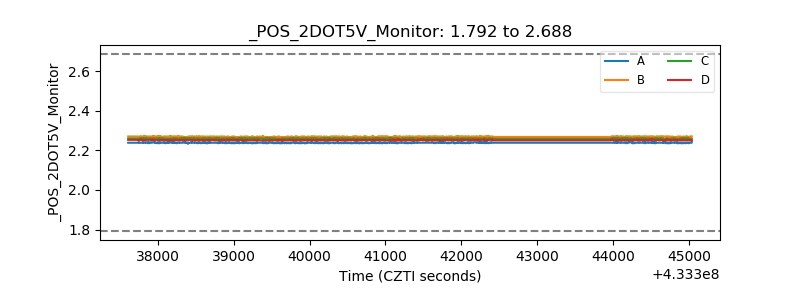 |
| +5 Volts monitor | 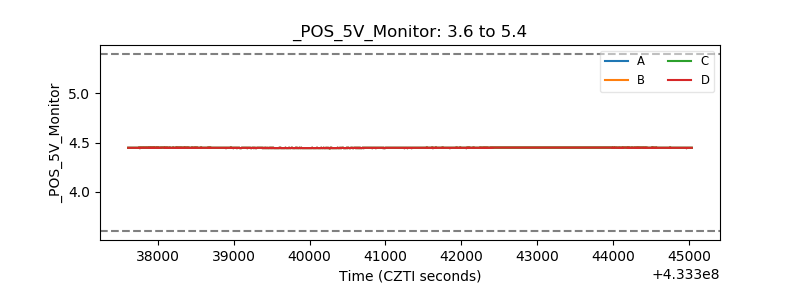 |
| _ROLL_ROT | 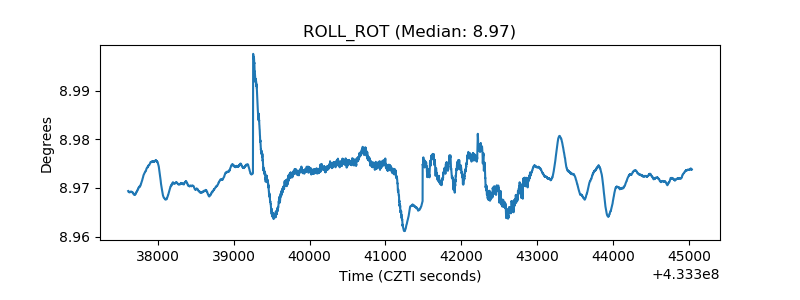 |
| _Roll_DEC | 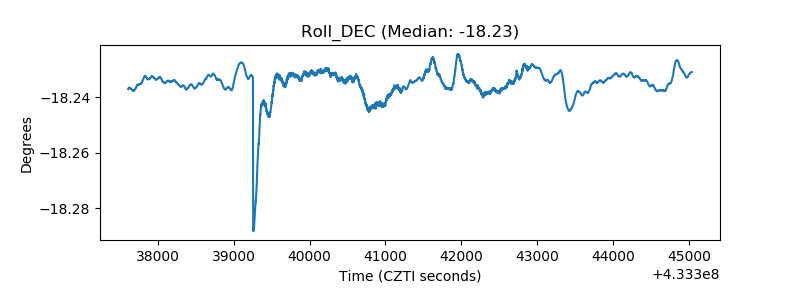 |
| _Roll_RA | 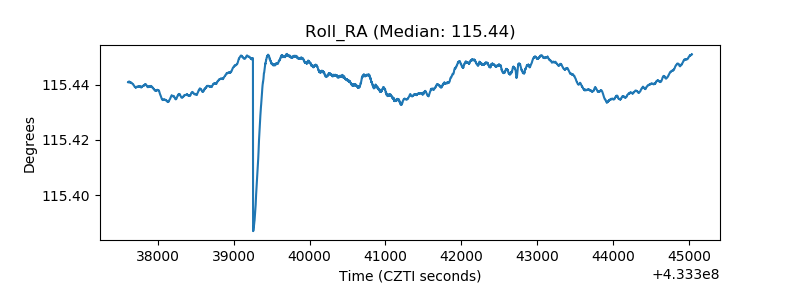 |
| Veto Counter | 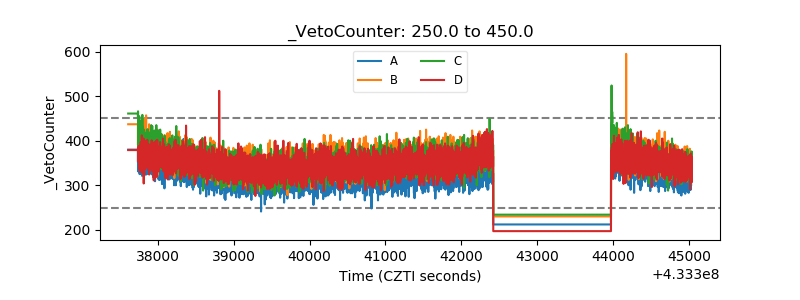 |