| Param | Original file | Final file |
|---|---|---|
| Filename | modeM0/AS1A06_006T01_9000005860_43219cztM0_level2.fits | modeM0/AS1A06_006T01_9000005860_43219cztM0_level2_quad_clean.evt |
| Size (bytes) | 207,411,840 | 45,982,080 |
| Size | 197.8 MB | 43.9 MB |
| Events in quadrant A | 2,074,247 | 295,100 |
| Events in quadrant B | 1,598,518 | 313,501 |
| Events in quadrant C | 1,336,708 | 305,988 |
| Events in quadrant D | 2,445,371 | 274,473 |
| Mode SS | |||
|---|---|---|---|
| Quadrant | BADHDUFLAG | Total packets | Discarded packets |
| A | 0 | 60 | 0 |
| B | 0 | 60 | 0 |
| C | 0 | 60 | 0 |
| D | 0 | 60 | 0 |
| Mode M9 | |||
|---|---|---|---|
| Quadrant | BADHDUFLAG | Total packets | Discarded packets |
| A | 0 | 13 | 0 |
| B | 0 | 13 | 0 |
| C | 0 | 13 | 0 |
| D | 0 | 13 | 0 |
| Mode M0 | |||
|---|---|---|---|
| Quadrant | BADHDUFLAG | Total packets | Discarded packets |
| A | 0 | 7930 | 1 |
| B | 0 | 6709 | 1 |
| C | 0 | 5715 | 1 |
| D | 0 | 9172 | 3 |
| Quadrant | Total seconds | Saturated seconds | Saturation percentage |
|---|---|---|---|
| A | 2840 | 176 | 6.197183% |
| B | 2840 | 98 | 3.450704% |
| C | 2840 | 2 | 0.070423% |
| D | 2839 | 156 | 5.494893% |
Noise dominated data is calculated using 1-second bins in cleaned event files. If a bin has >2000 counts, and if more than 50% of those come from <1% of pixels, then it is considered to be noise-dominated and hence unusable.
| Quadrant | # 1 sec bins | Bins with >0 counts | Bins with >2000 counts | High rate bins dominated by noise | Noise dominated (total time) | Noise dominated (detector-on time) | Marked lightcurve |
|---|---|---|---|---|---|---|---|
| A | 4122 | 2841 | 136 | 136 | 3.30% | 4.79% | 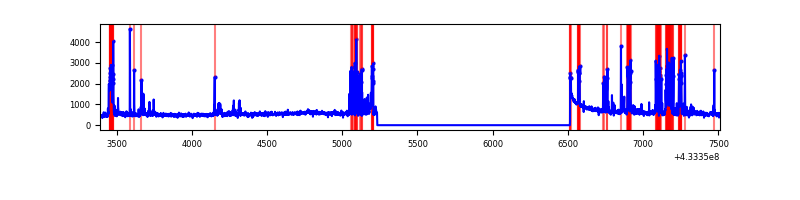 |
| B | 4122 | 2841 | 74 | 74 | 1.80% | 2.60% | 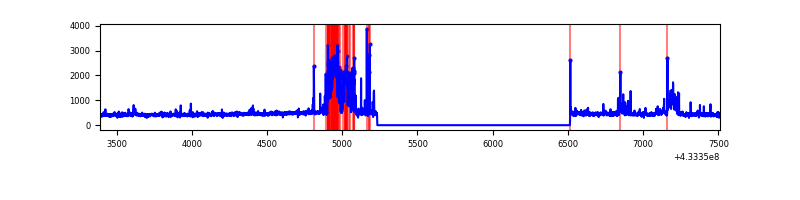 |
| C | 4122 | 2841 | 0 | 0 | 0.00% | 0.00% | 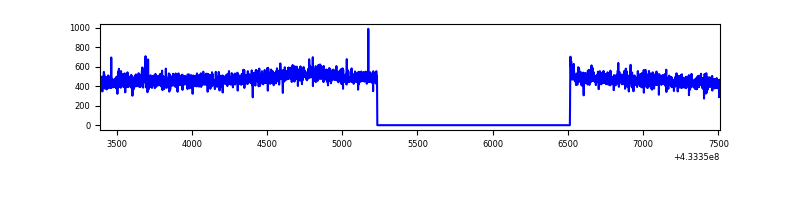 |
| D | 4121 | 2840 | 147 | 147 | 3.57% | 5.18% | 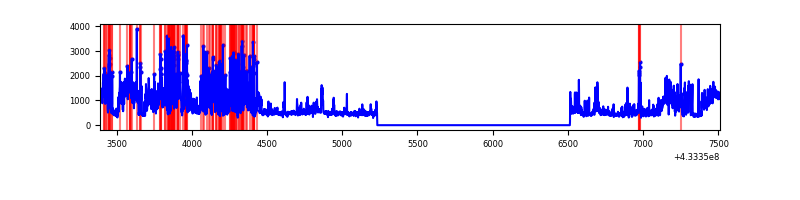 |
Top three noisy pixels from each quadrant. If the there are fewer than three noisy pixels in the level2.evt file, extra rows are filled as -1
| Pixel properties | Quadrant properties | ||||||
|---|---|---|---|---|---|---|---|
| Quadrant | DetID | PixID | Counts | Sigma | Mean | Median | Sigma |
| A | 15 | 237 | 398966 | 6039.5 | 309 | 302 | 66.0 |
| A | 10 | 83 | 304776 | 4612.58 | 309 | 302 | 66.0 |
| A | 13 | 248 | 119838 | 1810.89 | 309 | 302 | 66.0 |
| B | 5 | 172 | 272986 | 4316.94 | 311 | 302 | 63.2 |
| B | 5 | 32 | 43732 | 687.55 | 311 | 302 | 63.2 |
| B | 0 | 189 | 21367 | 333.49 | 311 | 302 | 63.2 |
| C | 15 | 214 | 116504 | 1556.89 | 311 | 313 | 74.6 |
| C | 14 | 254 | 6088 | 77.38 | 311 | 313 | 74.6 |
| C | 3 | 233 | 2184 | 25.07 | 311 | 313 | 74.6 |
| D | 1 | 52 | 592591 | 7731.64 | 306 | 297 | 76.6 |
| D | 1 | 20 | 537061 | 7006.77 | 306 | 297 | 76.6 |
| D | 1 | 47 | 61036 | 792.87 | 306 | 297 | 76.6 |
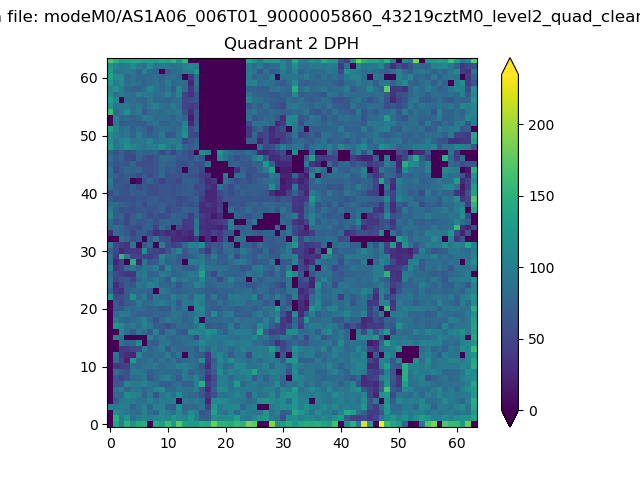
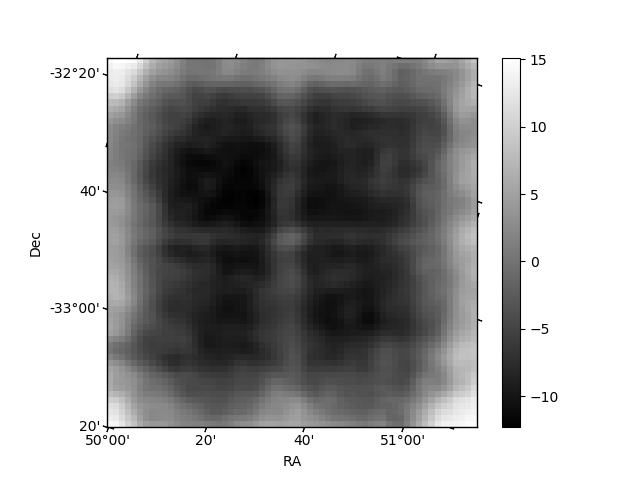
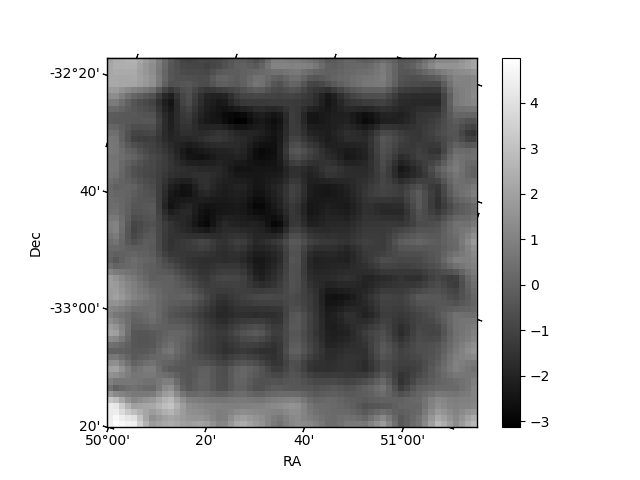
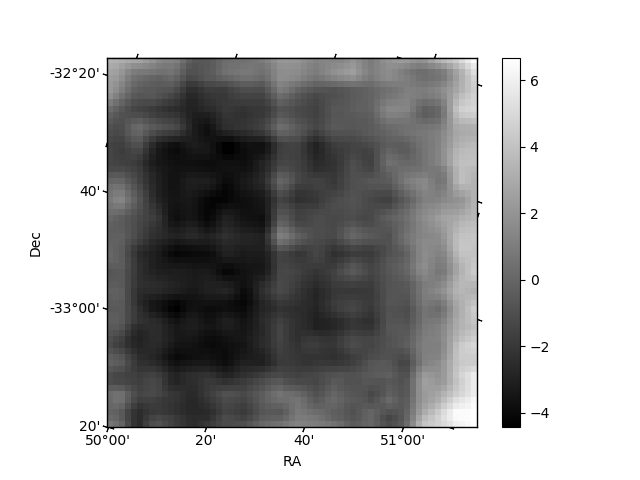
Histogram calculated using DETX and DETY for each event in the final _common_clean file
| Quadrant A | 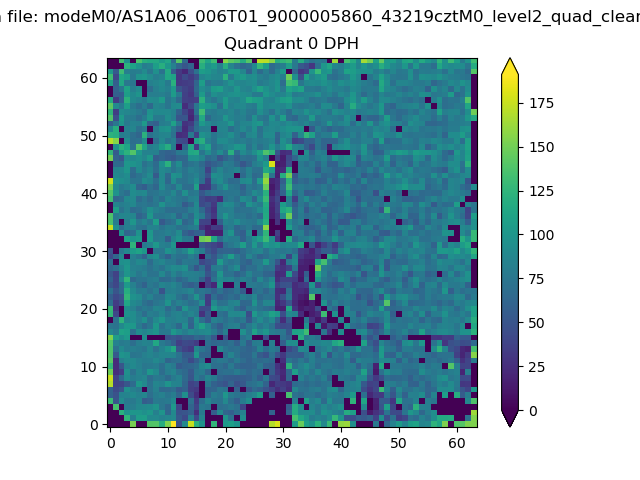 |
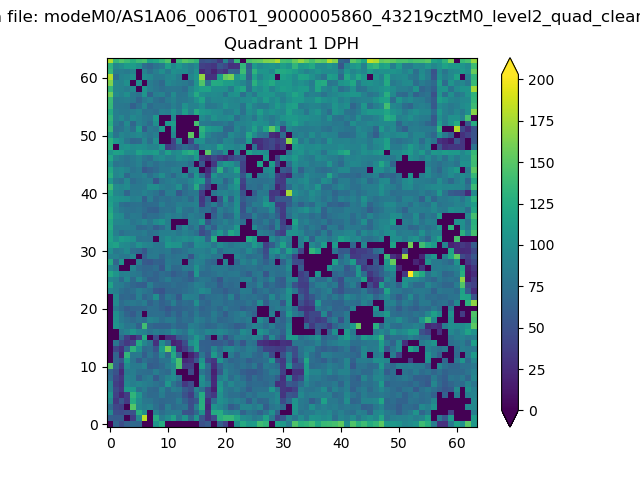 |
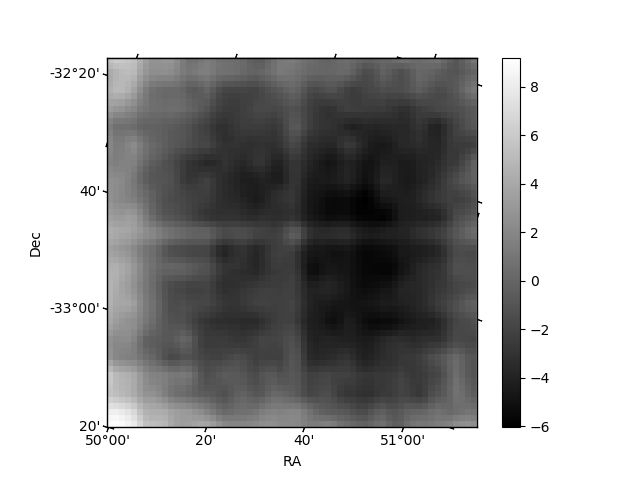
Quadrant B |
|---|---|---|---|
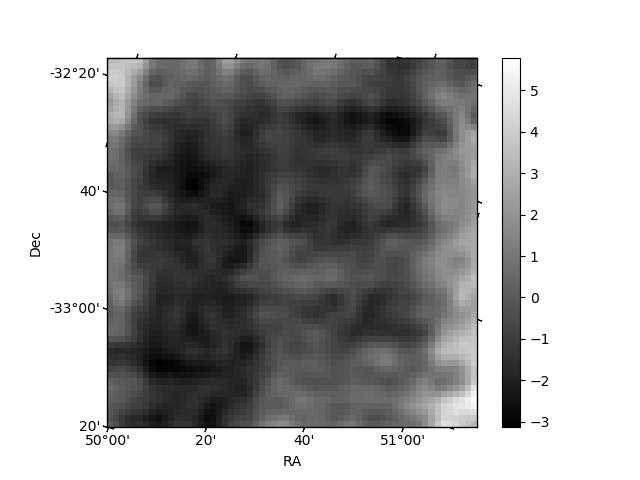
| Quadrant D | 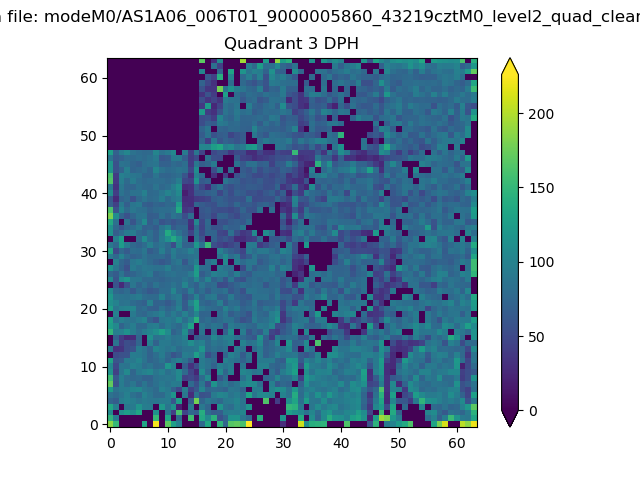 |
 |
Quadrant C |
| Plot type | Count rate plots | Images |
|---|---|---|
| Comparison with Poisson distribution Blue bars denote a histogram of data divided into 1 sec bins. Red curve is a Poisson curve with rate = median count rate of data. |
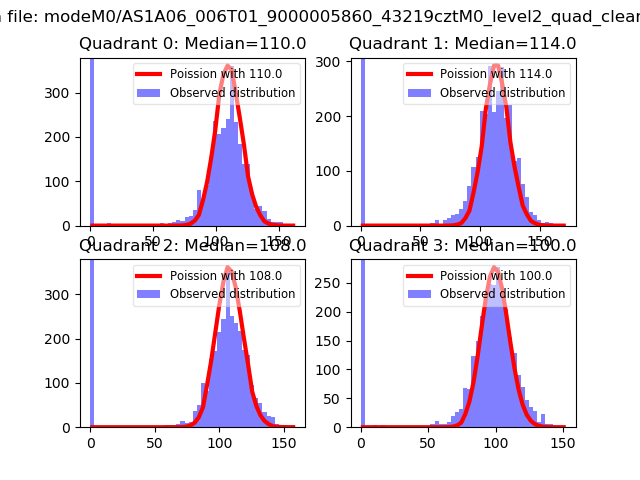 |
 |
| Quadrant-wise count rates Data is divided into 100 sec bins |
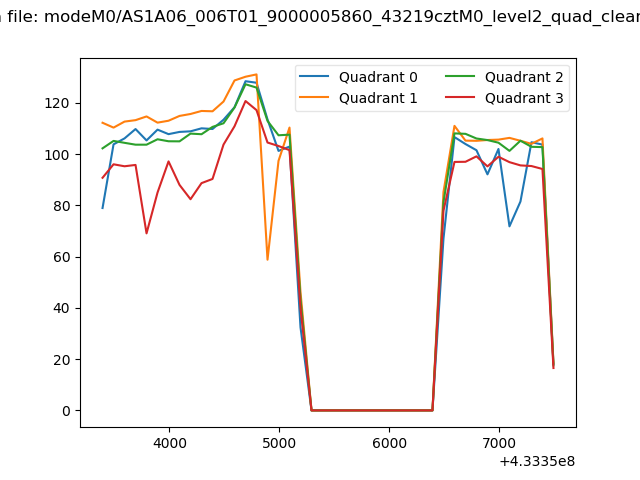 |
|
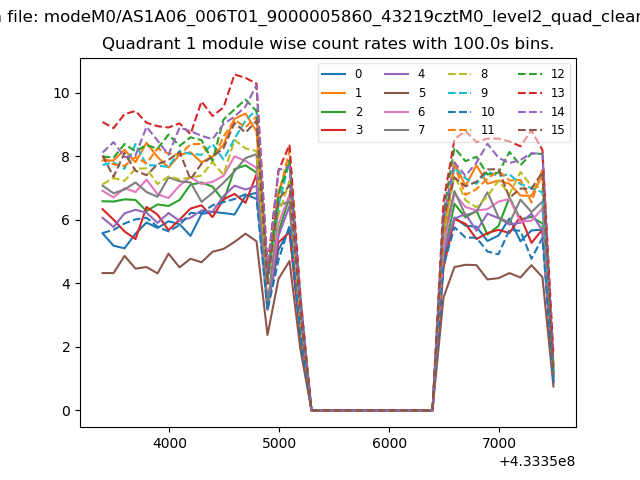
| Module-wise count rates for Quadrant A Data is divided into 100 sec bins |
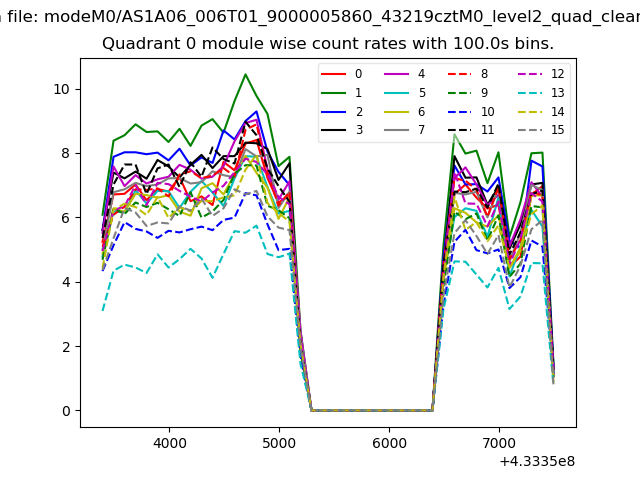 |
 |
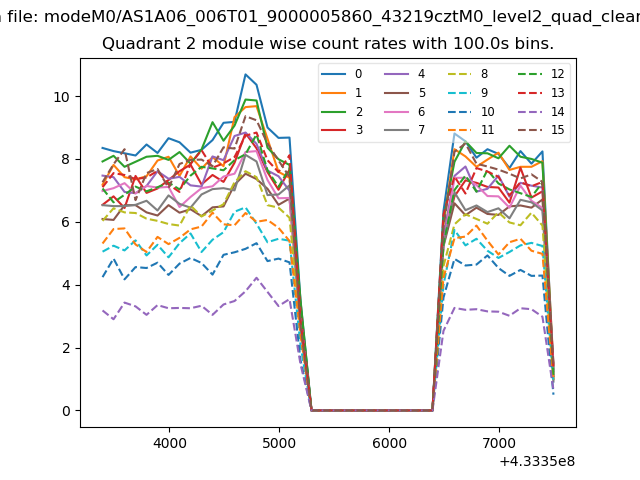
| Module-wise count rates for Quadrant B Data is divided into 100 sec bins |
 |
 |
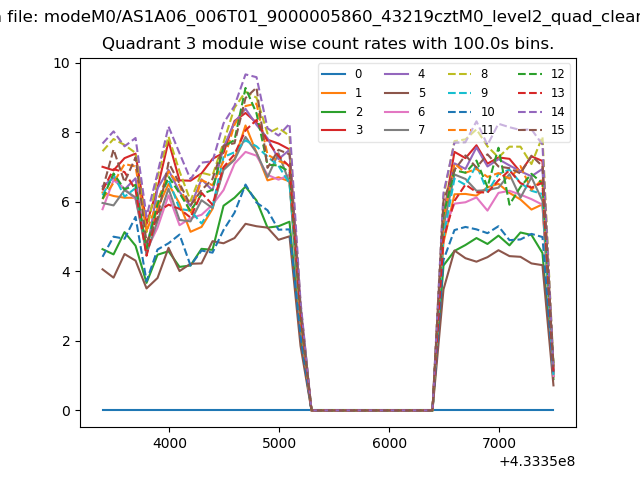
| Module-wise count rates for Quadrant C Data is divided into 100 sec bins |
 |
 |
| Module-wise count rates for Quadrant D Data is divided into 100 sec bins |
 |
 |
| Parameter | Plot |
|---|---|
| CZT HV Monitor | 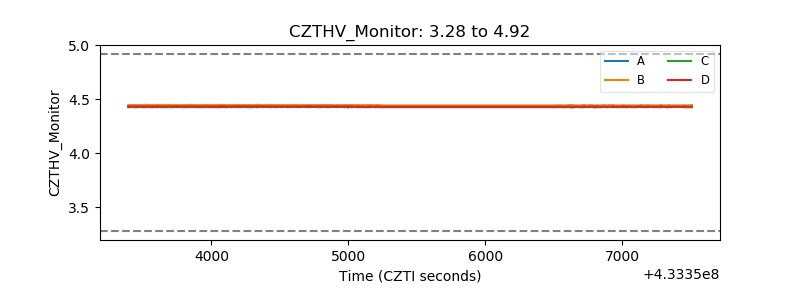 |
| D_VDD | 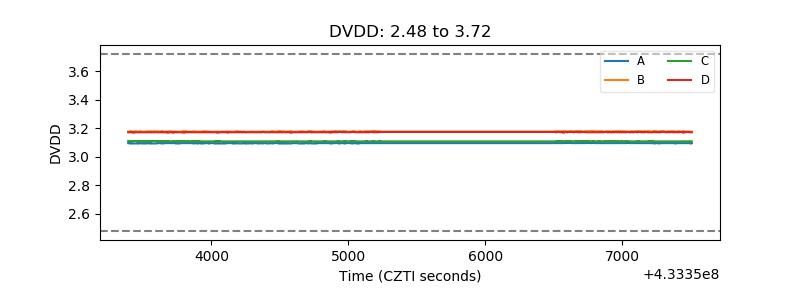 |
| Temperature 1 | 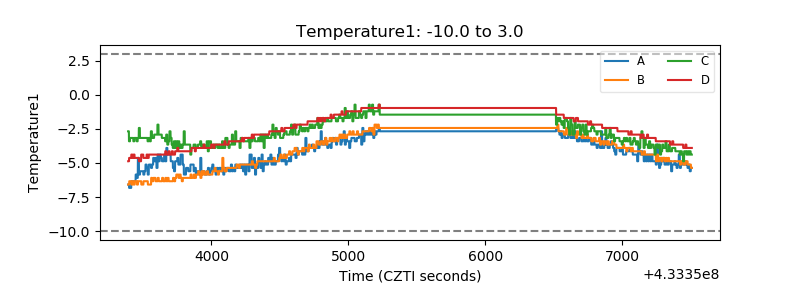 |
| Veto HV Monitor |  |
| Veto LLD | 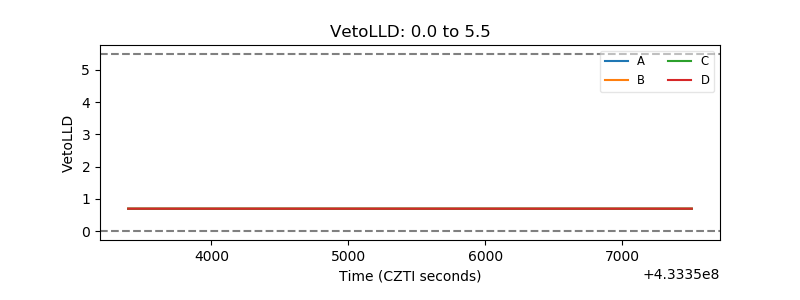 |
| Alpha Counter | 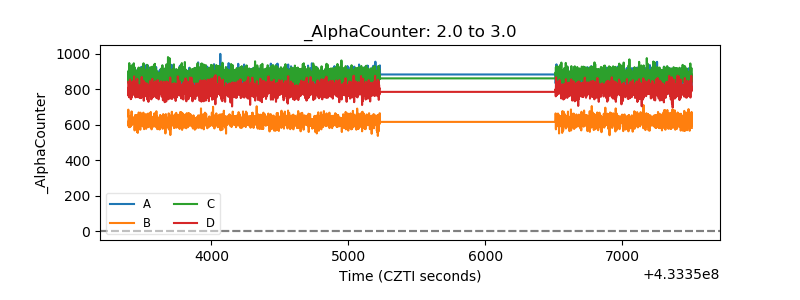 |
| _CPM_Rate | 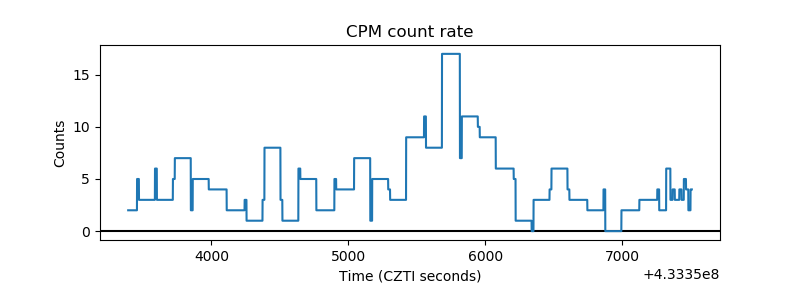 |
| CZT Counter | 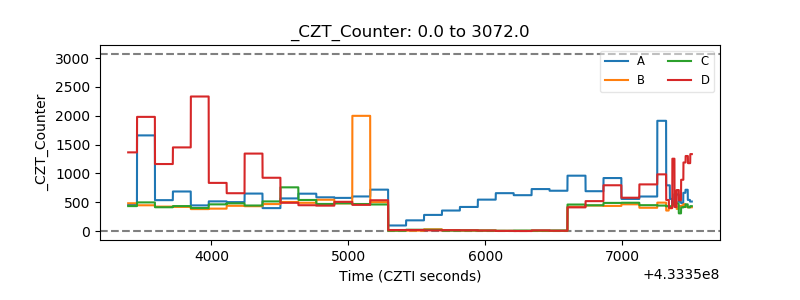 |
| +2.5 Volts monitor | 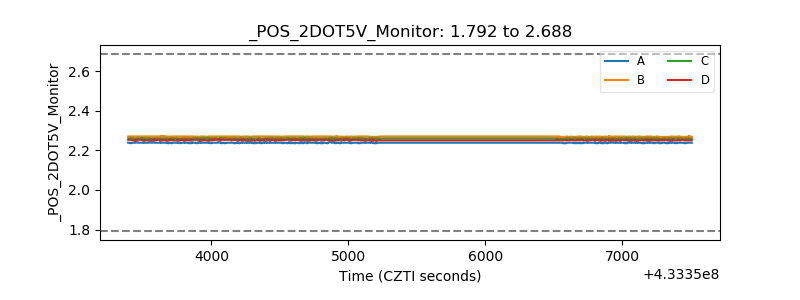 |
| +5 Volts monitor | 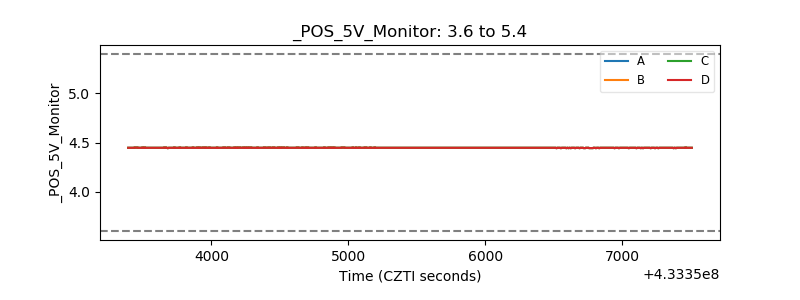 |
| _ROLL_ROT | 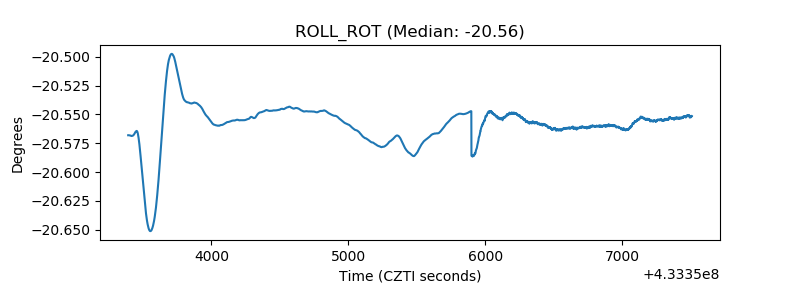 |
| _Roll_DEC | 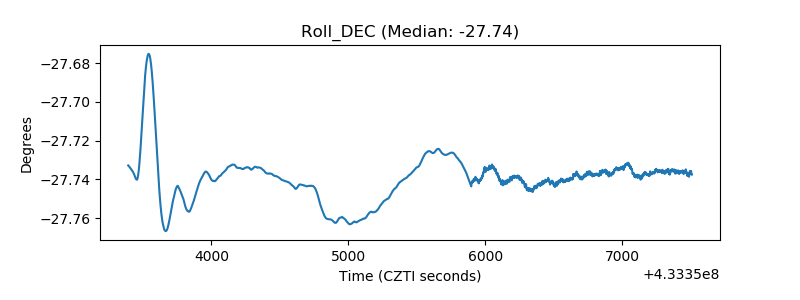 |
| _Roll_RA | 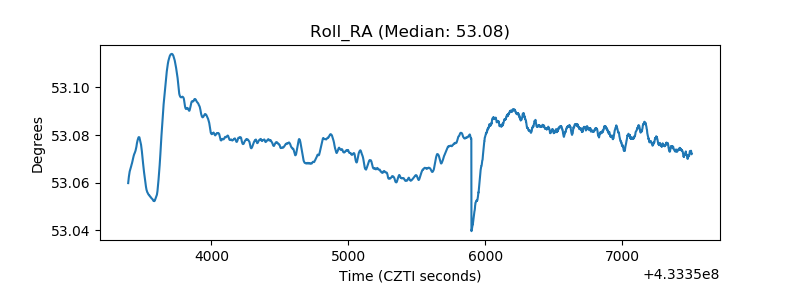 |
| Veto Counter | 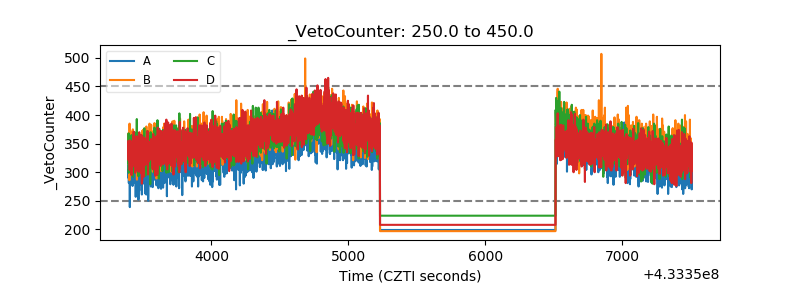 |