| Param | Original file | Final file |
|---|---|---|
| Filename | modeM0/AS1A06_006T01_9000005860_43223cztM0_level2.fits | modeM0/AS1A06_006T01_9000005860_43223cztM0_level2_quad_clean.evt |
| Size (bytes) | 1,322,786,880 | 320,232,960 |
| Size | 1.2 GB | 305.4 MB |
| Events in quadrant A | 13,105,209 | 2,112,266 |
| Events in quadrant B | 9,145,940 | 2,219,932 |
| Events in quadrant C | 9,494,906 | 2,097,154 |
| Events in quadrant D | 15,644,554 | 1,864,397 |
| Mode SS | |||
|---|---|---|---|
| Quadrant | BADHDUFLAG | Total packets | Discarded packets |
| A | 0 | 418 | 0 |
| B | 0 | 418 | 0 |
| C | 0 | 418 | 0 |
| D | 0 | 418 | 0 |
| Mode M9 | |||
|---|---|---|---|
| Quadrant | BADHDUFLAG | Total packets | Discarded packets |
| A | 0 | 72 | 0 |
| B | 0 | 72 | 0 |
| C | 0 | 72 | 0 |
| D | 0 | 72 | 0 |
| Mode M0 | |||
|---|---|---|---|
| Quadrant | BADHDUFLAG | Total packets | Discarded packets |
| A | 0 | 51983 | 5 |
| B | 0 | 42017 | 5 |
| C | 0 | 41720 | 5 |
| D | 0 | 61137 | 6 |
| Quadrant | Total seconds | Saturated seconds | Saturation percentage |
|---|---|---|---|
| A | 20353 | 586 | 2.879182% |
| B | 20354 | 103 | 0.506043% |
| C | 20354 | 77 | 0.378304% |
| D | 20353 | 921 | 4.525131% |
Noise dominated data is calculated using 1-second bins in cleaned event files. If a bin has >2000 counts, and if more than 50% of those come from <1% of pixels, then it is considered to be noise-dominated and hence unusable.
| Quadrant | # 1 sec bins | Bins with >0 counts | Bins with >2000 counts | High rate bins dominated by noise | Noise dominated (total time) | Noise dominated (detector-on time) | Marked lightcurve |
|---|---|---|---|---|---|---|---|
| A | 27604 | 20357 | 516 | 516 | 1.87% | 2.53% | 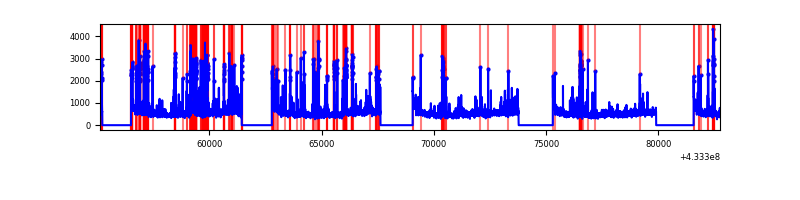 |
| B | 27605 | 20359 | 70 | 70 | 0.25% | 0.34% | 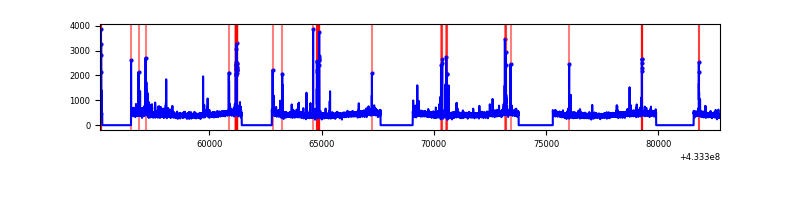 |
| C | 27605 | 20359 | 69 | 69 | 0.25% | 0.34% | 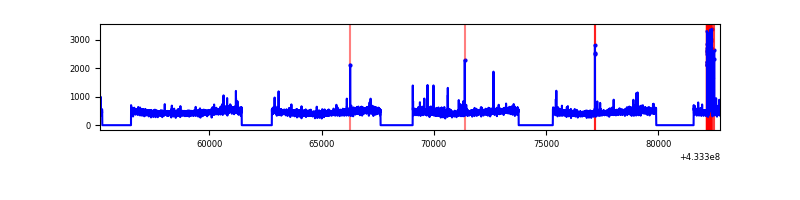 |
| D | 27604 | 20358 | 951 | 951 | 3.45% | 4.67% | 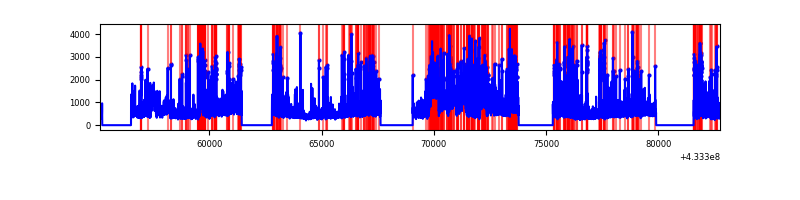 |
Top three noisy pixels from each quadrant. If the there are fewer than three noisy pixels in the level2.evt file, extra rows are filled as -1
| Pixel properties | Quadrant properties | ||||||
|---|---|---|---|---|---|---|---|
| Quadrant | DetID | PixID | Counts | Sigma | Mean | Median | Sigma |
| A | 10 | 83 | 1927105 | 4382.17 | 2149 | 2101 | 439.3 |
| A | 15 | 237 | 1729773 | 3932.96 | 2149 | 2101 | 439.3 |
| A | 13 | 248 | 598494 | 1357.66 | 2149 | 2101 | 439.3 |
| B | 5 | 172 | 307115 | 724.18 | 2167 | 2103 | 421.2 |
| B | 0 | 189 | 151277 | 354.18 | 2167 | 2103 | 421.2 |
| B | 5 | 255 | 70612 | 162.66 | 2167 | 2103 | 421.2 |
| C | 15 | 214 | 831551 | 1670.24 | 2136 | 2151 | 496.6 |
| C | 14 | 254 | 295746 | 591.24 | 2136 | 2151 | 496.6 |
| C | 3 | 233 | 14259 | 24.38 | 2136 | 2151 | 496.6 |
| D | 1 | 20 | 3374265 | 6598.52 | 2093 | 2035 | 511.1 |
| D | 1 | 52 | 1928422 | 3769.4 | 2093 | 2035 | 511.1 |
| D | 13 | 249 | 757740 | 1478.7 | 2093 | 2035 | 511.1 |
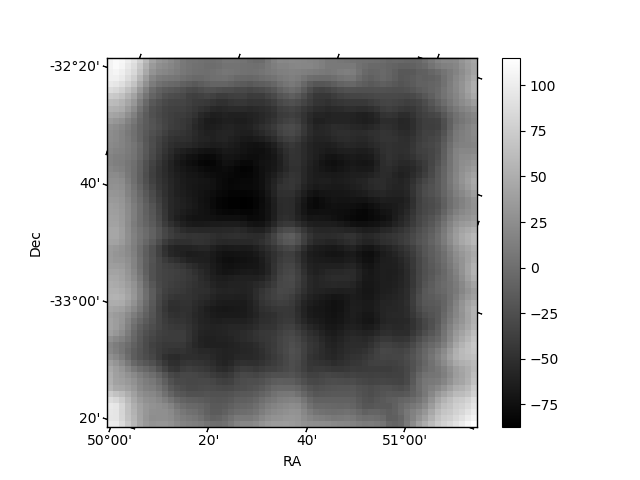
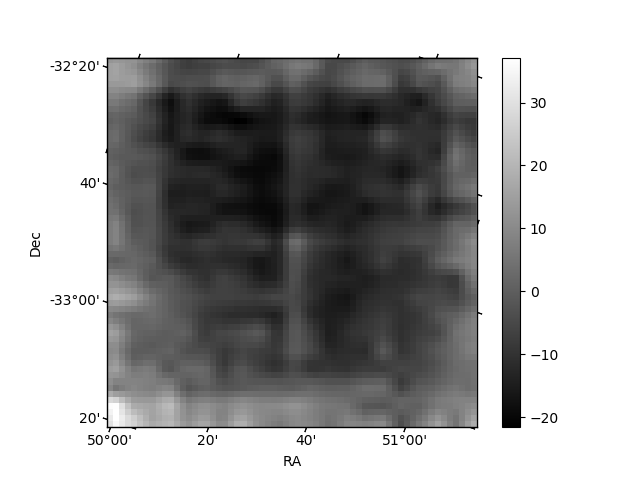
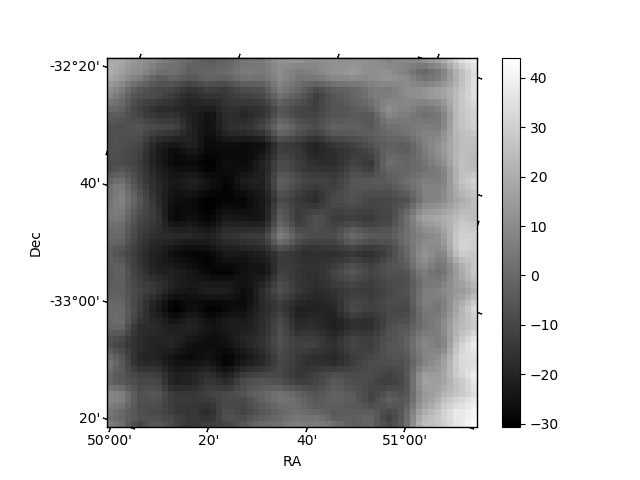
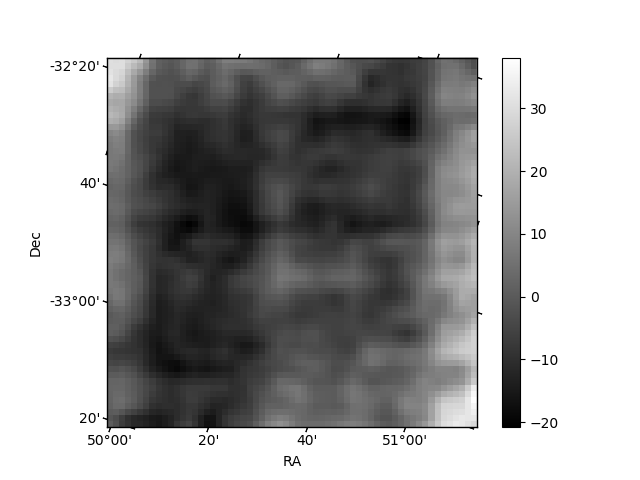
Histogram calculated using DETX and DETY for each event in the final _common_clean file
| Quadrant A | 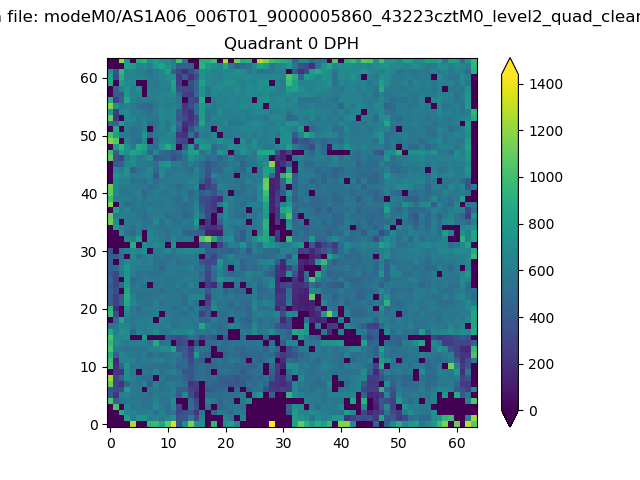 |
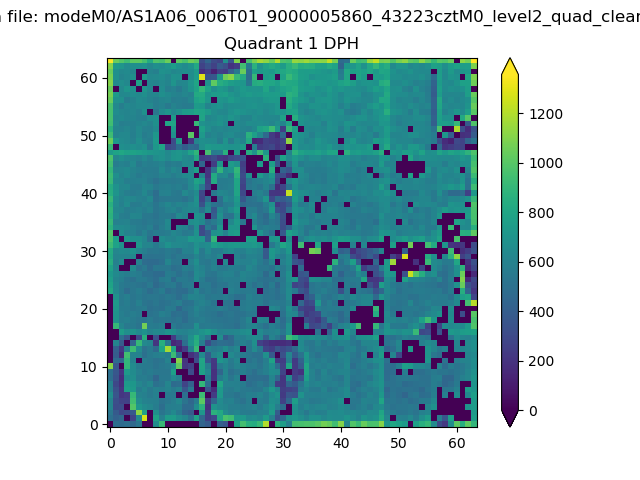 |
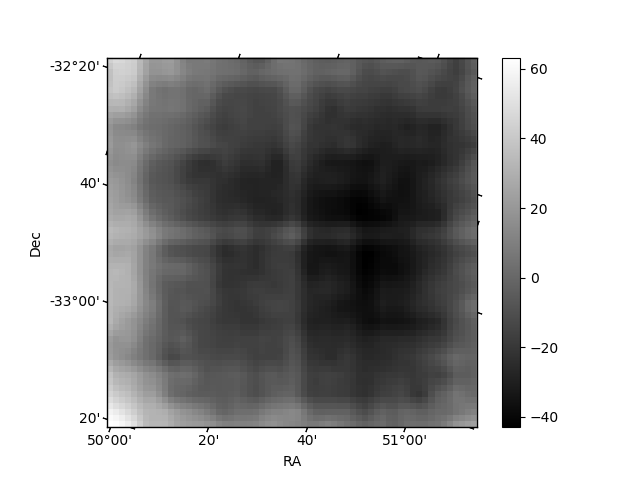
Quadrant B |
|---|---|---|---|
| Quadrant D | 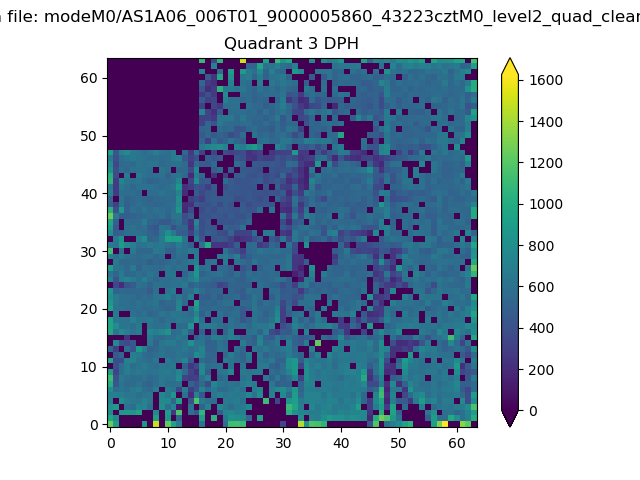 |
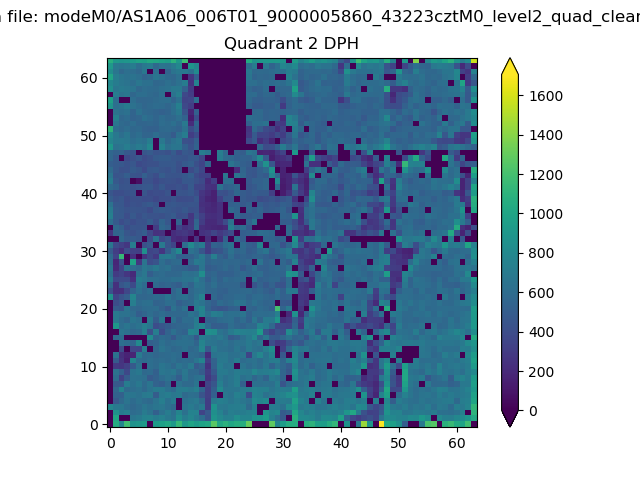 |
Quadrant C |
| Plot type | Count rate plots | Images |
|---|---|---|
| Comparison with Poisson distribution Blue bars denote a histogram of data divided into 1 sec bins. Red curve is a Poisson curve with rate = median count rate of data. |
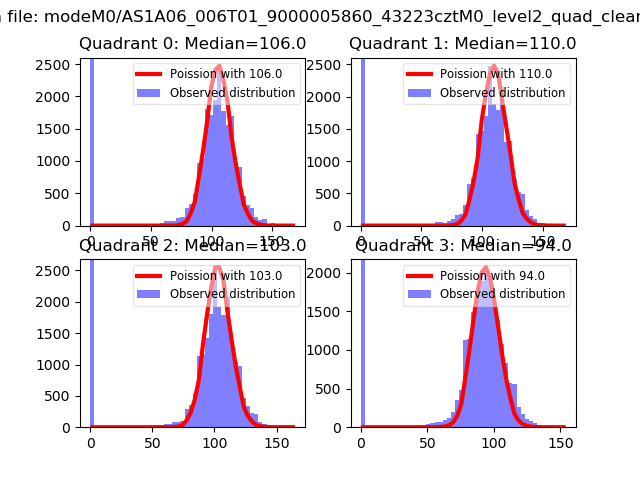 |
 |
| Quadrant-wise count rates Data is divided into 100 sec bins |
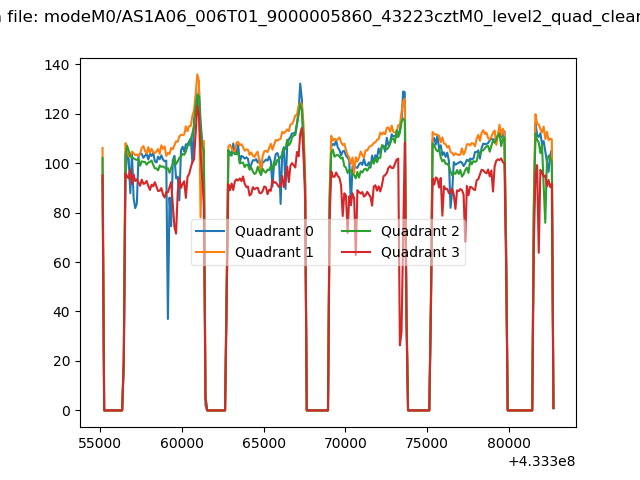 |
|
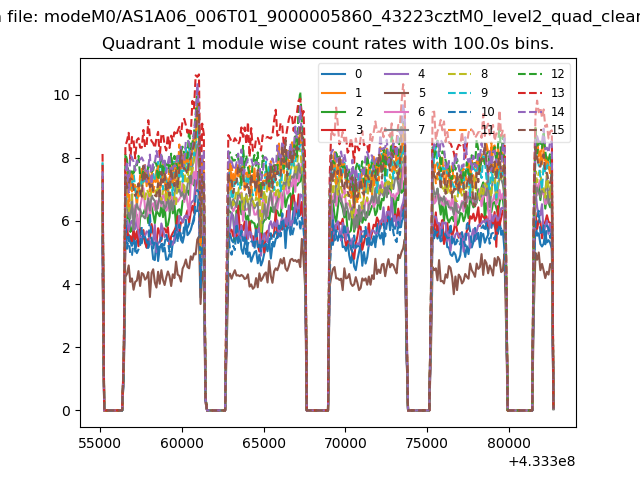
| Module-wise count rates for Quadrant A Data is divided into 100 sec bins |
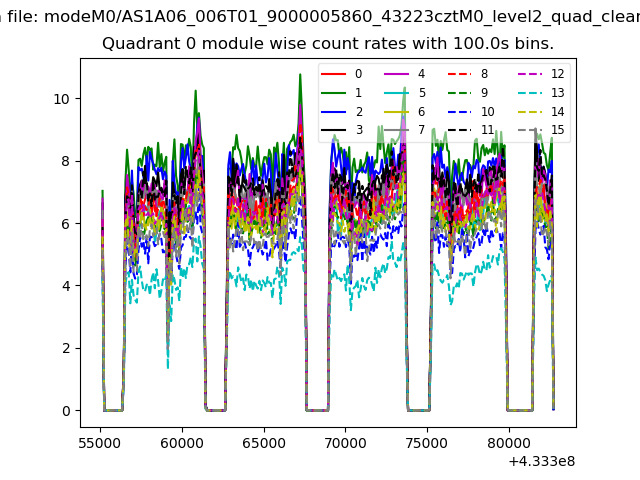 |
 |
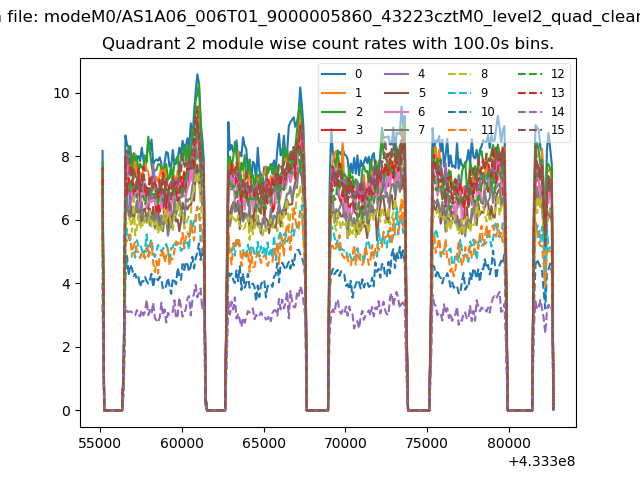
| Module-wise count rates for Quadrant B Data is divided into 100 sec bins |
 |
 |
| Module-wise count rates for Quadrant C Data is divided into 100 sec bins |
 |
 |
| Module-wise count rates for Quadrant D Data is divided into 100 sec bins |
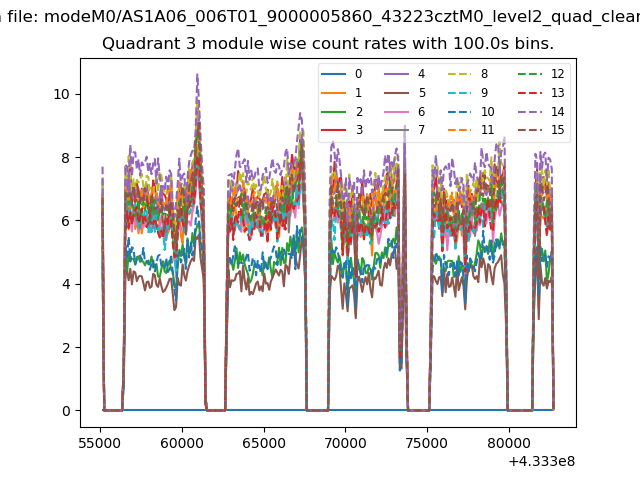 |
 |
| Parameter | Plot |
|---|---|
| CZT HV Monitor | 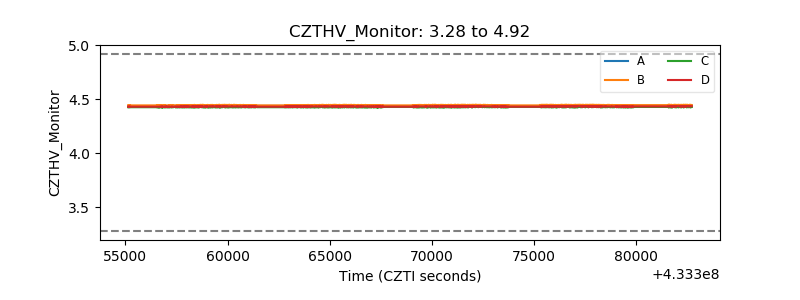 |
| D_VDD | 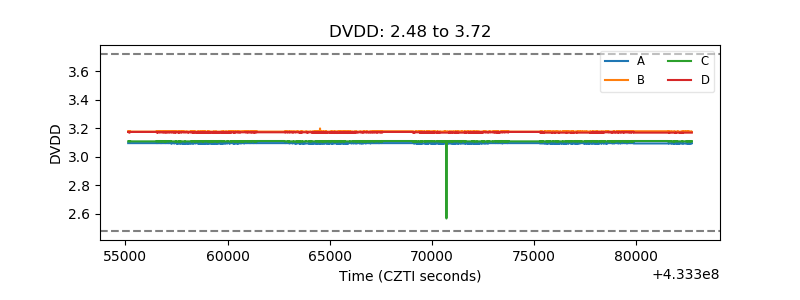 |
| Temperature 1 | 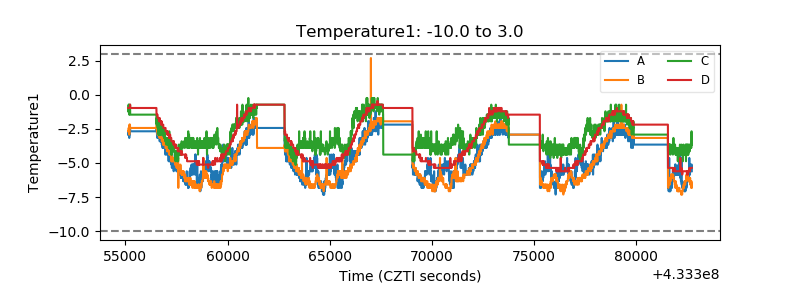 |
| Veto HV Monitor | 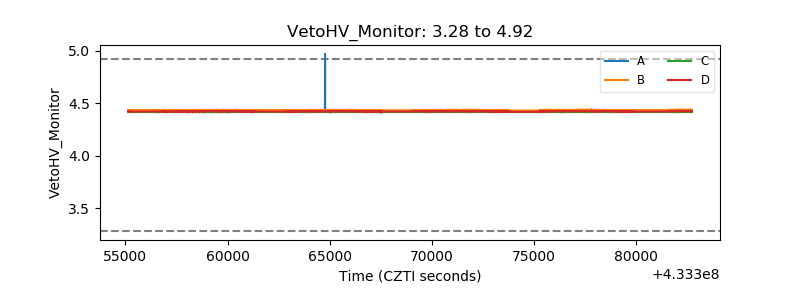 |
| Veto LLD | 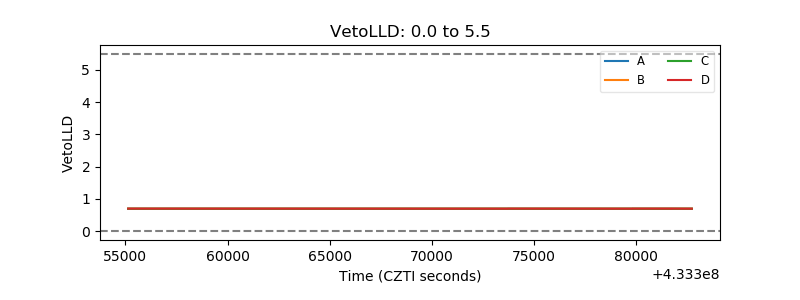 |
| Alpha Counter | 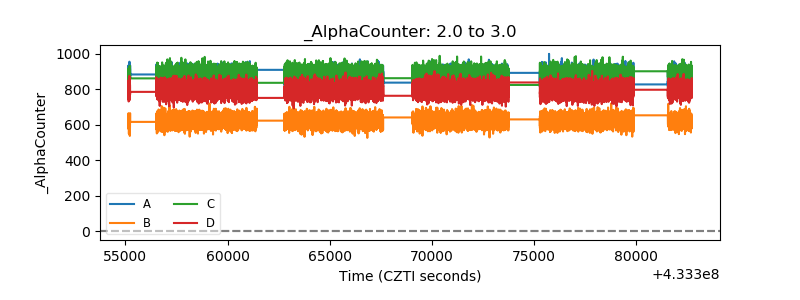 |
| _CPM_Rate | 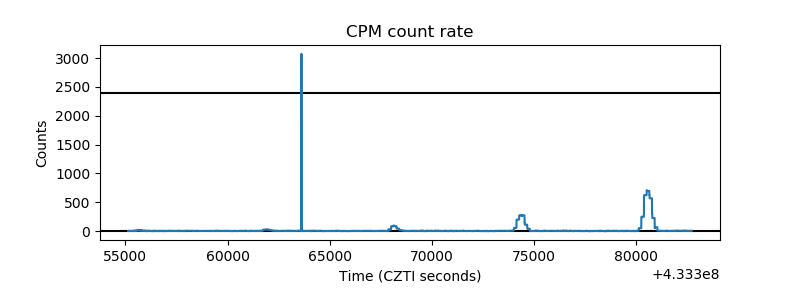 |
| CZT Counter | 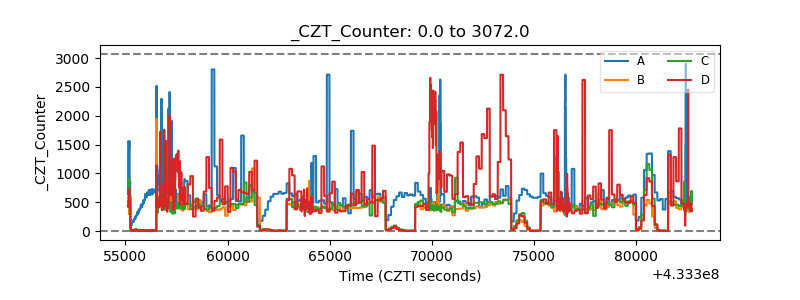 |
| +2.5 Volts monitor | 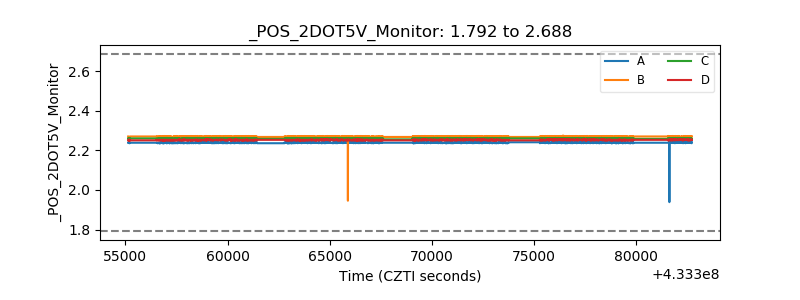 |
| +5 Volts monitor | 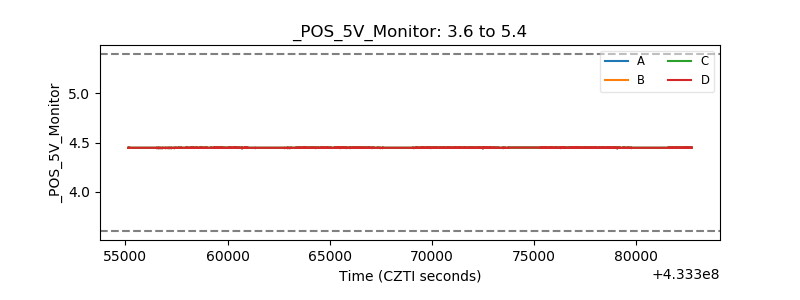 |
| _ROLL_ROT | 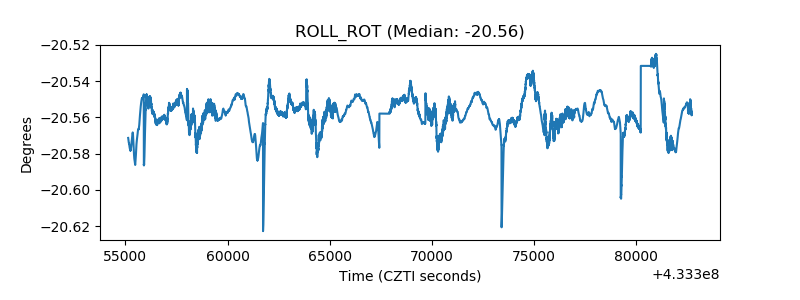 |
| _Roll_DEC | 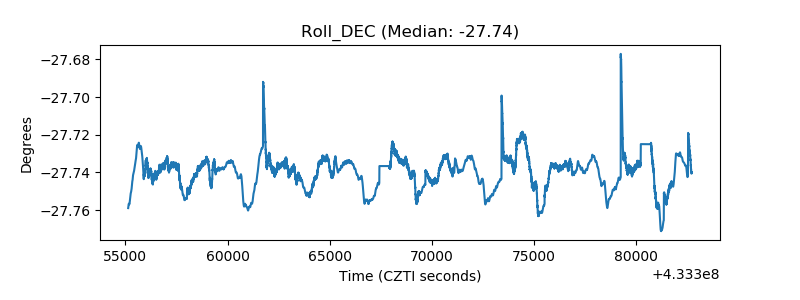 |
| _Roll_RA | 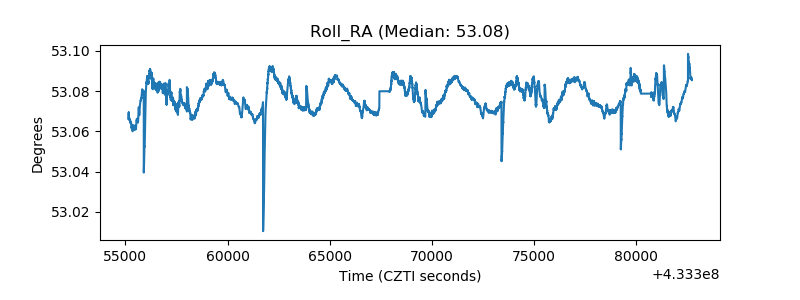 |
| Veto Counter | 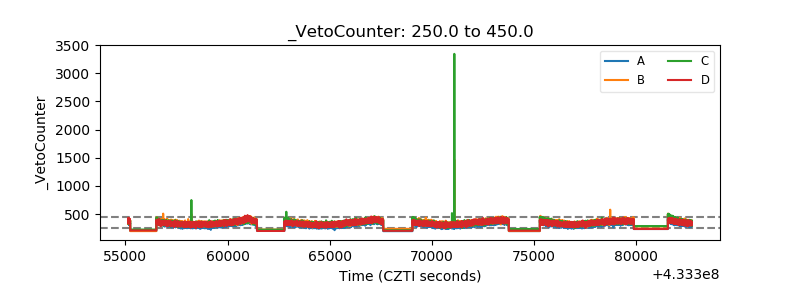 |